Jacob deGrom, Command God
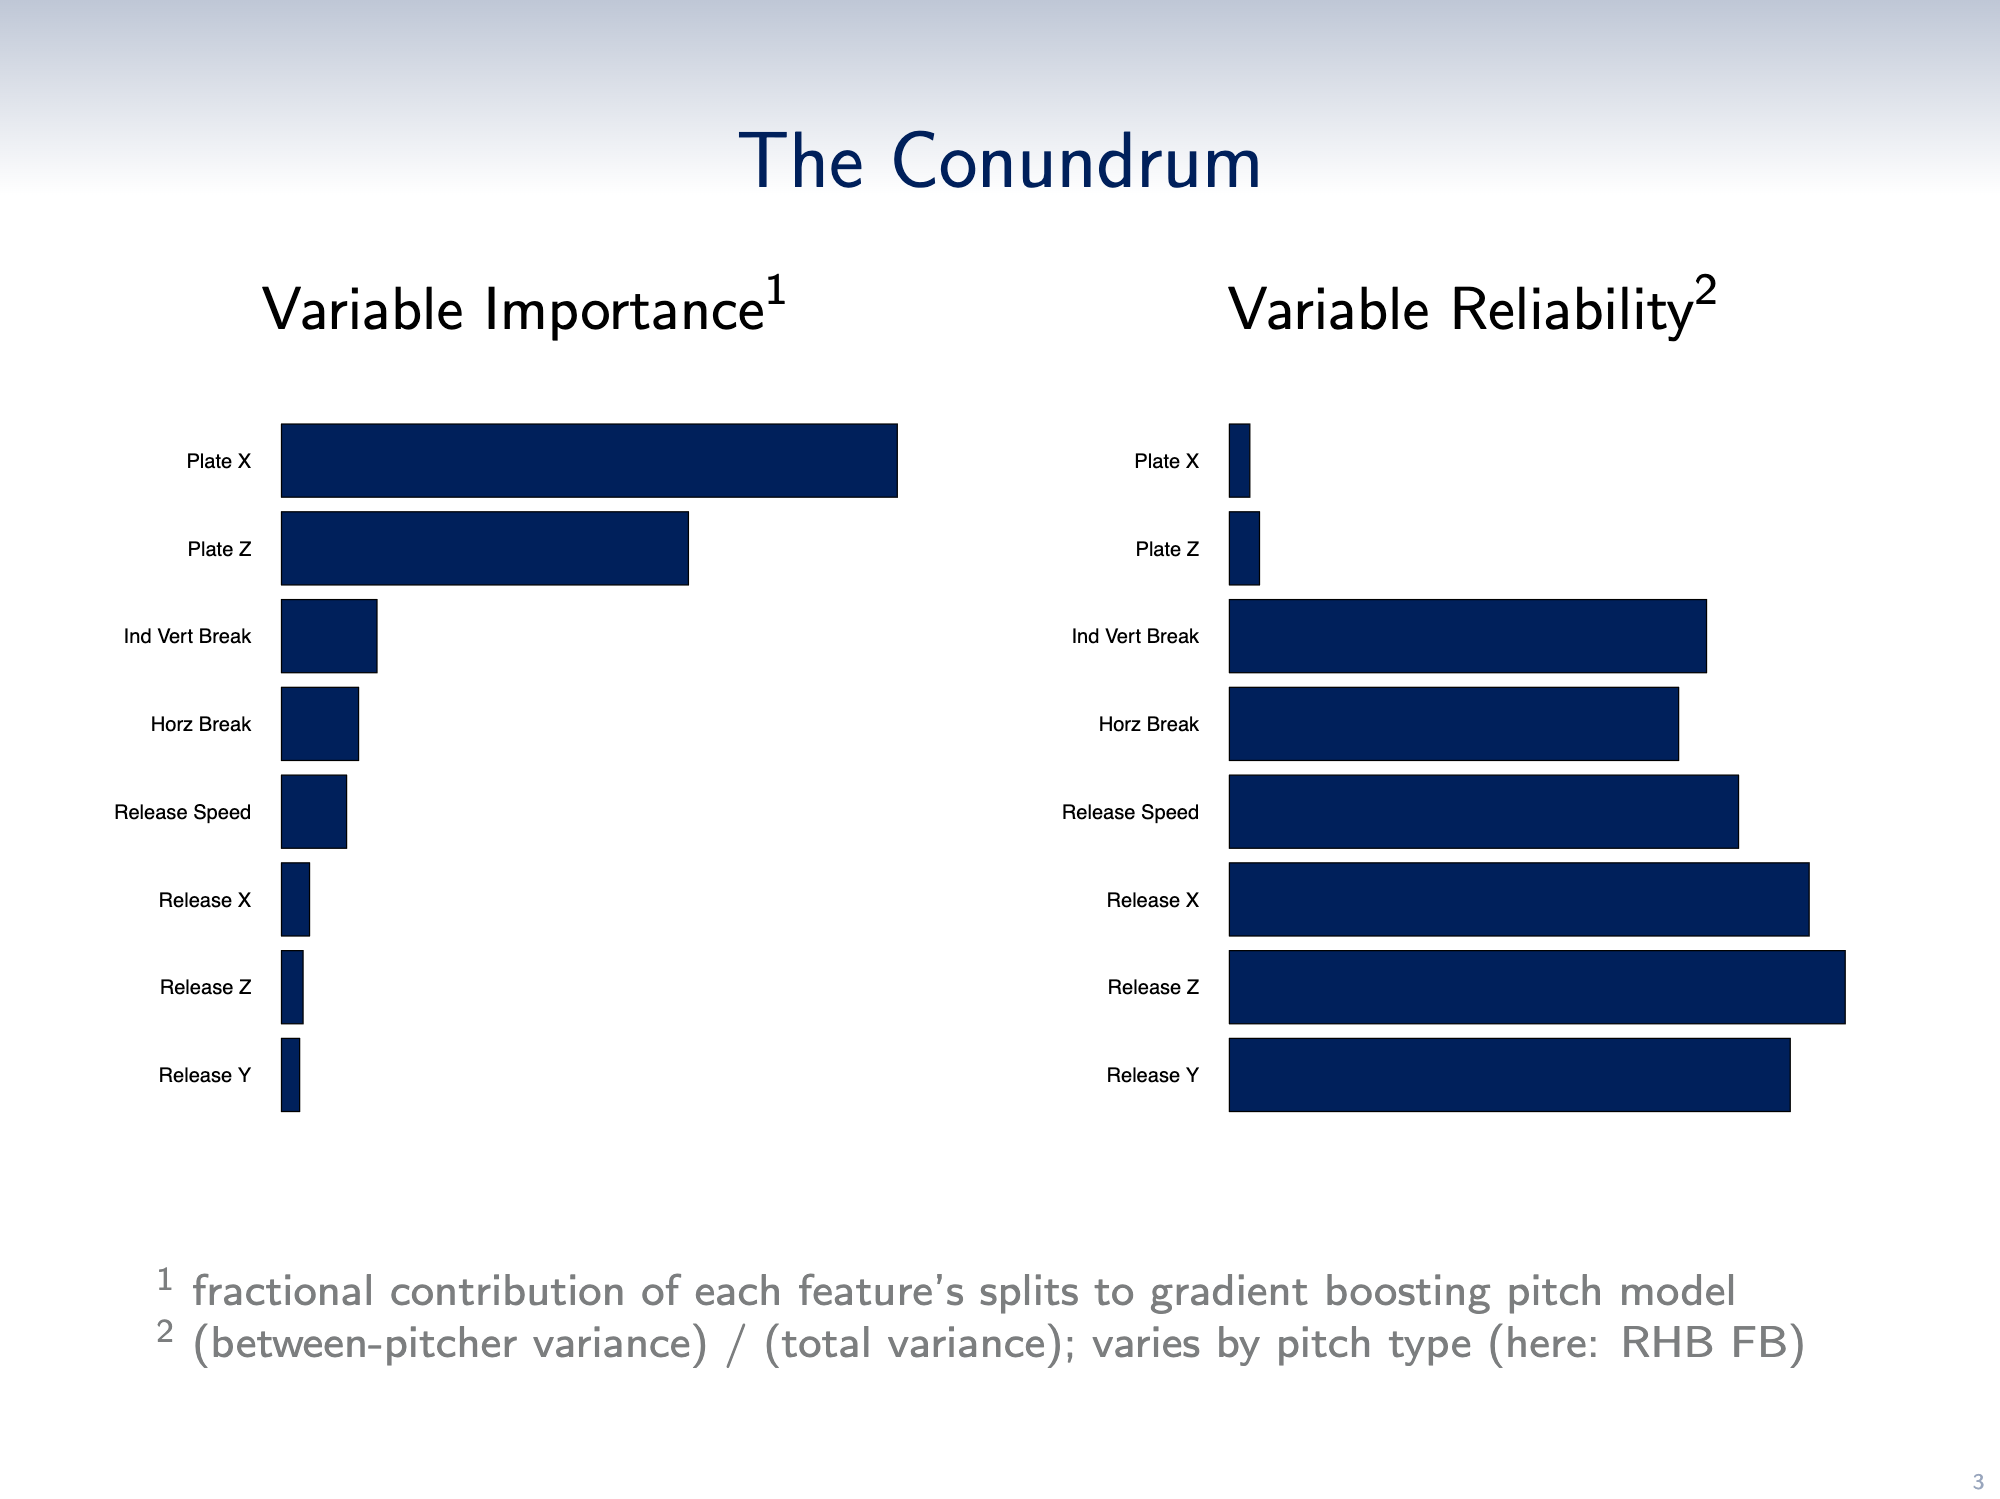
In the introduction to their 2023 Saberseminar presentation, Scott Powers and Vicente Iglesias hit on a fundamental truth about pitching: The variable that bests predicts the outcome of a pitch is the location where it crosses the plate. For a case study, look no further than this tweet from MLB.com’s David Adler about Yoshinobu Yamamoto’s splitters.
Hitters have swung 74 times at Yoshinobu Yamamoto's splitter this season …
38 of those swings are whiffs (51%)
Another 17 are foul balls
That leaves 19 balls in play
18 of those 19 are ground balls (95%)
Only 1 of Yamamoto's splitters has been hit in the air pic.twitter.com/ggLR1qHYZW
— David Adler (@_dadler) April 22, 2025
If Yamamoto buries his splitter arm side, he’s probably getting a whiff. If it’s on the edge of the zone, it’s likely a foul ball. If it catches plate, it’s getting put in play. The location dictates the outcome.
Given this truth, pitchers who command the ball best ought to dominate. But there’s a catch. As Powers and Iglesias noted, the location is also the variable with the least predictive reliability. If you see a pitcher throw a fastball 98 mph, you can be pretty sure he is going to do it again. A dotted backdoor slider, on the other hand, does not guarantee an entire game of dotted backdoor sliders. Command is both the most important and the least reliable quality for a pitcher.
Nobody can nail the corners with every pitch. But pitchers can at least minimize the variance of their locations, finding relative reliability within the chaos of command. And in 2025, there is perhaps nobody more reliable than Jacob deGrom.
deGrom’s flat attack angle fastball and firm slider have (justifiably) built his reputation as a stuff monster. Even after easing up on the gas pedal this season, deGrom is still a darling in the eyes of the models. His overall Stuff+ is in the 80th percentile for starters with at least 30 innings pitched, fueled by his depth-y 89-mph slider. PitchingBot likes deGrom even more, ranking him in the top 10 among those pitchers. Over at Baseball Prospectus, the StuffPro model believes deGrom wields four pitches — his curveball and changeup, in addition to the heater and slider — that all grade out as plus.
But stuff is no longer deGrom’s carrying tool. Possibly as a function of his decision to throw slower, possibly as a positive outcome of aging, deGrom’s standout skill these days is his command.
deGrom’s unbelievable precision came to my attention while writing about Hunter Gaddis for a piece that was published on Monday. As part of my effort to discern whether Gaddis owed his early-season success to slider command (the verdict: inconclusive), I created a version of the Kirby Index for sliders to see where he landed. That metric measured the variance in release angles and release points and distilled those figures into a single score that captured command ability. Originally, it was designed for fastballs, which tend to be thrown to all parts of the strike zone. It perhaps works even better for sliders, which generally are thrown to fewer targets. Gaddis’ rank among his fellow pitchers was nothing remarkable, but deGrom’s name sitting at the very top caught my attention.
| Player Name | VRA Pctl | HRA Pctl | Vert. Release Pctl | Horiz. Release Pctl | Kirby Index |
|---|---|---|---|---|---|
| Jacob deGrom | 99th | 97th | 91st | 79th | 0.94 |
| Merrill Kelly | 97th | 77th | 78th | 97th | 0.89 |
| Zac Gallen | 97th | 82nd | 92nd | 39th | 0.84 |
| Taijuan Walker | 90th | 66th | 92nd | 76th | 0.82 |
| Zack Littell | 87th | 96th | 88th | 17th | 0.80 |
| Jack Flaherty | 94th | 92nd | 3rd | 78th | 0.76 |
| Reese Olson | 93rd | 56th | 49th | 93rd | 0.76 |
| Scott Blewett | 73rd | 61st | 95th | 83rd | 0.75 |
| Corbin Burnes | 92nd | 90th | 3rd | 82nd | 0.75 |
| Bryce Elder | 81st | 99th | 59th | 28th | 0.75 |
As I wrote earlier this year, a more straightforward implementation of the Kirby Index would be to just measure the variance of the actual pitch locations. For this story, I calculated the standard deviation of the vertical and horizontal locations of a given pitcher’s sliders; once again, deGrom found himself at the top of the pack. Look at how much distance there is between him and the next closest pitcher:
| Player Name | Horizontal Location (St Dev) | Vertical Location (St Dev) | Overall (St Dev) |
|---|---|---|---|
| Jacob deGrom | 0.525 | 0.498 | 0.724 |
| Merrill Kelly | 0.595 | 0.586 | 0.835 |
| Zac Gallen | 0.616 | 0.565 | 0.836 |
| Corbin Burnes | 0.556 | 0.671 | 0.871 |
| Jack Flaherty | 0.575 | 0.659 | 0.874 |
| Bryce Elder | 0.514 | 0.713 | 0.879 |
| Zack Littell | 0.574 | 0.719 | 0.920 |
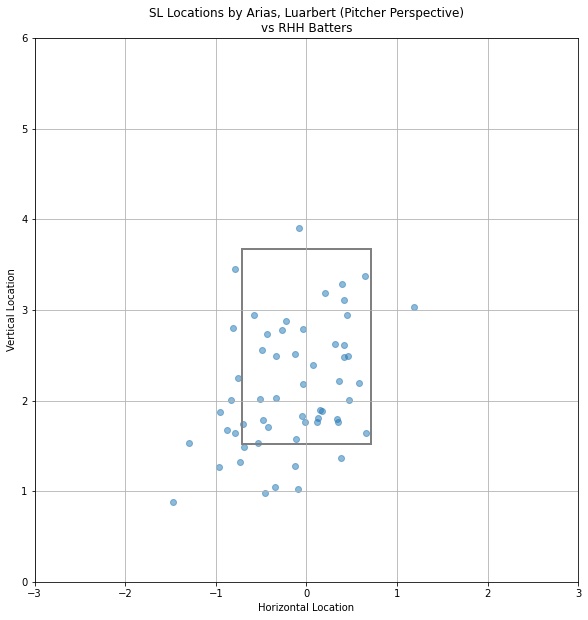
| Luarbert Arias | 0.543 | 0.755 | 0.930 |
| Enyel De Los Santos | 0.732 | 0.619 | 0.959 |
| Dylan Lee | 0.493 | 0.827 | 0.962 |
Random tangent here, but you have to admire Luarbert Arias for refusing to throw his junky 82-mph slider anywhere but inside the strike zone.
Anyway, measuring location densities, ultimately, could just point at pitchers who fill up the strike zone; the real test of command is a pitcher’s ability to hit his actual target. To that end, Driveline Baseball provided me with a sample of their proprietary miss distance data. Using Inside Edge tracking data, Driveline measures the distance from the intended target to the actual location of the pitch.
No surprise — deGrom’s slider miss distance ranked first among all pitchers. The league-average miss distance for sliders is about 12.5 inches; this year, deGrom is missing his target by under nine inches, nearly three standard deviations below the average. Any way you slice it, deGrom is commanding his slider like no one else in the sport.
The outcomes have been unassailable. So far, deGrom’s slider has returned a run value of -3.2 per 100 pitches thrown, the best mark for any slider thrown by a starting pitcher. Not only is he getting a bunch of swing and miss — a 38.1% whiff rate, as of this writing — it’s also grabbing a ton of called strikes. When batters do manage to put it in play, they can’t do much with it. The average launch angle on the pitch is just 2°; the xwOBA is a meek .227.
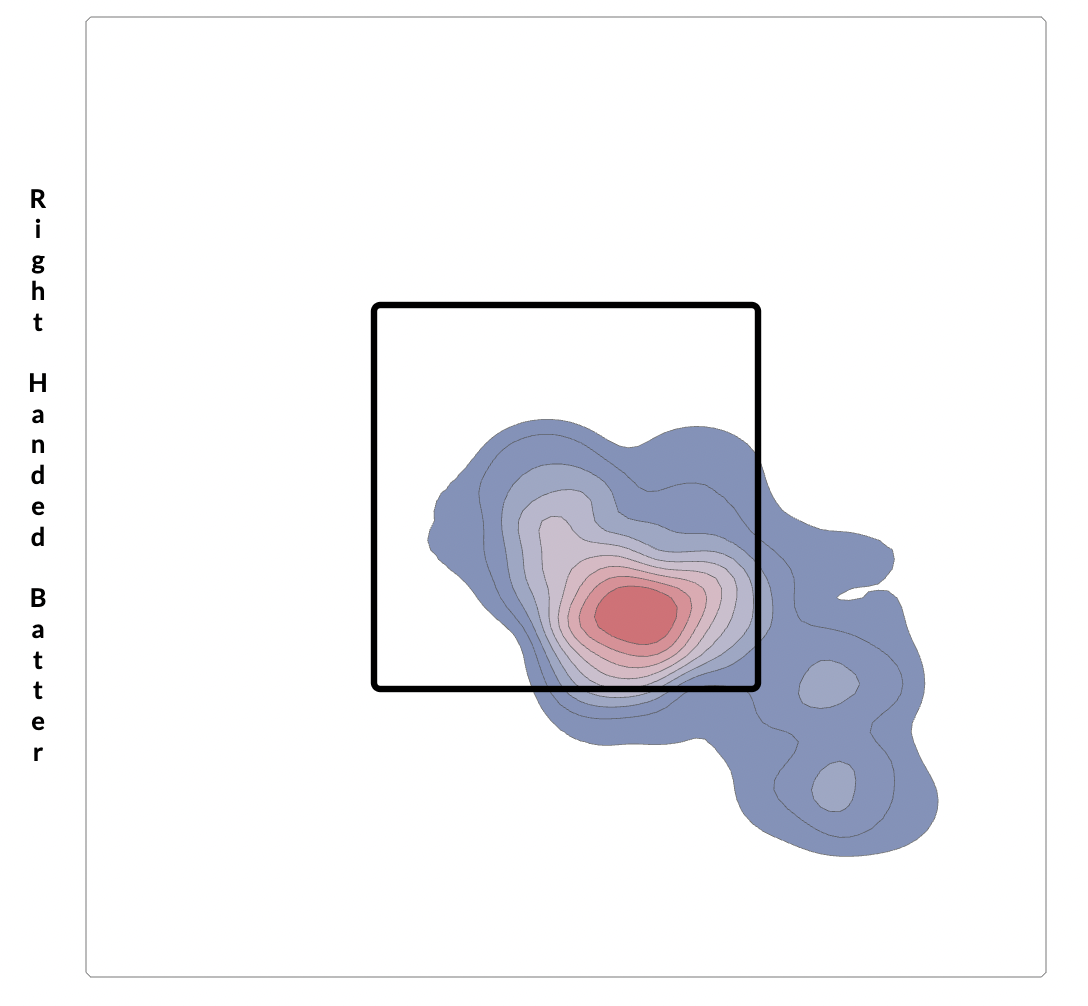
The harmless outcomes on balls in play are a function of deGrom’s targets. To right-handed hitters, he targets the classic low-away corner, breaking off the plate. Note the bimodal distribution on the heatmap — there’s a large concentration of sliders he’ll throw in the zone for strikes, and then another cluster right below the zone that generate chase.
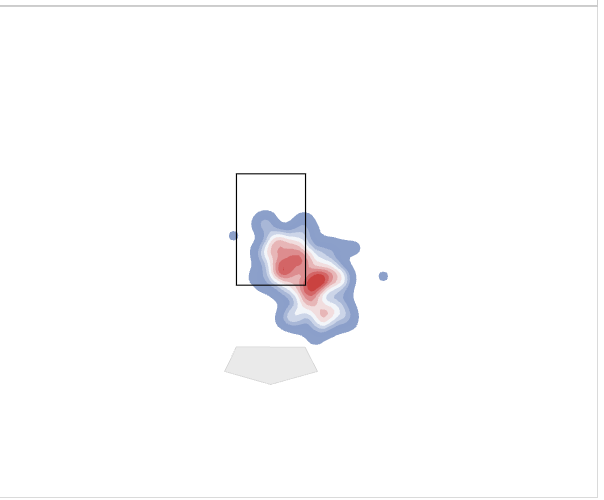
These intentions can be seen in the filtered heatmap clusters. When deGrom throws sliders to righties in zero-strike counts, he tends to be in the zone:
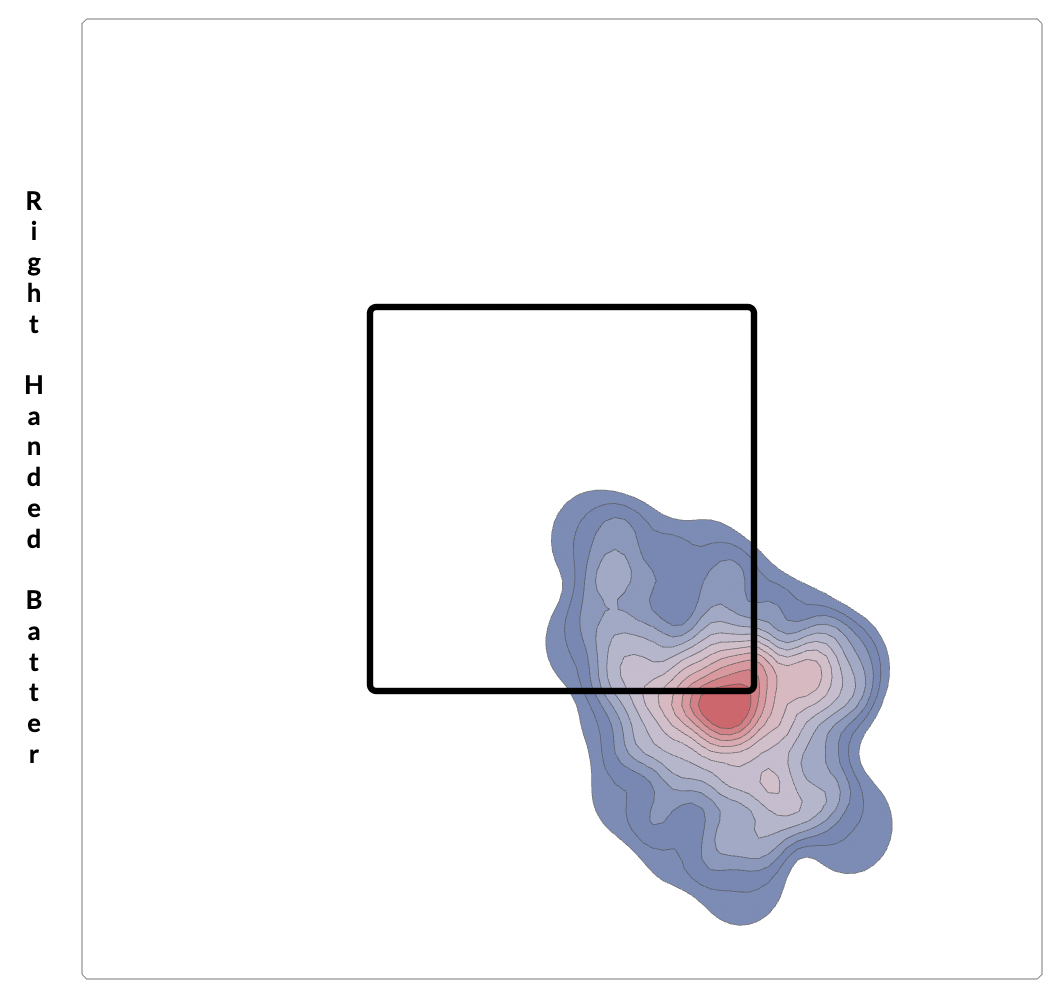
In two-strike counts, he chases the swing and miss:
To lefties, deGrom shows a similar bimodal distribution, but the pattern appears reversed. In early counts, he’s aiming just below the zone; in late counts, he’s looking for called strikes. This sequence to Athletics rookie Nick Kurtz, which featured four sliders, gives a sense of the approach. On 1-0 and 2-0, deGrom tries to bait a chase, but the big lefty resists.
Down 3-0, deGrom fires a middle-middle heater in an auto-take scenario, then returns to the slider in a 3-1 count. Here, deGrom dials in his robotic precision, dotting the lower edge of the strike zone to bring the count full.
On 3-2, he goes there again. Kurtz takes it and pays the price. Though the superimposed strike zone on the broadcast says this pitch is just low, my sense is he deserves that call; if he’s consistently landing pitches within inches of his intended target, you sort of just have to hand it to him.
deGrom isn’t just painting with the slider. I calculated the Kirby Index for four-seam fastballs thrown to righties in 2025; incredibly, he also sits in first place on that list.
| Player Name | VRA Pctl | HRA Pctl | Vert. Release Pctl | Horiz. Release Pctl | Kirby Index |
|---|---|---|---|---|---|
| Jacob deGrom | 92nd | 73rd | 96th | 94th | 0.88 |
| Bailey Ober | 91st | 99th | 56th | 72nd | 0.85 |
| Bryan King | 95th | 63rd | 89th | 81st | 0.83 |
| Spencer Schwellenbach | 90th | 95th | 44th | 88th | 0.83 |
| Trevor Williams | 99th | 56th | 57th | 92nd | 0.80 |
| Aaron Nola | 83rd | 91st | 59th | 68th | 0.79 |
| Joe Ross | 96th | 90th | 43rd | 50th | 0.79 |
| Ryan Gusto | 70th | 89th | 76th | 72nd | 0.77 |
| Colin Rea | 86th | 83rd | 60th | 52nd | 0.76 |
| Elvin Rodriguez | 76th | 78th | 79th | 55th | 0.74 |
| Kyle Freeland | 88th | 94th | 18th | 63rd | 0.74 |
| A.J. Puk | 90th | 54th | 51st | 91st | 0.74 |
As nice as it would be to think that deGrom can be just as good even after dropping two ticks off the fastball, it just isn’t true. Absent improvement elsewhere, losing stuff will bring him back to Earth. But deGrom is far from stagnant. In 2019 — his last full big league season, amid the most dominant phase of his career — his fastball command measured as below average by miss distance. Six years later, it’s hard to argue his command is anything but 80-grade. And as long as the elbow cooperates, it will help him defy gravity.
Michael Rosen is a transportation researcher and the author of pitchplots.substack.com. He can be found on Twitter at @bymichaelrosen.
Countdown to injury. 3:2;1
C’mon man, don’t rain on the parade. I know it’s tempting to do this for guys like him and Trout, but….
He’s intentionally throwing slower. Earlier in the year he was throwing slower than now, more like 96, but then he realized how much better his fastball performs at 97-98 so he has added a bit of velocity back. These are all conscious decisions, so I feel like at least for one year he’s a decent bet for a strong season w the TJ honeymoon phase.
Probably off the juice now
Competing with yourself for the worst comment?
I must have owned you in the past
Username checks out
Explain
It’s clearly sarcastic.
Plan on catching some perch with that bait?
What bridge do you live under?