Jimmy Nelson Has Reinvented Himself as a Bullpen Ace
Jimmy Nelson has had a rough few years, facing the most harrowing tribulation of a professional pitcher: persistent injuries. In 2015 and 2016, Nelson tossed 177.1 and 179.1 innings, respectively, with a cumulative ERA of 4.37 and 2.5 WAR. That WAR total over 356.2 innings put him on about a 1.56 WAR per 180 innings pace, about what we might expect from a back-end starter. Given how many innings he was able to shoulder, he was a valuable contributor. The following season, Nelson broke out. He added almost a tick to his fastball and increased the usage of his two breaking balls with great results. He posted a 3.49 ERA in 2017. His strikeout rate increased from 18.5% in his prior two seasons to 27.3% and he trimmed his walk rate by about 33% while maintaining an above average groundball rate of 50.3%. These improvements added up to an astounding 4.8 WAR in 175.1 innings, a massive leap that placed him eighth in baseball among starters.
But the end of the 2017 season marked the start of a string of injuries that kept Nelson off the mound for much of the past three seasons. The first came in September of his superlative 2017. Running the bases following a single against the Cubs, Nelson took a hard turn around first and was forced to dive back to the bag after inducing a throw from the defense. Upon extending his arm to the base, he tore the labrum and rotator cuff in his right arm, comprising his shoulder capsule and incurring nerve damage; the injury kept Nelson out for all of 2018. He returned to the Brewers on June 5, 2019, made four appearances (three of them starts) and suffered an elbow injury that forced him off the mound until September of that same year when he then made six more appearances. In just 22 innings of work, he had a less-than-stellar 6.95 ERA and walked over 16% of the batters he faced. Milwaukee did not tender him a contract that offseason.
The Dodgers signed Nelson that winter, with the intent of rehabilitating someone who was among the most effective pitchers in the majors. But Nelson suffered a back injury in spring training prior to the COVID-19 shutdown, forcing him to have surgery on his back. That injury, according to Nelson himself, was the result of “mechanical compensations that developed over time going back from the shoulder.” He missed all of 2020 but the Dodgers brought him back on a minor-league contract, hoping he could rediscover some of his prior form and fortify a bullpen that lost its second, fifth, and ninth most-used arms, including Jake McGee, who was the team’s most valuable reliever by WAR.
While the Dodgers bullpen has struggled relative to past performances through the first three months of the 2021 season, placing just 13th in WAR among all major league bullpens, Nelson has smashed any reasonable expectations for someone who had thrown just 22 innings over the prior three years. He has arguably been the most valuable piece in the Los Angeles bullpen and certainly has been the best on a per inning basis. He leads Dodgers relievers in WAR while having thrown more than 25% fewer innings than the second and third place pitchers, Kenley Jansen and Blake Treinen.
The method by which he generates outs has changed dramatically with his shift to a relief role; after consistently posting above-average groundball rates throughout his time as a Brewer, his groundball rate is down to 36.6% this season. More importantly, however, in 2021 Nelson has struck out 40.9% of all batters he has faced and trimmed his walk rate down to 12.5% following his disastrous 2019 stint. Nelson’s K-BB% of 28.4% ranks 12th among all relievers with at least 20 innings pitched, sandwiched between more established bullpen stalwarts James Karinchak and Aroldis Chapman. Stacked up against this same crop of relievers, Nelson’s ERA- stands 57th out of 204, just outside the top quartile. Strip out balls in play variance and his 37 FIP- is the fourth lowest in the group, a ridiculous figure indicating Nelson has been 63% better than the league average pitcher at suppressing runs.
In Nelson’s first healthy season since 2017, he has become a bullpen monster. Given the change in role, one might expect a change in approach, and indeed, he has made a substantial change in his arsenal in his first season pitching in Chavez Ravine.
| Season | CH | FF | KC | SI | SL |
|---|---|---|---|---|---|
| 2017 | 2.7 | 29.3 | 19.5 | 32.0 | 16.5 |
| 2019 | 0.7 | 23.8 | 20.1 | 28.3 | 27.0 |
| 2021 | 0.0 | 35.1 | 34.7 | 0.0 | 30.2 |
You can see the impetus for the decrease in groundballs: Nelson has totally turfed his sinker. This development is surprising given that Dodgers relievers have led all bullpens from 2019-21 in sinker usage. I would say this is evidence that smart organizations do not impose pitch philosophies on their pitchers but allow those players to play to their strengths. If you employ the likes of Scott Alexander, Adam Kolarek, Treinen, Dylan Floro, Victor Gonzalez, and Brusdar Graterol, your bullpen is going to lean on the sinker. But Nelson’s sinker was always his weakest pitch in terms of whiff rate and wOBA against going back to his days in Milwaukee. Nixing it as part of his bevy of offerings made sense.
Nelson’s changeup was always a show-me pitch and he has also eliminated it. Now he is a three-pitch pitcher who uses each of those pitches interchangeably: the four-seam fastball, a knuckle curveball, and a slider. Because he uses the three pitches an almost equal share of the time, breaking balls now make up a shade under two thirds of his total offerings. In the context of the rest of the league, Nelson’s breaking balls have high-end physical characteristics and results this season:
| Player | Pitch Type | Velo (mph) | H Move (in) | V Move (in) | Spin Rate (rpm) | Swing% | Zone% | Strike% | SwStr% |
|---|---|---|---|---|---|---|---|---|---|
| Jimmy Nelson | CU | 85.2 | 10.6 | -14.1 | 2939 | 36.5 | 40.5 | 51.8 | 18.2 |
| Rest of MLB | CU | 79.8 | 9.4 | -10.1 | 2576 | 39.8 | 42.7 | 51.6 | 12.8 |
| Jimmy Nelson | FF | 93.9 | -2.7 | 17.3 | 2627 | 38.0 | 48.0 | 53.8 | 10.0 |
| Rest of MLB | FF | 94.0 | -7.2 | 16.3 | 2314 | 47.8 | 54.5 | 58.7 | 10.9 |
| Jimmy Nelson | SL | 86.6 | 13.5 | -1.6 | 3025 | 53.5 | 46.5 | 63.5 | 23.3 |
| Rest of MLB | SL | 84.9 | 6.1 | 1.8 | 2471 | 48.1 | 44.7 | 56.2 | 16.8 |
The curveball gets about four more inches of downward break compared to other right-handers across the majors despite Nelson throwing it 5.4 mph faster. This is a product of Nelson spinning the curveball with 363 more rpm. Despite throwing the curveball less often than average in the strike zone and inducing fewer swings, Nelson’s curve generates almost 50% more swings-and-misses than the average right-handed curveball, thus boasting a strike rate about league average. Besides its spin rate, his fastball is fairly ordinary in terms of physical characteristics and struggles to pick up strikes due to the lack of swings from opposing batters, which is a product of him throwing it in the strike zone about 11% less than the league.
The pitch that really stands out here is Nelson’s slider. It has been a devastating weapon for him as he has mowed down batters this season. He spins the slider with an absurd 3025 rpm, which creates almost double the horizontal movement of the average slider and an extra two inches of drop. The pitch’s unusual shape gives Nelson confidence in throwing it in the zone, which helps encourage batters to swing through it. He picks up strikes with the slider at a slightly greater rate than the league’s and generates a swing and miss close to a quarter of the time. You can boil down Nelson’s success to his ability to force batters to swing and miss with both his slider and curveball.
Though Nelson’s pitch mix looks egalitarian on its face, when you split it up by handedness you see him follow a typical pattern in how he attacks hitters in each batter’s box.
| Batter Stands | FF | KC | SL |
|---|---|---|---|
| L | 35.4 | 50.7 | 13.9 |
| R | 34.9 | 19.3 | 45.9 |
His fastball usage is consistent but his use of each breaking ball changes by a factor of two in each case. Sliders have platoon splits slanted in favor of the pitcher using them against batters with the same handedness, while curveballs have relatively neutral splits. This is the product of sliders relying more on horizontal movement to miss bats, which is sensitive to where the batter stands. Curveballs leverage vertical movement in search of whiffs and whiffs induced via vertical movement are not dependent on where the batter is set up but rather on the vertical angle of attack of the hitter’s barrel as it traverses the strike zone. In either case, one of Nelson’s breaking balls is always his preferred option when attacking a hitter. In the case of the slider against righties and the curveball against lefties, Nelson throws a decent portion of them below the bottom of the strike zone. However, given the slider and curveball’s elite physical profiles, he is not afraid to attack hitters in the zone in search of swinging strikes.

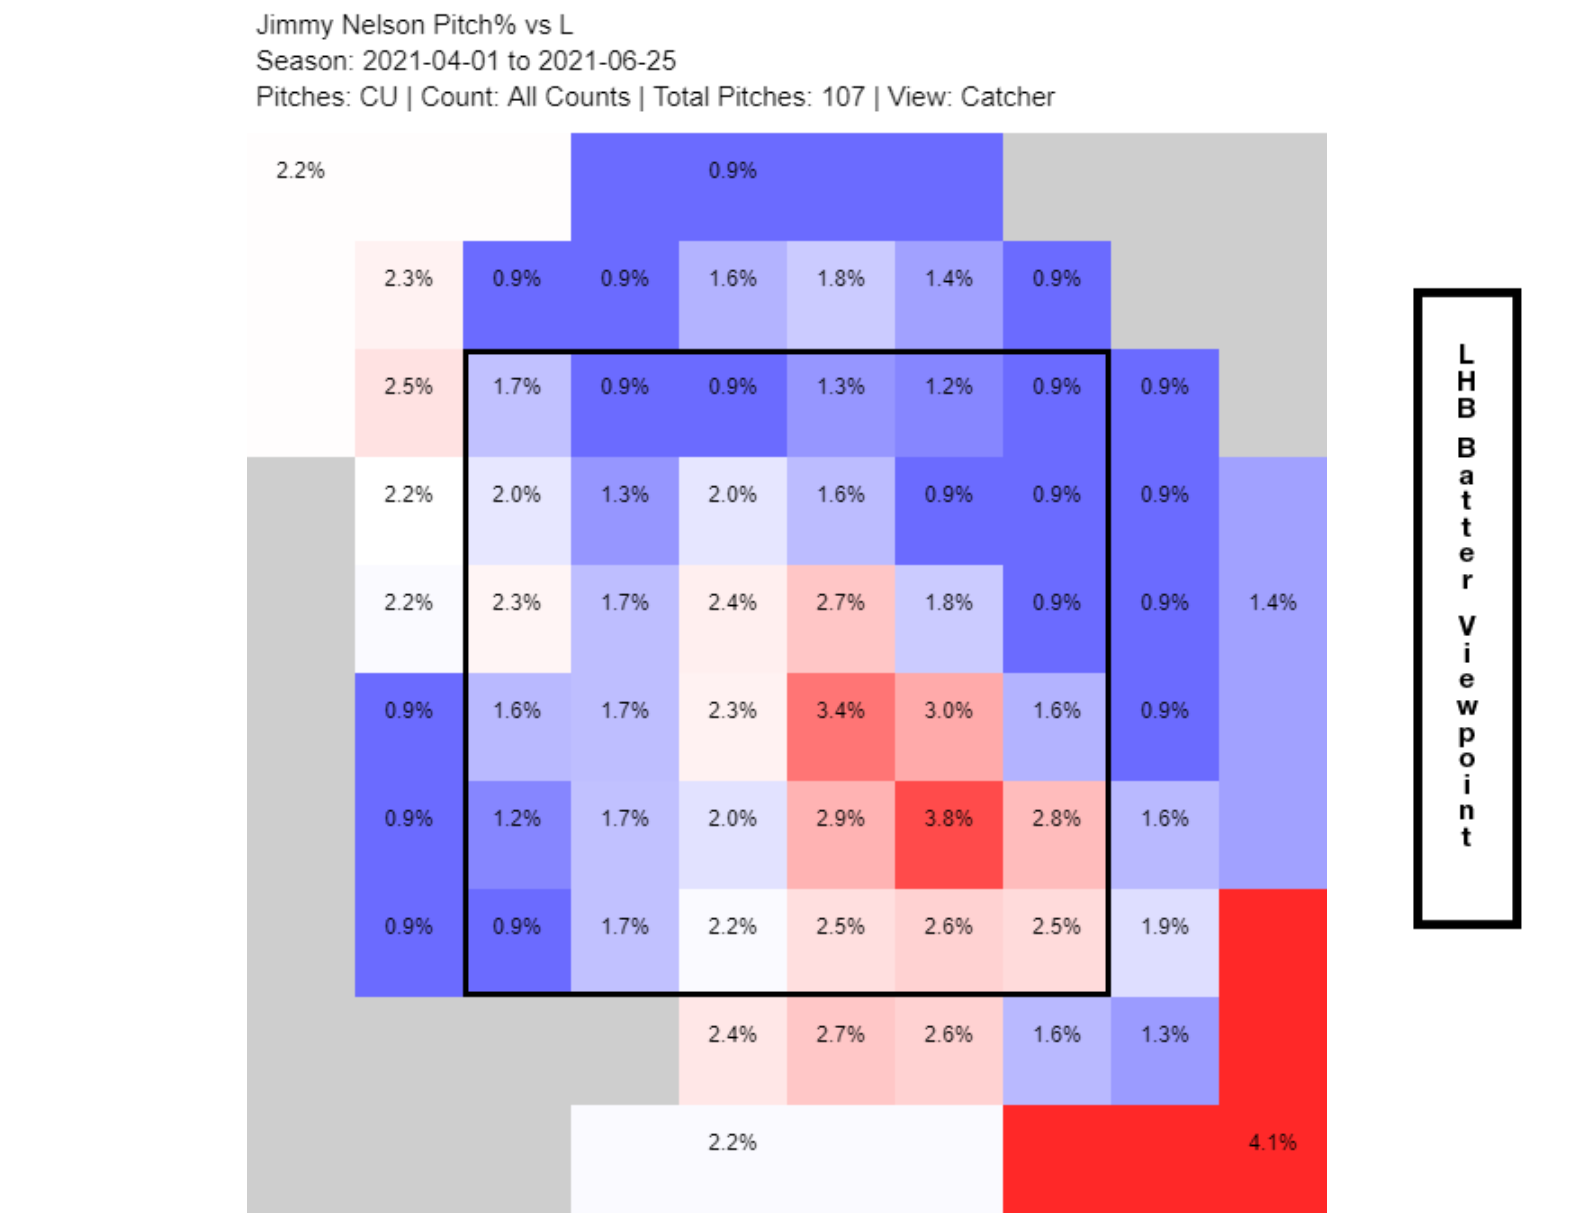
He is clearly making an effort to bury the slider down and away against righties and the curveball down and in to lefties. But he also throws a good deal of those pitches in the lower part of the zone and the strategy has yielded success:
| Location | Pitch% | SwStr% |
|---|---|---|
| Low in Zone | 12.0 | 25.0 |
| Low out of Zone | 34.0 | 44.1 |
| Middle of Zone | 19.0 | 15.8 |
| Up in Zone | 17.0 | 23.5 |
| Up out of Zone | 18.0 | 16.7 |
| Location | Pitch% | SwStr% |
|---|---|---|
| Low in Zone | 20.8 | 36.4 |
| Low out of Zone | 34.9 | 27.0 |
| Middle of Zone | 13.2 | 0.0 |
| Up in Zone | 7.5 | 0.0 |
| Up out of Zone | 23.6 | 0.0 |
Nelson varies his slider location more against right-handed opposition and has found success locating the pitch in the upper third of the zone. But he makes hay when locating the pitch either in the bottom of the zone or below, generating a massive 44.1% swinging strike rate. He is more careful locating the curveball against lefties, with the majority of those pitches at or below the bottom of the zone and for good reason. He induces a ton of whiffs on those pitches versus all other locations, where he has yet to get a swinging strike.
Because both pitches have been successful, it should not be shocking that he has performed well against players of either handedness:
| Player | Batter Stands | Swing% | Zone% | Chase% | SwStr% | Strike% | wOBA |
|---|---|---|---|---|---|---|---|
| Jimmy Nelson | L | 38.8 | 45.5 | 24.6 | 12.0 | 54.3 | .252 |
| Jimmy Nelson | R | 45.4 | 44.5 | 29.0 | 21.6 | 57.6 | .189 |
| Rest of MLB | L | 46.8 | 48.9 | 26.6 | 11.9 | 55.4 | .323 |
| Rest of MLB | R | 47.6 | 49.1 | 28.9 | 13.0 | 57.1 | .311 |
He has been a bit better against right-handed hitters, which is normal, but his curveball has still allowed him to be very effective when facing a platoon disadvantage. He is getting strikes in either split but he is getting righties to chase and swing and miss much more often. The relative lack of swinging strikes against lefties can be attributed to lefties spitting on pitches much more than league average. Nevertheless, he still has posted a sterling .252 wOBA against lefties.
Nelson’s journey to the 2021 season was difficult, to say the least. After eating a ton of innings for the Brewers, major injuries derailed what was once a very promising career as a starting pitcher. Despite the injuries, the Dodgers were willing to take a flier on Nelson and his talent and so far he has delivered on the club’s optimism. While Nelson will most likely never be a 180 inning workhorse again, he has the elite stuff and mental toughness to continue to be a bullpen weapon for the Dodgers as they look to repeat as World Series Champions.
Carmen is a part-time contributor to FanGraphs. An engineer by education and trade, he spends too much of his free time thinking about baseball.
The Dodgers are just now starting to ramp up the leverage situations that they use Nelson. Should be interesting to see if he keeps it up in higher leverage in the coming months and what his playoff impact will be.