
José Ramírez Isn’t That Far Off
After putting up an MVP-type performance in 2018, José Ramírez has not been a good baseball player this season. It’s not like last season came out of nowhere either. In 2016, Ramírez broke out with a five-win campaign and followed that up with a 6.5-WAR season in 2017. That the Cleveland third baseman would take another step forward last year as a 25 years old was not unexpected. What has been unexpected is the fall Ramírez has taken in 2019. With nearly half the season gone, Ramírez has been a replacement-level player with a 68 wRC+ and a near-complete evaporation of the power that led to 68 homers leaving the yard over the previous two years. Ramírez has been terrible, but he might not actually be that far off from being good again.
Early in the year, Devan Fink noted that Ramírez actually started slumping in the last few months of the 2018 season, and theorized that perhaps Ramírez was trying too hard to beat the shift.
Why would Ramírez start trying to hit the ball the other way, especially if that’s not what works for him? One answer could be that he began trying too hard to beat the shift. Ramírez is a switch-hitter, and he was shifted at a drastically different rate when he batted right-handed (6.3% of the time) versus left-handed (53.0% of the time). If Ramírez was truly getting in his head and trying too hard to beat the shift, then we’d expect to see his pull percentage drop even further for when he hit lefty versus when he hit righty. And that’s exactly what happened. While Ramírez did see his pull-rate drop by not-insignificant 9.2 points as a right-handed hitter from prior to the slump to during it, his pull-rate dropped by 19.2 points (!) as a lefty.
Nearly halfway through this season, Ramírez’s pull rate as a lefty is now pretty close to where it has been the past few seasons. That doesn’t mean that Fink was wrong about what was going on, as Ramírez could have made an adjustment to start pulling the ball again. If Ramírez has made an adjustment, it clearly isn’t working. On twitter, Mike Petriello advanced the following argument.
I'm not saying this is "the" thing, but it's definitely "a" thing pic.twitter.com/BGGaCtKzrF
— Mike Petriello (@mike_petriello) May 28, 2019
There’s got to be something to the increased launch angle causing more poorly hit balls. Petriello started a new thread here discussing weaker contact, and Mike Podhorzer discussed the weaker fly ball contact over at RotoGraphs. A year ago, Ramírez hit 67 balls with a launch angle of at least 40 degrees as a lefty, essentially automatic outs. This season, he’s already hit 41 such batted balls. That can’t really be all of the issue though. Much of Ramírez’s increase in launch angle has happened on the right side of the plate, and he’s actually performed reasonably close to last season as a right-hander. The switch-hitter’s average launch angle from the left side has only moved from 19.4 degrees to 21.0 degrees. That’s not nothing, but it’s also not causing a 100-point drop in wRC+ over the last year when hitting against right-handed pitching, either.
While my theory might not turn out any better than the two above, I’ll go ahead and posit that Ramírez has some newfound plate discipline issues. When a batter is walking 11% of the time and striking out just 13% of the time, it is hard to argue there’s something seriously wrong with his strike zone judgment. While that is likely true, it also represents a bit of a change from prior seasons. Ramírez’s O-Swing% is up five percentage points to 26.3% on the season, causing a 6.2% whiff rate, an increase from 4.7% a year ago. Because his walk rate was a high 15.2% last year, the drop to 11.3% this year represents a 25% fall from a year ago. His strikeouts are up 1.8 percentage points from last year, and that represents a 16% jump over last season. That still doesn’t really explain why Ramírez just isn’t hitting though.
Ramírez has a very unique plate discipline profile. When I looked at Yoan Moncada’s swings when ahead and behind in the count, Ramírez’s numbers stuck out enough that I included him in the graph below:
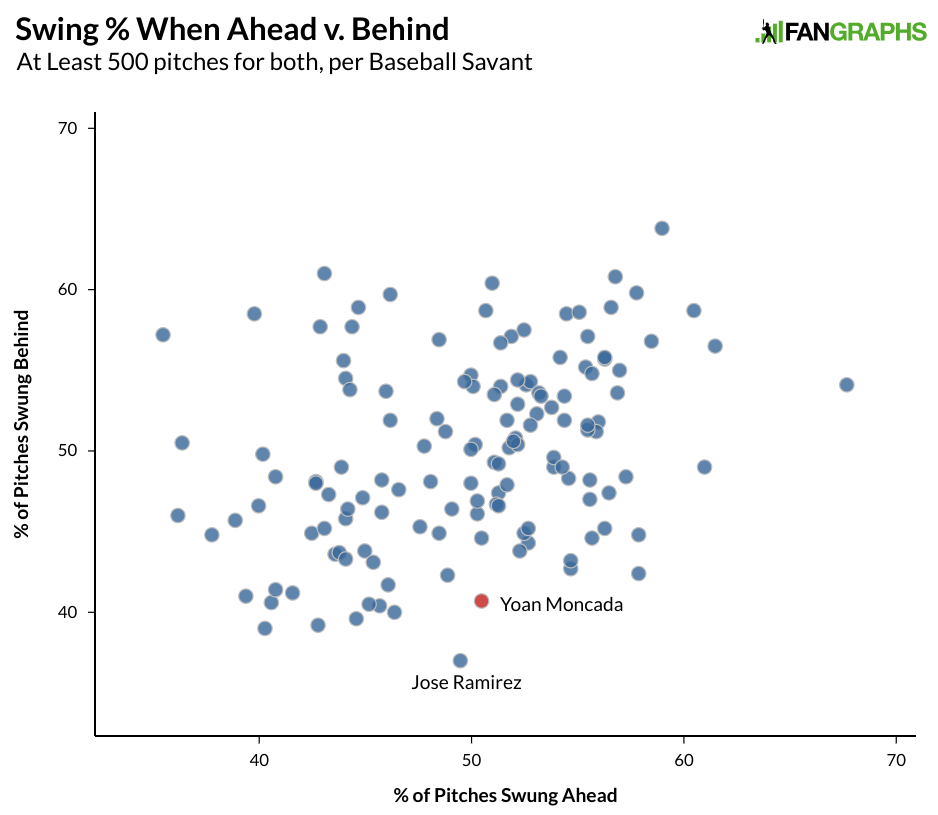
A year ago, when Ramírez was behind in the count, he swung at just 37% of pitches. Pitchers tend to throw breaking and offspeed pitches out of the zone when they get ahead and Ramírez resisted the temptation to swing. Here’s how Ramírez’s swing percentages have changed since last depending on the count:
| Ahead | Behind | Even | |
|---|---|---|---|
| 2018 | 49.5% | 37.0% | 30.3% |
| 2019 | 50.0% | 46.6% | 35.1% |
| Change | 0.5% | 9.6% | 4.8% |
When Ramírez has been ahead in the count, he’s swung at roughly the same number of pitches he did a year ago, but when he’s been behind, he’s swinging a lot more often. The numbers are roughly the same when we isolate only his left-handed plate appearances. As a result, there has been a drop in the number of pitches he has seen when ahead in the count and a sizable drop in the number of plate appearance that end with Ramírez having the count advantage:
| Ahead | Behind | Even | |
|---|---|---|---|
| 2018 | 48.9% | 22.0% | 29.1% |
| 2019 | 37.8% | 30.5% | 31.7% |
| Change | -11.1% | 8.5% | 2.6% |
The 49% number posted by Ramírez when ahead is huge given that league average is just 33% this year. The numbers are slightly more pronounced if we focus on just left-handed plate appearances. That change matters because batters hit like Anthony Rendon (161 wRC+) when ahead in the count, Freddy Galvis (96 wRC+) when even in the count, and like Juan Lagares (39 wRC+) when behind. This is true for Ramírez as well:
| Ahead | Behind | Even | |
|---|---|---|---|
| 2018 | .480 | .249 | .350 |
| 2019 | .384 | .205 | .235 |
While Ramírez’s numbers are still down this season in all categories, if we took his numbers last season by category and shifted the plate appearance numbers to this season, it would account for a 32 point drop in wOBA from a season ago, which is more than a quarter of his drop in production. As for the rest, would you believe a large portion is just luck? A year ago, Ramírez posted a .366 xwOBA based on launch angle and exit velocity, but a .392 wOBA in terms of his actual results. It’s possible that some good fortune simply inflated Ramírez’s numbers a bit. This season, Ramírez’s xwOBA is .329, but his actual wOBA is another 50 points lower. A forty point drop is still a drop, but it isn’t quite the 110-point free fall we’ve seen so far this year. Here’s Ramírez’s xwOBA numbers by count:
| xwOBA | Ahead | Behind | Even |
|---|---|---|---|
| 2018 | 0.447 | 0.242 | 0.324 |
| 2019 | 0.427 | 0.245 | 0.292 |
Perhaps here we can see the effect of shifting the number of plate appearances ahead to behind. There’s only a 20-point drop when ahead, virtually even when behind, and a 32-point drop in an even count. If we were to average the three, we’d see a 16-point drop, but the drop in xwOBA is more than double that because the frequency of plate appearances when ahead dropped by so much. If we put the 2019 xwOBA numbers with the PA frequency numbers from 2018, we’d end up with a .348 xwOBA, right in the same range as Paul DeJong, Tommy La Stella, Manny Machado, and Nolan Arenado. Of course, Ramírez isn’t doing that. Compare Ramírez’s swings as a lefty when behind in the count below:
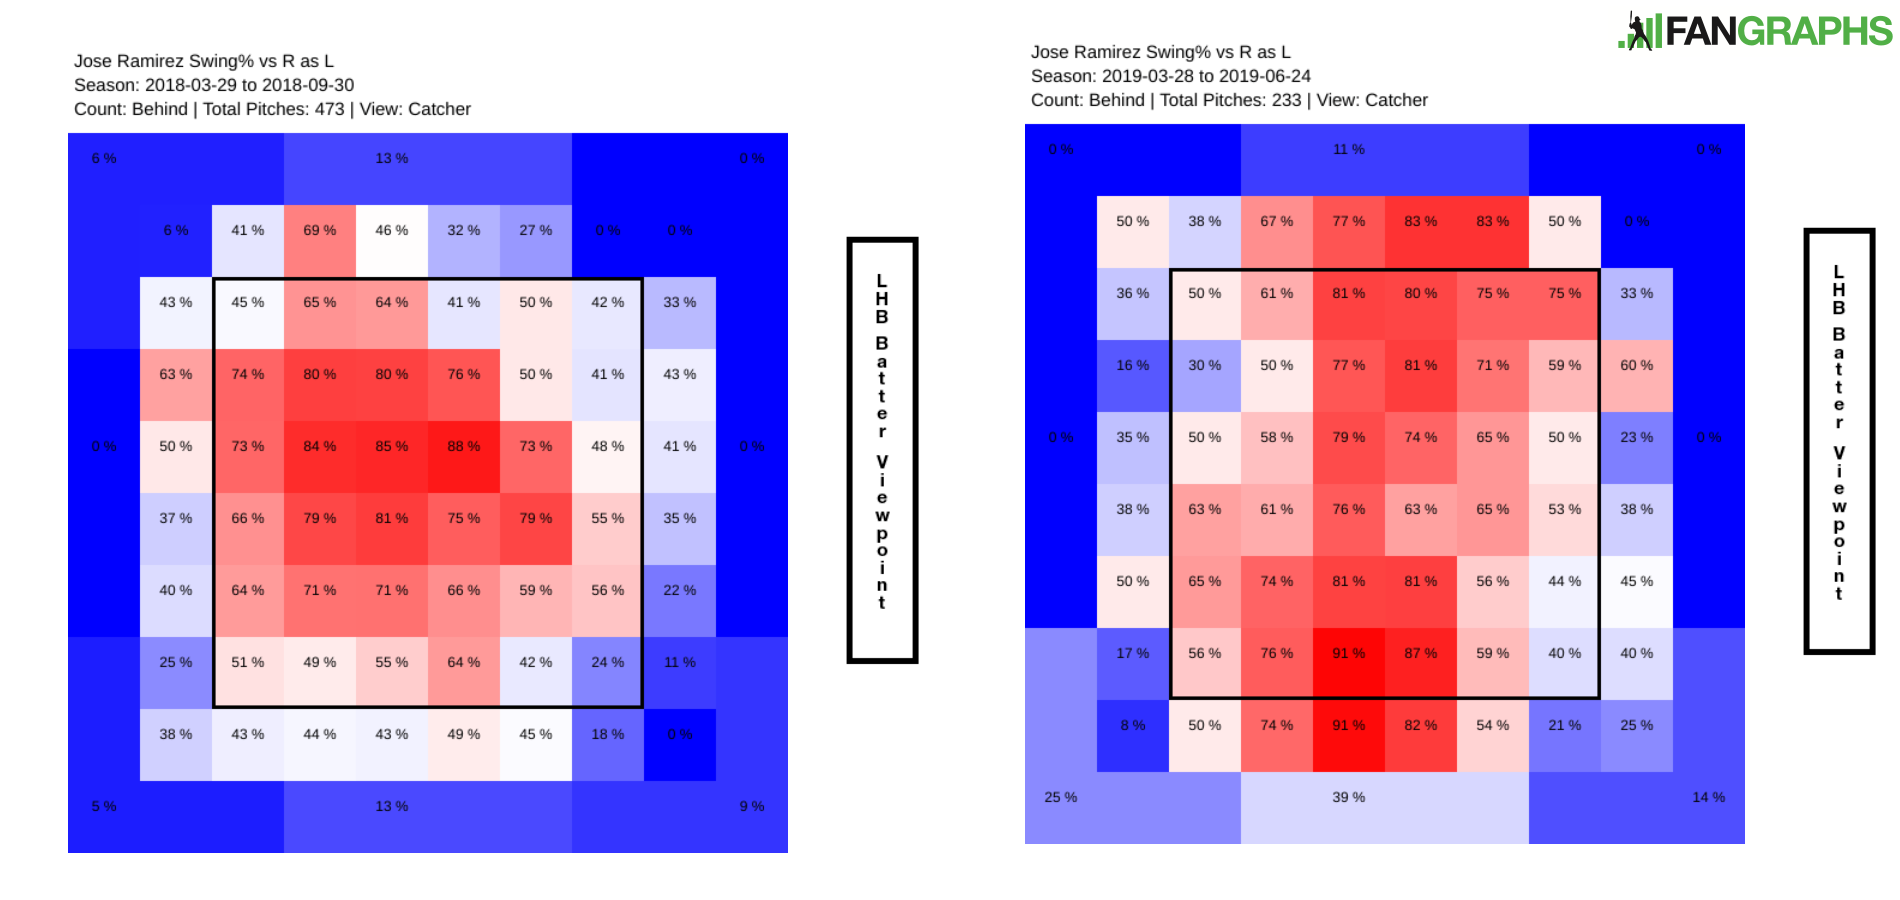
Note how he swings at the heart of the plate in 2018, but has greatly expanded this season. Worse, he also seems to be making contact on the pitches he can do the least damage with:
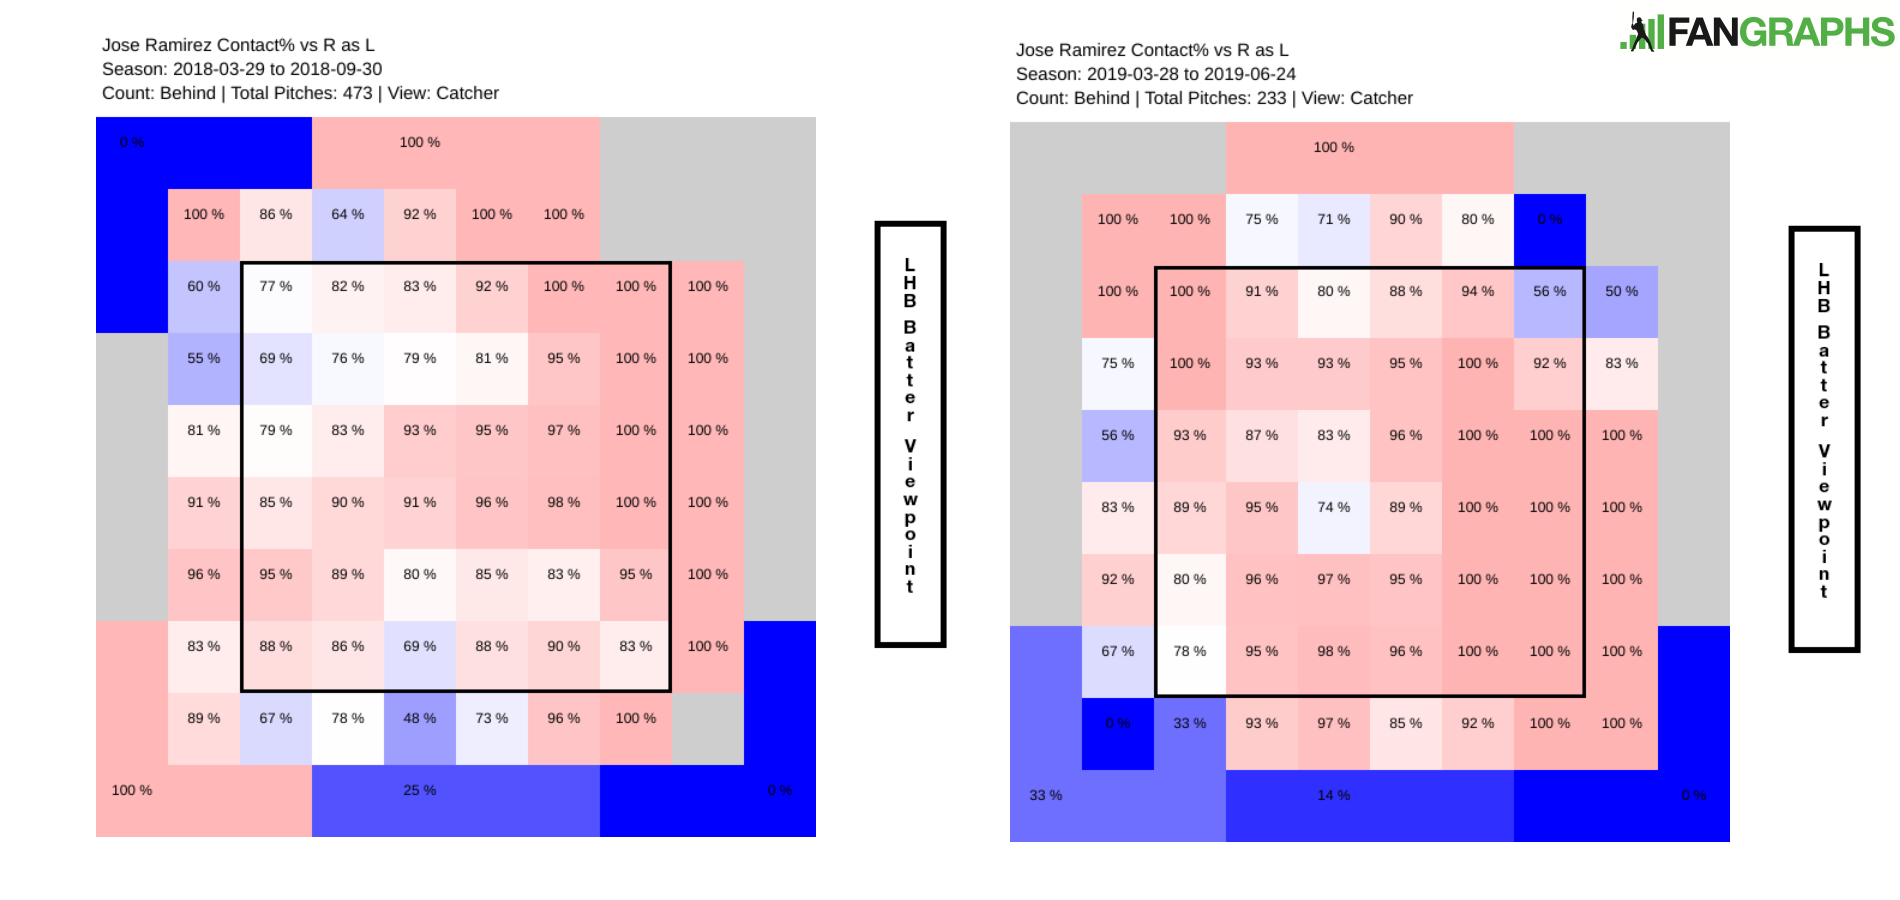
Even when he’s ahead, we can see an expanded approach unlike what Ramírez was employing last season:
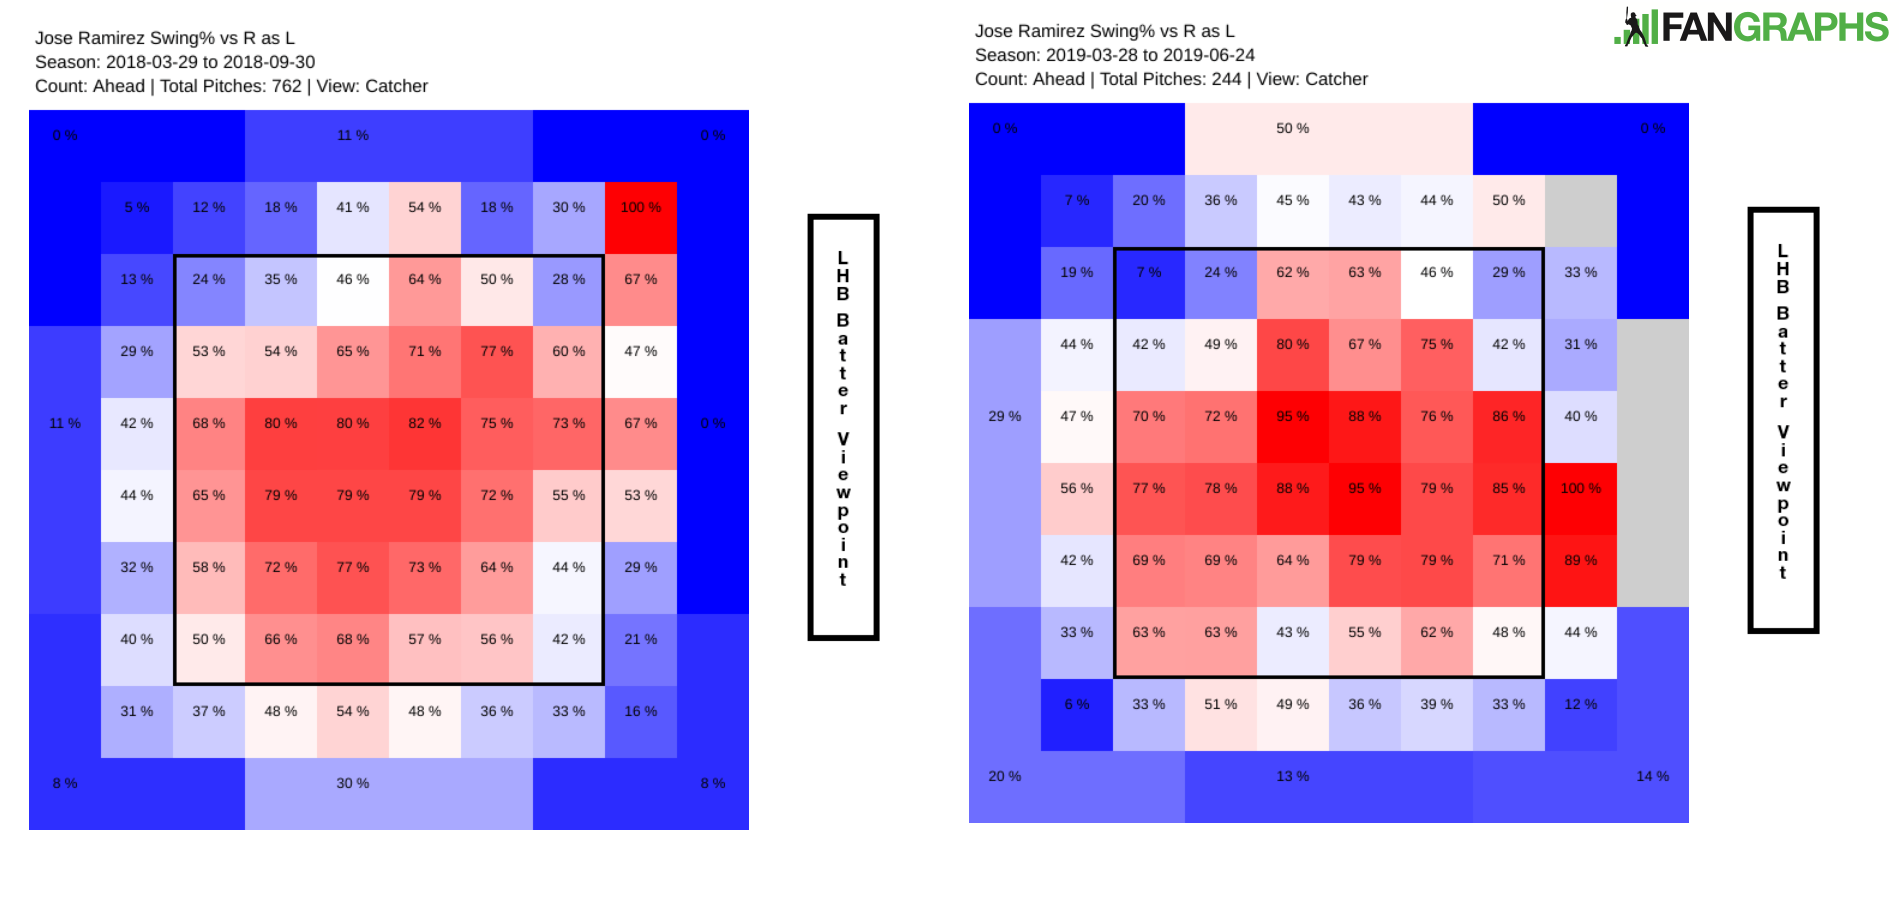
He’s swinging at more pitches down-and-in and low-and-away. Ramírez simply isn’t commanding the strike zone like he used to, and it is showing up in increased swings on breaking and offspeed pitches out of the zone. Ramírez needs to be able to hunt for those fastballs in the plate, and to do so, he has to be able to avoid the breaking stuff. He hasn’t done a poor job of that relative to other players, but part of what made Ramírez a very good hitter was getting in favorable counts and taking advantage. The league might have caught up to him a little bit, but the problem appears to be more on Ramírez’s end and swinging at pitches he didn’t used to. That also means the issue could be fixable. Bad luck has certainly played some role in Ramírez’s big drop, as it might not be as bad as it appears, and if Ramírez can control the plate like he has in seasons past, he just might turn things around.
Craig Edwards can be found on twitter @craigjedwards.
{Ron Washington voice]: “He’s incredibly far off.”
Huh. You and Jeff Zimmerman might want to have a chat.
This headline should be: History Say Yes.
Haha, NN is on fire!
I think the main problem with Ramirez is his loss of home run power. Last year his HR/FB was 16.9%, this year it’s a quarter of that at 4.2%. If Jose Ramirez had the exact same season he has had so far except with last year’s HR/FB%, he would have a slash line of .269/.353/.542, as compared to last year’s numbers of .270/.387/.552. Plate discipline might be playing some role, and changing his approach could definitely be affecting his power, but at the end of the day the main difference is that Jose Ramirez is not hitting as many home runs this year. If he fixes that (and yes, that’s a big if) then he will be fine.
Tony Blengino wrote a really good anaylsis of Jose’s struggles on Forbes in late April. One thing he noted was:
“Last season, he went 37 for 109 with 33 homers on 90-105 MPH fly balls. This year, he’s 1 for 17 with a double.”
That’s such an extreme change I have a hard time wrapping my mind around it.
I wonder what the median MPH was in each of those data sets. Seems like 90MPH to 95MPH is typically a flyout, while over 100MPH has a decent chance to get over the fence.
In the following paragraph he states:
“He’s averaging career-bests of 93.3 MPH on fly balls and 96.8 MPH on liners, but there’s quite a bit of warning track power in that misleading fly ball number.”
So I’m not sure about median but the mean was a career best when the article was written. At the same time, the sentence is a bit unclear. What exactly is “misleading” about the fly ball number? And why is there warning track power this year, but not the year before when he had a lower mean MPH on fly balls?
Yeah, there’s gotta be something funky about the way the FBs are distributed in that range. I don’t know how to get that data, though.
If strike zone judgement is part of the problem, then maybe he’s started to figure something out. During his last 12 games he’s hit .304/.377/.522. And he’s only struck out once during that time. Yep, one K in his last 53 PAs. And he’s only had a .289 BABIP during that time, so those numbers are in no way BABIP-inflated.
This is a noob question, but is it possible to run that heat-swing chart using different data referenced points? I’d be curious to know if his swing chart during the time emh1969 references looks more similar to his 2018 chart with a more concentrated zone.
It is possible. Let me pull them up.
Swing% while behind in the count as a lefty (last twelve games): https://www.fangraphs.com/zonegrid.aspx?playerid=13510&position=3B&ss=2019-06-12&se=2019-06-24&type=2&hand=aL&count=behind&blur=1&grid=10&view=bat&pitch=&season=all&data=
Contact% while behind in the count as a lefty (last twelve games): https://www.fangraphs.com/zonegrid.aspx?playerid=13510&position=3B&ss=2019-06-12&se=2019-06-24&type=3&hand=aL&count=behind&blur=1&grid=10&view=bat&pitch=&season=all&data= [Note: this one is basically useless]
Swing% while ahead in the count as a lefty (last twelve games): https://www.fangraphs.com/zonegrid.aspx?playerid=13510&position=3B&ss=2019-06-12&se=2019-06-24&type=2&hand=aL&count=ahead&blur=1&grid=10&view=bat&pitch=&season=all&data=
In short, the answer is “not really”.
Thank you for creating them. I was hoping for better results. He’s too important to the team that’s still in the playoff race to take an extended break to regroup. Maybe he’ll be able to use the All-Star break to do a system reboot and have a Dozier-like 2nd half…at least that’s the optimistic hope.
I think some of the swing% stats you mentioned are caused more by the fact that pitchers are less afraid of him and know that he can’t hit the four seamer. The problem is (or possibly was) mechanical.
I have no intelligent commentary about why Jose Ramirez, specifically, is struggling. But at a more general level, my suspicion is that anyone who goes from a wRC+ of 146 to one of 68 probably has had at least two things go wrong, probably more like 3-5. It is such a comical, hilarious drop in production that I don’t believe this is the only thing wrong with him.
That said, I think Craig has put forth a pretty strong argument for one of the (probably many) reasons he is struggling.
I think what makes it hard to explain is how quickly he fell off a cliff. On August 17th last year, he was hitting .303/..414/.640. Since then he’s hit .200/.307/.313.
He basically went from being one of the ten best hitters in baseball to one of the 10 worst. Immediately. There was no gradual dropoff. Whether it’s a single factor, or a combination of factors, it’s hard to understand how someone could change so quickly and so radically.
I think it’s equally puzzling how he went from being a total slap hitter in the minors to having elite power.
True but at least it was a gradual build, going from 11 to 29 to 39 homeruns. I don’t think that sort of build is unprecedented. At least he wasn’t Jose Bautista who went from 13 homeruns to 54 homeruns in the course of one season.
Good stuff.
This is similar to (though nowhere near the caliber of player) as the Braves Johan Camargo.
Camargo had his breakout season last year with ATL, but now used in a super-utility role, his numbers have fallen off a cliff.
There’s nothing that definitively stands out in explaining why his numbers are far worse (in terms of the more ‘obvious’ metrics). It’s like he’s just worse at literally everything. Some drop offs are easy to explain and some aren’t. I hadn’t looked at Camargo’s swing heat map. Maybe, like Ramirez, he’s also not commanding the zone as good as he did in 2018, which could explain why the cause for his regression isn’t as easy to put a finger on.
Thanks for the breakdown!
Ramirez was a rare example of a guy whose game power exceeded his raw — something like 60 game, 50 raw — for 2017 and 2018. His exit velo and hard hit % were right around league average, but because his contact skills were elite, he was able to pull balls at an ideal launch angle to an incredibly effective degree. This year, his contact skills are merely very good and his HR/FB has plummeted. Perhaps he could benefit from reducing launch angle and returning to a gap power approach instead of selling out for home runs, like he did back in 2016.
I’d be interested in seeing how he’s being pitched while behind in the count. My hypothesis is that he’s been getting a lot less fastballs in 2019 when behind in the count (this seems to have become the book on him). I would imagine that’s partly the cause of why he’s swinging at a lot more pitches when behind in the count; he hasn’t figured out how to lay off the breaking ball.