Just How Hot Has Cody Bellinger Been?
By now, most baseball fans are probably aware of Cody Bellinger’s start to the 2019 season. Through 31 games and 132 plate appearances, Bellinger has put up an almost-immortal .431/.508/.890 slash line, with a 256 wRC+, swatting 14 home runs, drawing 19 walks and striking out just 15 times.
He’s leading baseball in batting average, on-base percentage, slugging percentage, wOBA, wRC+, home runs, RBI, and runs scored. (He’s even stolen five bases so far this year, good for 15th.) As the calendar has now officially turned, Bellinger has tied the record for most home runs before May 1, and has set the record for most RBI before May 1.
Now, this season, baseball’s March 28 Opening Day was the earliest that it has been in history, giving Bellinger (and, Christian Yelich, who also tied the home run record) a few more games than their historical counterparts to set these marks. And, as we know, more games equals more opportunities to pad one’s numbers, especially counting stats like home runs and RBIs.
(Warning: I’m about to talk some about RBI. I also know that RBI isn’t an especially illuminating stat. I am writing about this for historical sake, so just bear with me.)
Consider this: Bellinger set his RBI record on April 29, his 30th game of the season. Mark McGwire and Juan Gonzalez — who previously shared the RBI-prior-to-May-1 record with 36, each doing so in 1998 — had only played 25 and 24 games, respectively, upon reaching that pinnacle.
Just how hot has Cody Bellinger been? We probably have some idea as to the answer, but let’s go ahead and put his first 30 games in true historical perspective to be absolutely certain.
For one, according to Evan Boyd of Stat by STATS, Bellinger’s 1.413 OPS through 30 player games was the highest since Barry Bonds (1.540) in 2004, and the fifth-highest mark through 30 games in the live ball era, going back to 1920. Secondly, according to the Elias Sports Bureau, Bellinger’s Triple Crown stats (.434 average, 14 HR, 37 RBIs) were the highest of any player in major league history after 30 games.
What’s more, Bellinger has produced 3.0 WAR in just 31 games. If that sounds like a lot, that’s because it is. In fact, since 2002, Bellinger’s April 2019 WAR is the fourth-highest of any player in any given month:
| Player | Year | Month | WAR |
|---|---|---|---|
| Lance Berkman | 2008 | May | 3.12 |
| Randy Winn | 2005 | Sep/Oct | 3.02 |
| Barry Bonds | 2002 | Aug | 3.00 |
| Cody Bellinger | 2019 | Mar/Apr | 2.95 |
| Barry Bonds | 2004 | Mar/Apr | 2.83 |
Want further proof? Just look at Bellinger’s odds to win the National League MVP award. On March 1, Vegas had him at 25-to-1, trying him for the 11th-best odds in the league. But, as of April 29, he’s already an 8-to-5 favorite.
I want to go deeper, though. It’s obviously important to how we perceive Bellinger’s performance that he is putting up these numbers to start a season. If he put up a 30-game stretch like this in, say, mid-July, we might not pay as much attention to it. It’s only because we, as humans, see his season wRC+ of 259 and react in shock. But, even when looking at the best individual months by any hitter since 2010, Bellinger’s April ranks very highly.
| Player | Year | Month | AVG | OBP | SLG | wOBA | wRC+ |
|---|---|---|---|---|---|---|---|
| Matt Kemp | 2012 | Mar/Apr | .417 | .490 | .893 | .566 | 269 |
| Edwin Encarnacion | 2015 | Aug | .407 | .460 | .919 | .555 | 263 |
| Bryce Harper | 2015 | May | .360 | .495 | .884 | .556 | 262 |
| Mike Trout | 2015 | Jul | .367 | .462 | .861 | .544 | 260 |
| Cody Bellinger | 2019 | Mar/Apr | .434 | .508 | .906 | .559 | 259 |
| Mike Napoli | 2011 | Sep/Oct | .429 | .518 | .843 | .562 | 258 |
| David Ortiz | 2011 | Aug | .411 | .494 | .836 | .553 | 253 |
| Josh Hamilton | 2010 | Jun | .454 | .482 | .815 | .553 | 248 |
| Jose Bautista | 2011 | Mar/Apr | .366 | .532 | .780 | .541 | 248 |
| Mike Trout | 2014 | Jun | .361 | .471 | .759 | .515 | 245 |
Perhaps the most interesting thing about the above chart is that Bellinger’s April isn’t the only April there. Assuming an equal chance that any hitter puts up a phenomenal month at any point during the season, we’d expect to see just 1.67 March/Aprils on a monthly chart of 10 hitters. Instead, there are three; Matt Kemp (2012) and Jose Bautista (2011) join Bellinger as the hitters who put up elite months in the game’s first month. If this tiny sample serves as more good news for Bellinger, both Kemp and Bautista went on to have solid years (though Kemp’s was injury-shortened).
| Player | Year | PA | AVG | OBP | SLG | wOBA | wRC+ | WAR |
|---|---|---|---|---|---|---|---|---|
| Jose Bautista | 2011 | 655 | .302 | .447 | .608 | .443 | 181 | 8.1 |
| Matt Kemp | 2012 | 449 | .303 | .367 | .538 | .383 | 145 | 3.8 |
Bautista actually had a phenomenal year after his hot start, finishing third in the majors in WAR behind Jacoby Ellsbury (9.5) and, funnily enough, Matt Kemp (8.3). The next year was the year of Kemp’s blistering start, and he scuttled to the finish line, hitting just .273/.333/.445 in 351 plate appearances from May 1 on.
As I said above, this is a tiny sample of just two hitters. On a greater scale, a hitter’s wRC+ in their first month correlates moderately strongly to their full season wRC+. For simplicity’s sake, to demonstrate this concept, I took a quick glance at 2018 hitters, comparing their April wRC+ to their full season wRC+.
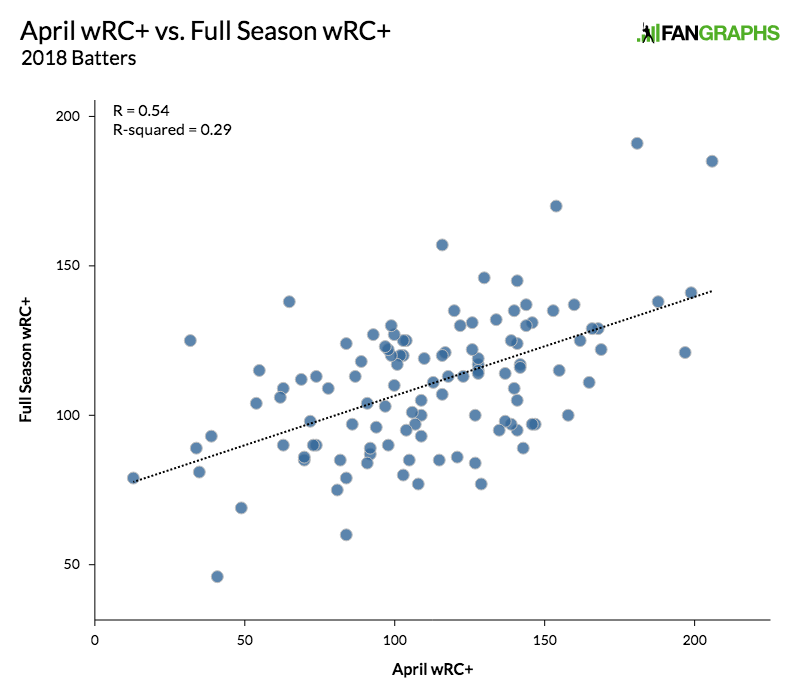
Matt Kemp clearly provides a great lesson. Bellinger’s scorching April does not necessarily mean he’s going to go on to hit like Barry Bonds for the rest of the season; the above chart has an R-squared value of 0.29, though, if we use our LSRL to attempt to predict Bellinger’s full season wRC+ based on his first month, we would expect his full season wRC+ to end around 159. Of course, even though there’s still a lot of variability here, that mark would rank as the fifth-best wRC+ in baseball in 2018.
Does that mean it’s wrong to marvel at Bellinger’s hot start? Absolutely not. Baseball history is something that we should all appreciate, including Bellinger’s extraordinary performance so far. After all, he was worth 3.0 WAR in April, and even with the slight differences in the number of games it has been possible to play in other seasons prior to May, that’s just mind-boggling. Since our monthly WAR splits began in 1974, no hitter has produced three wins in April. That is, until Cody Bellinger.
Devan Fink is a Contributor at FanGraphs. You can follow him on Twitter @DevanFink.
Wait wait wait wait wait.
Randy…Winn?
Winn had a nutty batting month and also was 2 runs above average in CF with the larger positional adjustment.
Imagine if Bellinger had played CF this year instead of the Pollock signing.
Specifically Winn had a 1.331 OPS while playing CF in San Francisco.
27 extra-base hits in 30 games!