Justin Verlander Earned That No-Hitter
Entering Sunday’s games, 30 pitchers since 1908 had thrown multiple no-hitters. The list is an impressive one, including names like Warren Spahn, Max Scherzer, Walter Johnson, and Randy Johnson. There are also some less exciting names on the list with Homer Bailey, Mike Fiers, and Jake Arrieta all accomplishing the same feat in recent seasons. Of those 30 players with at least two no-hitters since 1908, 27 of the 30 had thrown exactly two such games, including Justin Verlander. After a 14-strikeout, one-walk no-hitter on Sunday, Verlander joins Bob Feller, Cy Young, and Larry Corcoran in all of baseball history three no-hitters, sitting behind only Sandy Koufax (4) and Nolan Ryan (7).
All no-hitters are impressive, as navigating an entire game without allowing a hit is a feat unto itself and generally comes with an excellent defensive performance combined with a great outing from the pitcher. Verlander’s no-hitter is one of the most impressive in recent history due to how little he relied on his teammates to complete the task. Only seven times before has a pitcher put up more than Verlander’s 14 strikeouts in a no-hitter. Scherzer put up 17 in his October 2015 no-hitter and Ryan did the same back in 1973. Ryan also struck out 16 and 15 in other no-hitters, with Clayton Kershaw getting 15 Ks in 2014 while Warren Spahn and Don Wilson also reached 15 strikeouts in their performances. Verlander’s 14 matches four others including Ryan, Koufax, Matt Cain, and Nap Rucker back in 1908. Cain, Koufax, and Rucker did not walk any batters, and the only other pitchers with at least 14 strikeouts and one walk or none were Scherzer and Kershaw.
Some no-hitters are marked by great defensive plays. This was not one of those games. There were only two hard-hit balls all game long by the Blue Jays, and both were ground balls. The first was a pulled grounder from Vladimir Guerrero Jr. that came off the bat at 98 mph.
According to Statcast, batted balls with that exit velocity and launch angle are hits 55% of the time. Vlad hit his ball right at a fielder and the play was made.
Billy McKinney also pulled a hard grounder, this one to the first-base side.
This one came off the bat at 103 mph, and based on exit velocity and launch angle, it is a hit 60% of the time. No other batted ball had an expected hit percentage above 12% against Verlander on Sunday. There were some infield files and pop fouls and mostly routine plays. To get a sense of how rare Verlander’s performance was, I multiplied the expected out rate for each batted ball and found that based on exit velocity and launch angle, Verlander’s chances of throwing a no-hitter were about one in eight. That might not seem absurdly high, but compared to recent no-hitters, the odds were strongly stacked in Verlander’s favor. Here are Verlander’s and the other five no-hitters since the start of the 2018 season.
| Pitcher | Date | % Chance of No Hits by xBA | Odds of No-Hitter |
|---|---|---|---|
| Justin Verlander | 9/1/2019 | 12.11% | 8 to 1 |
| HOU Combined | 8/3/2019 | 0.07% | 1350 to 1 |
| LAA Combined | 7/12/2019 | 0.02% | 4650 to 1 |
| Mike Fiers | 5/7/2019 | 0.52% | 192 to 1 |
| James Paxton | 5/28/2018 | 0.02% | 4004 to 1 |
| Sean Manaea | 4/21/2018 | 0.41% | 245 to 1 |
Verlander’s odds were more than 20 times better than the next closest no-hitter. Generally, around 21% of batted balls will have an expected batting average greater than .600, but Verlander had zero in his no-hitter on Sunday. To provide a little bit more context, I looked at the one-hitters and two-hitters this season to provide some comparison. Verlander’s odds still look far and away the best.
| Pitcher | Date | Hits | % Chance of No Hits by xBA | Odds of No-Hitter |
|---|---|---|---|---|
| Justin Verlander | 9/1/2019 | 0 | 12.11% | 8 to 1 |
| Mike Fiers | 5/7/2019 | 0 | 0.52% | 192 to 1 |
| Justin Verlander | 8/21/2019 | 2 | 0.13% | 762 to 1 |
| Shane Bieber | 7/24/2019 | 1 | 1.43% | 70 to 1 |
| Masahiro Tanaka | 6/17/2019 | 2 | 0.02% | 5076 to 1 |
| German Márquez | 4/14/2019 | 1 | 0.15% | 665 to 1 |
| Yusei Kikuchi | 8/18/2019 | 2 | 0.01% | 11767 to 1 |
| Sandy Alcantara | 5/19/2019 | 2 | 0.22% | 462 to 1 |
| Mike Leake | 7/19/2019 | 1 | 0.01% | 7759 to 1 |
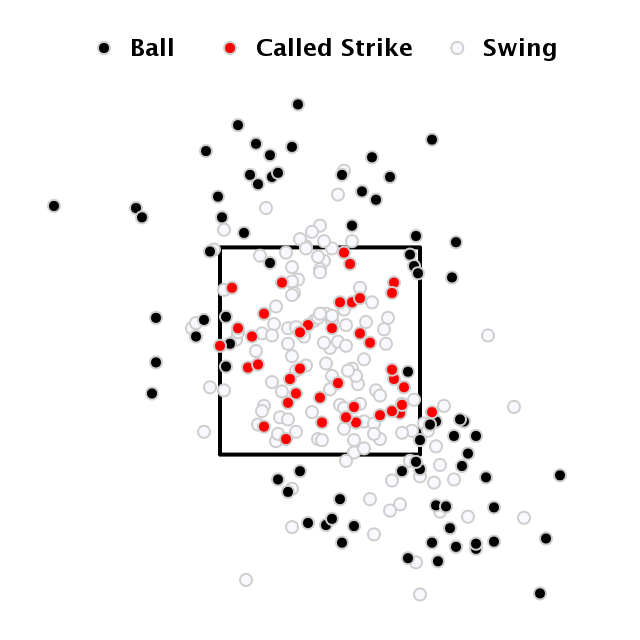
Sometimes pitchers can get a little help from umpires, but the game as a whole was called very well.
Verlander went heavy with his fastball all game long. Of his 120 pitches, 78 were fastballs, and he continued to challenge hitters up in the zone as the heatmap from the game shows.
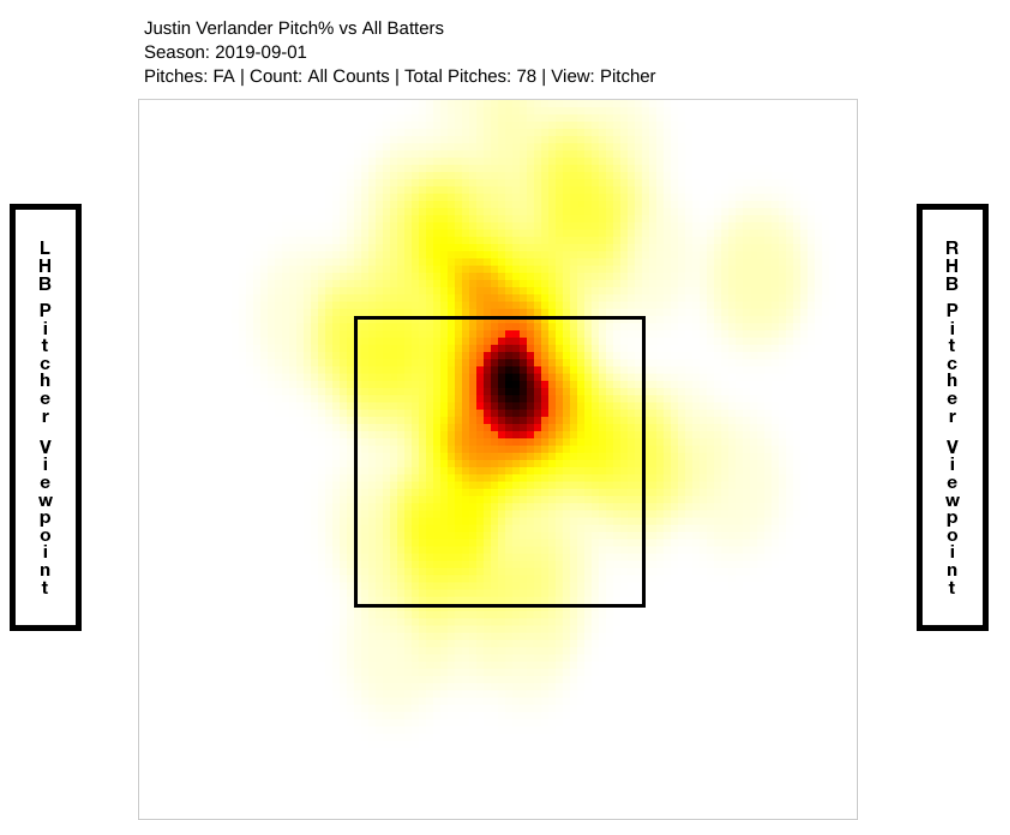
Of those 78 fastballs, Verlander got 15 swings and misses and seven strikeouts, with his slider responsible for another five strikeouts and the curve responsible for the remaining two. For those interested in hidden perfect games, with Verlander’s one walk coming to the second batter of the contest, he’s just one batter away from a hidden perfect game and 27 up and 27 down.
Verlander lowered his ERA to 2.56, with his unsightly 33 homers keeping his FIP at a merely very good 3.42 on the season. In the American League, Verlander’s 5.2 WAR trails only Lance Lynn, Charlie Morton, and teammate Gerrit Cole. The 36-year-old righty’s 35% strikeout rate would be a career high, with his 4.8% walk rate nearly matching last season’s excellent 4.4% figure.
Verlander has been challenging hitters all season long, and nearly every time, he gets the better of the matchup. As Jay Jaffe noted in June, Verlander has dominated despite all the homers, and Sunday’s start was just the eighth all season in which he didn’t give up a long ball. Verlander not only avoided homers on Sunday, but he avoided nearly all hard contact in furthering his place in history. Sitting behind only Nolan Ryan and Sandy Koufax is an impressive place to be. A no-hitter is going to have some random bounces that help shape history, but in recent memory, no pitcher has deserved a no-hitter more than Justin Verlander did against the Blue Jays on Sunday night.
Craig Edwards can be found on twitter @craigjedwards.
I still got Lance Lynn for the cy young.
That would make me smile a big ol smile
That’s exactly why FIP (and WAR) is stupid.
Verlander: 7th in FIP (3.42), 1st in ERA, 1st in xwOBA
Lynn: 3rd in FIP (3.00), 11th in ERA, 7th in xwOBA
Why? Because FIP (and BABIP) wrongly assumes that pitchers don’t have much control over their batted balls.
– Verlander’s pop-up (launch angles > 50 degrees) rate –
’15: 15.2% (5th among 143 SP’s with at least 300 BBE)
’16: 15.1% (3rd)
’17: 11.4% (14th)
’18: 16.7% (3rd)
’19: 14.5% (3rd)
During that time, he has generated 356 pop-ups and allowed .014 AVG- .023 SLG on them, which means that they are basically free-outs. Despite this, FIP gives Verlander absolutely no credit for his extreme pop-up tendency.
Allowing four pop ups, which are almost never hits, among 13 batted balls is a big deal.
Popups are included in WAR.
Are you talking about IFFB?
Pitchers don’t have much control over batted balls. They have some, and it usually doesn’t matter as homers are usually decent proxies for quality contact suppression. In the Lynn vs. Verlander discussion, Verlander has given up less quality contact despite the homers. There is a very good argument that Verlander and 2-4 other pitchers have pitched better than Lynn in the AL using xwOBA. Lynn still having a great xwOBA shows that FIP isn’t stupid.
Nope, you are just flat-out wrong about this CM thing.
– Tony Blengino on Contact Management –
“When you think about it, pitchers essentially have two major components to their job: K/BB management and contact management. For those of you who have read some of my previous articles here, contact management is really a thing; pitchers do have a clear impact on the type of contact they allow. Pitchers can have fly-ball, grounder and even pop-up tendencies that influence the amount of production they allow, and also impact the authority of contact allowed within each ball-in-play grouping.”
– Andrew Friedman on Tony Watson –
“Watson has been high on our radar for a while and we checked in periodically with the Pirates about him,” Friedman said. “He is a master of inducing weak contact and he’s a great competitor and teammate. He’s been a big part of our continued success and is going to help lengthen our bullpen in October.
– Dodgers pitching MLB ranks in Exit Velocity and Hard Hit (95+ MPH) % –
’15: 1st in EV and 1st in Hard Hit %
’16: 1st, 1st
’17: 2nd, 1st
’18: 3rd, 1st
’19: 1st, 1st
There is a reason why the Dodgers haven’t hired a single Fangraphs writer in its history.
I’m trying to understand this more. Is it being downvoted because of the somehwat standoffish tone, or because of skepticism over contact management?
I find the list with the Dodgers leading the league in lowest exit velocity for five seasons intriguing, but not entirely sure the significance of what I’m seeing. And I do feel like there is something in fangraphs WAR that seems to underrate what Verlander’s doing a sizable amount, but not sure why.
Is there anyone who can clarify both sides of this argument in a reasonable way?
If we agree that pitchers have control over contact quality, does Verlander’s higher hard-hit rate than Lynn’s count against him meaningfully? Does the fact that his home run rate is *twice* Lynn’s count? How about allowing the highest pull rate of his career despite having a lower than average (for him) ground ball rate?
People are hitting the ball hard off of Verlander when they are hitting him. He is very good! It would not be bad if he won the Cy Young! But he is also running a 90% strand rate. Since the strike, here is the complete list of seasons where an ERA-qualified pitcher had a strand rate higher than Verlander 2019:
nobody
Now, the second highest of his career was 2018 and that’s the 6th highest since the strike. That seems like a mark in his favor here! He’s figured out a way to strand runners that nobody else in the history of the game ever has! Baseball: it’s full of innovation!
But … the Astros as a team have the 8th and 2nd highest strand rates since the strike in those seasons. So it’s possible he’s simply benefiting from the team being good at this in some way. Is he supposed to get credit for that? Maybe! Maybe not! We credit pitchers for team effects all the time.
Mainly it seems to be that they are very good at striking other teams’ hitters out (1st and 2nd K rate since the strike). And Verlander is super duper good at that, as good as he’s ever been in his career. So maybe it’s his ability to miss bats, rather than his ability to get popups, that is most worth celebrating.
My point is not to say Lynn or Verlander is right and the other is wrong. If it’s about contact management, there’s some reason to think Lynn is actually better than Verlander this year (but again it’s not clear-cut). If it’s avoiding walks and any kind of contact, Verlander has been better than Lynn (so I’m not sure why you wouldn’t make that part of your argument). And then maybe you want to ask whither Gerrit Cole in all this, who is extra good at missing bats.
My point is to say synthetic measurements like FIP and WAR are hard, and you can pick and choose your data points to say one pitcher is better than another. You’ll never see anyone at Fangraphs say a small edge in WAR or FIP is proof positive one pitcher is better than another because they know better. These are broad brushstrokes and they are interesting ways to get generalized impressions about what’s in the underlying data, and that’s all anyone ever treats them as.
In other words, it’s an argument because it’s an argument. Your dead-set certainty is at odds with the very thing you’re arguing about. And adding insults to the publication where you’re making your comment wins you no extra credit.
Funny thing – when you included highest strand rates I immediately wondered where Blake Snell was last year. Then I look at the list to see he’s 2nd in strand rate post strike, just barely behind Verlander! Ironic, as I think that high strand rate probably kept Verlander from getting his 2nd Cy Young last year.
Obviously Verlander has benefited from a generous BABIP (though I’m still interested to understand more about why the Dodgers pitchers are leading in Exit Velocity every single year). I’m wondering if the 90% is a little misleading, since Verlander’s WHIP is so low, his homers are so high (so adds to his WHIP but aren’t on base) and pitchers pitch less innings now, we’re talking about less baserunners than probably anyone else we’d compare this statistic to. So yes the strand rate is helping him significantly, but not near as much as a normal 225-250 IP, 1.00-1.10 whip pitcher who gives up home runs at a normal rate.
The issue isn’t whether pitchers have control over their batted balls or not, because it’s pretty obvious that a pitcher neither has complete nor zero control over it. The question is whether introducing balls in play introduces more error than it solves. Isolating the things that are uncontaminated by other factors is a solid approach that likely captures the value a pitcher brings to the table better than complicated models that attempt to tease out the relative effects of the defense.
To make the case that a pitcher is responsible for BABIP, you probably have to look at some kind of batted ball data to make the case. So Luis Castillo has an incredible BABIP, but he’s also great at keeping the ball on the ground. Charlie Morton has a 3% barrel rate, which is awesome, so that makes some sense why his BABIP is so low. Marcus Stroman has both of those characteristics. Verlander’s BABIP is microscopic, but aside from the pop-ups (which are incorporated into WAR) I’m not seeing a ton of evidence he’s responsible for the weak contact. You could do it I’m sure if you dig into the data enough, maybe, but it’s not at all clear we’d find it.
Baseball Prospectus had an article that compared xwOBA, FIP, DRA to see which one was the most repeatable at estimating wOBA from one year to the next. xwOBA and FIP basically tied. My guess is that FIP is slightly more accurate for pitchers with a normal quality of contact suppression skill on balls in play as quality of contact skill can’t be separated from the noise, and xwOBA being vastly superior for the extremes in quality of contact on balls in play.
He’s far worse at everything than Verlander this year except home runs allowed.
That’ll happen when you play in Arlington with an awful defense.
I might be wrong, but I’m pretty sure a big problem with normalizing for an “awful defense” means the statistics are neutralized across the board. Meaning that if the Rangers defense actually overperformed in Lynn’s starts, he’d still get extra credit in his peripherals, because they assess based on the team’s overall performance.
I’m pretty sure this is why Aaron Nola’s 2018 bWAR is so absurdly high. He gets extra credit because the Phillies defense was historically awful, but breaking it down on a per start basis, they actually overperformed for him significantly. So he really gets double credit: his ERA is lowered because of that overperformance, and his peripherals are lowered as well because that overperformance isn’t factored in, whereas it inherently is in ERA.
I don’t know the case for Lynn, but it’s why you can’t just go “awful defense!” and give a guy the Cy.
I’m aware of that issue. But I don’t know how to look up how the defense has performed on each pitcher individually.
Also the ballpark is more of a factor than defense here.
Agreed on the ballpark, but more season to season variance is going to come from batted ball luck and how a defense responds to it than the fluctuations that come from home parks, even one as extreme as Arlington.
Come to think of it, this explains why Mike Minor’s bWAR is so high. He has 7.5 WAR with a 3.12 ERA, presumably because the idea is his ERA would be even lower with a better defense. But -should- a guy really have a 3.12 ERA with under a strikeout per inning and solid, but not elite control?
One could just use stats based on exit velocity and launch angle to remove defense and ballpark effects. Only downside to this is that Lynn would likely drop to about 4th best pitcher in the AL using that approach.
That mixing of pre-1908 and post-1908 stats in the first paragraph had me scratching my head for a minute there.
“wait, 30 pitchers…and 27 of them with two no-hitters…but then he joins a crowd of 5…”
check again… there are no pre-1908 stats mentioned. Since 1908, there’s 30 pitchers with at least 1 no hitter, 27 with more than 1 but only 5 with more than 2 (this is Verlander’s 3rd no hitter).
Shouldn’t the charts read “percentage chance of NO hit by xBA” rather than “percentage chance of hit by xBA”?
Yes. Thanks.
I’m not sure why people knock Verlander for the home runs. Three things are true with Verlander’s 4- seamer up in the zone: (1) it’s extremely difficult to hit, (2) it will get plenty of pop-ups when hit, and (3) for those rare instances where the hitter does manage to square it up, it’s going to be a homerun. Apparently Verlander is cool with that, because the name of the game is give up as few runs as possible, and if giving up the least amount of runs means giving up home runs in the process, so be it.
Well, he is decidedly not cool with that…
“Major League Baseball’s turning this game into a joke. They own Rawlings, and you’ve got Manfred up here saying it might be the way they center the pill. They own the f—ing company. If any other $40 billion company bought out a $400 million company and the product changed dramatically, it’s not a guess as to what happened. We all know what happened. Manfred the first time he came in, what’d he say? He said we want more offense. All of a sudden he comes in, the balls are juiced? It’s not coincidence. We’re not idiots.”
…but the rest of your point is right. He’s incredible.
I thought I read that last year Verlander led the league in ‘just enough’ homers (I’m curious where he’d rate this year). Since one of the big goals of fWAR is to factor out luck in batted balls, is there any adjustments done for this? Or is a 330 ft. wallscraper with a 10% chance to be a home run treated the same as a mammoth 450 ft. no doubter for WAR purposes? With the statcast data we have now, is there any attempt to make these adjustments?
Taking a look at Verlander’s splits this year, his FB%, HR/FB, and K% are all higher with bases empty than with runners on. Now factor in how few base runners he allows in the first place, and 27 of his 33 HR allowed are solo shots. So he’s definitely been effective in limiting the damage from that high home run rate.
So this would indicate that he’s pitching to contact more with runners on, correct? Because his strikeouts and fly balls both drop with runners on. I’m just curious on the underlying thought behind this. High risk/high reward (HR or K) when bases are empty, but not with runners on? Is this something pitchers generally do, or a new trend? Also, is there a way to see what Verlander’s BABIP is with RISP?
I’d say he is pitching more to contact and inducing more grounders with runners on… he’s had higher K, GB and HR rates with the bases empty in 2017 and 2018 as well. In fact, this year he’s actually a ground ball pitcher with runners on 1B only, while allowing a BABIP under .170 in those situations. With runners in scoring position this year, he gets a boatload of infield flies.
If possible, pitchers want to maximize the odds of getting an out, yet minimize the damage from yielding barreled balls/homers with runners on. Since batters have the opposite incentive, most pitchers would have their work cut out for them with such a strategy. If you’re a Justin Verlander, you have more of a chance to dictate the outcome of any given plate appearance.
He’s given up the 33 homers, but he also has a 0.77 WHIP, 5.6 hits surrendered per 9 IP, and .166 opponent’s batting average – all best in the majors. He’s basically untouchable, but when he does get hit, it leaves the park.
That strike zone is wild. He threw a no-hitter while only getting one call in his favor versus nine pitches inside the strike zone being called balls? Good lord.
I’m not sure where the disconnect is, but that strike zone image doesnt match up with what my eyes saw, or what the graphic on the Blue Jays broadcast showed. There were probably 8-10 borderline strikes called in Verlander’s favour (not necessarily a complaint, as they were *perfect* pitches).
In particular, I recall two iffy strikes down and in to LHHs – one was a FB to Biggio (iirc) that may have touched the very edge of the plate, and the other was a CB for strike 3 that was an inch or 2 further inside. I’m only seeing one called strike in that spot though.
Huge fan, and I mean this in the least dickish way possible: a 1/8 probability would be “7 to 1 odds”.
1/10 would be 9:1 and so on.
He’s going to be a Hall of Famer. This late-career renaissance with the Astros has sealed it.
For all the talk about the need to adjust HoF standards for modern-day starters, Verlander’s resume would’ve been first-ballot in any era. 3000Ks, MVP, eight (!) top-5 Cy Young finishes, and he’s a good bet to reach 250 wins. The only real question now is whether this second peak lasts long enough for him to beat Kershaw for “best pitcher of his generation” status.
I don’t know exactly how much adjustment there is going to be of standards going forward, but it’s worth remembering that Verlander would have been a questionable case had his career ended with him putting up a couple of 2-win seasons instead of being traded to the Astros and returning to league ace status. But at this point, I think even if his arm falls off this year in the playoffs and he never pitches again, he’s a lock. I’m counting 7 seasons where’s been a league ace (more than 5 fWAR, and five of those seven above 6 fWAR) and it’s not like he’s been bad in those other seasons either. The guy’s career is probably now ahead of Roy Halladay’s. It’s incredible what he’s done.
I totally agree he’s ahead of Halladay now – his numbers were eerily identical to Halladay’s end of career numbers after last season. And I agree he went from being borderline HOF to a lock.
But implying that only happened due to his trade to the Astros is revisionist history.
His injured year with the TIgers, 2014, was around 2 WAR. The next year (2015) he came back and was not great through 133 innings, but still on pace for a 3.5-4.5 WAR season. In 2016, with the Tigers, he finished 2nd in the Cy Young (many feel he should have been first). In 2017, before he was traded, he was not quite Cy Young level, but still at 4.5 bWAR through 28 starts. He was very clearly among the best pitchers in the league before joining Houston, very clearly an ace and back on HOF track.
Of course, since joining Houston (whose analytics department may be slightly, I mean by the very thinnest margins, better than Detroit’s), he’s turned into a HOF lock and ace of aces. I think you have to choose between him or Scherzer as best pitcher in baseball since the time of that trade. But he wasn’t a 2 WAR pitcher who got traded to Houston and turned it around. Not at all.
Good stuff. & to dig down deeper, in 2017 he scuffled thru early July. On 7/2, his ERA was 4.96 after allowing 7 runs in 3 1/3 innings. In 11 starts from that point until he was traded, he allowed 51 hits, 20 BB, 80K’s, 2.31 ERA in 74 innings. Clearly, he “found” something & kudos to Houston for realizing that & pulling the trigger on a deal that many questioned at that time. As you intimate, they have surely taken him to the next level over even that run.
The 2016 CY certainly came down to awful run support from Detroit that year (That & those 2 90 yr old writers from Tampa mailing (??) in their ballots 1 week before the season ended). He had 10 no-decisions or losses in games he allowed 2 or less runs that year. Overall, 9 games where he got no or 1 run of support, 7 more at 3 runs. That is a “King Felix-ian” half his starts with 3 runs or less. Porcello had 6.83 runs of support per game, JV had 4.05.
2012 wasn’t nearly as bad, but, Price had about 1 run per game more support than JV in a year they were pretty evenly matched superficially, but, unlike this year, Price pitched in the much better pitching environment that year.
Exactly, he dominated in the 2nd half of 2016 before being traded. I remember he almost no hit the Dodgers in one of his last starts as a Tiger.
And I agree, as much as pitcher wins shouldn’t be a big deal in Cy Young voting, they still make a small amount of difference. He almost certainly would have two more Cy Young awards if he had decent run support from the Tigers. And they were not bad Tigers offenses – they just scored poorly when he pitched or didn’t hold leads.
I would argue that the game was NOT called very well. By my count, hitters took 58 pitches. Assuming the 2-D graph is correct, the home plate umpire incorrectly called 10 of those. That’s 17% of pitches that were incorrectly called (and mostly unfavorable to JV). Yikes! #robotumpires
After thinking “huh, that was easy” as the final out was made, it’s fun to see the numbers support that. Relatively speaking, of course. A no hitter is never “easy” but I was surprised that there wasn’t a defensive gem or a moment in the game where it seemed in jeopardy. Verlander just dominated.
I really like the comparison of ‘no-hitter odds’. That was an incredibly dominant no-hitter. But I’d really really love to see how Verlander’s no-hitter odds here would stack up to some of the other great no-hitters with tons of strike outs. Haha, can I request a whole article on that!?
Pretty sure this can only be done well as far back as Statcast has tracked hit probability publicly, which began in 2017.
I would love to see it compared even just back to 2017! Was there any other game that had as high a chance of being a no hitter as this one anytime in the last 3 years?
Baseball Savant doesn’t have an easy way to get complete games, so I’ve selected with games with SP and removed any without at least 27 results and sorted for xBA. This isn’t a 1 to 1 match with Edwards methodology
Player, Results, Date, xBA
Justin Verlander 27 9/1/2019 0.057
Max Scherzer 28 6/14/2015 0.064
Max Scherzer 28 10/3/2015 0.073
Clayton Kershaw 27 7/18/2015 0.075
Carlos Martinez 28 5/20/2017 0.078
Chris Sale 27 8/8/2017 0.078
Carlos Carrasco 29 7/30/2015 0.083
Madison Bumgarner 27 7/10/2016 0.083
Carlos Carrasco 27 9/25/2015 0.085
Clayton Kershaw 29 5/1/2016 0.086
Clayton Kershaw 29 5/12/2016 0.086
Max Scherzer 28 5/26/2017 0.086
Rich Hill 28 8/23/2017 0.087
Max Scherzer 27 6/20/2015 0.087
Chris Sale 27 5/12/2015 0.093
David Price 27 8/3/2015 0.093
Ervin Santana 28 7/6/2016 0.096
Wow! #1 most likely no-hitter over the last five seasons!
I was thinking the same until I saw Six Ten’s reply. It would be cool to see how JV’s #3 stacked up to 1 & 2.
“earned” = “got lucky against a terrible lineup”
You’re right! It was a pretty terrible pitching performance in every way imaginable.
8-1 odds of a no-hitter, haha holy fuck. Proud my country’s team have been sacrificed twice for the cause.
Can you do that for Perfect Game prob?
Any other pitcher games of more hits than 1 or 2 with odds above 50-1?
I agree Lynn may be deserving of Cy Young. He has the better xFIP, which normalizes HR rate, than Verlander. Lynn has been super unlucky in LOB driving his ERA up, at ~70%, near the bottom of the league. Verlander is the LOB% league leader at 92.7%, with Cole right behind him at 86.3% and Wade Miley at 6th…seems like an Astro thing. That seems like an article to me…how are 3 Astro pitchers in top 10 in LOB?
Got to be something to do with pitch mix, location or something they change with men on base? It can’t all be luck or superior fielding or positioning (wouldn’t that show thru without men on base?)
I mentioned it just in passing above, but the Astros of 2018 and 2019 are the #1 and #2 team since the strike (and presumably of all time) at striking out other teams. And they have top ten strand rates since the strike, too.
My initial thought with Verlander and Cole suggested this was about high K rates but Miley totally breaks that. However, he’s good at getting both soft contact and lots of ground balls. That doesn’t tell enough of the story because historically he’s run a very average strand rate. So there’s clearly more they are doing on top of that.
This does seem like an interesting article!
Lynn doesn’t have a better xFIP. Even using xFIP- to control for park effects, Verlander is clearly better in that stat. Verlander and Cole have high LOB% as Astros because they strike out a ton of guys, don’t walk many, don’t give up many hits besides for homers, and Astros have a great defense (UZR has trouble measuring it with all the shifts). Miley appears to be incredibly lucky.
If Miley does have a reason besides luck, natural variation, it likely isn’t the same as Verlander and Cole as he’s a completely different pitcher even though he’s on the same team.
Yeah, I’m confused where you’re getting Lynn as having a better xFIP? He’s way down the list.
Also, I found this interesting. For what it’s worth, Verlander if way way ahead of every other pitcher in WPA (Lynn is 27th or something). I know that’s used a little more for hitters, and people are all over the place whether that should count much in MVP races. But wow, how is Verlander so far ahead!?
The Lynn WAR statistic got my head spinning more than Verlander’s no no.