Justin Verlander’s Innings Could Fill a Boat

As Justin Verlander takes the mound tonight, he’ll do so with 240.1 innings pitched this season between regular season and playoffs. In the last three seasons, Verlander’s 2019 campaign is just the second to go at least 240 innings; his 242.2 inning in 2017 is the other. Since 2011, there have been 26 seasons during which pitchers have thrown at least 240 innings. Verlander accounts for five of them. If he makes a decent start tonight and Houston advances to the World Series, he’ll likely be the first pitcher to go over 250 innings in a season since 2014, when James Shields, Madison Bumgarner, and David Price all eclipsed that mark. Verlander’s quality deservedly receives the bulk of the attention when analyzing the ace, but the quantity deserves accolades as well.
If we look a single player’s career and then compare his totals to his peers only during those seasons when he was active, it is bound to be misleading, as it cuts off the careers of others at the beginning and end where fuller comparisons are better made. For example, Justin Verlander’s 72 WAR is first among all pitchers since 2006 when he pitched his first full season. That Verlander was the best pitcher in baseball over that time is a defensible argument, but it should be noted that Clayton Kershaw is just seven wins behind Verlander and five years younger. If we looked at the leaders from 2006-2026, Verlander might not be first. Similarly, if we go back to 1996, we see Randy Johnson and Pedro Martinez jump ahead of Verlander. If we go back to 1986, Roger Clemens and Greg Maddux are more than 40 wins ahead of him, with Mike Mussina, Curt Schilling, John Smoltz, and Kevin Brown also in possession of a higher WAR. This isn’t to take away anything from Verlander — the other pitchers discussed are all great. But it is a reminder that selectively choosing seasons can skew the results.
With that established, let’s look at some skewed results. Here are the leaders in 200-inning seasons since 2006:
| 200+ IP Seasons | |
|---|---|
| Justin Verlander | 13 |
| James Shields | 10 |
| Cole Hamels | 9 |
| Mark Buehrle | 9 |
| Zack Greinke | 9 |
| Félix Hernández | 8 |
| Jon Lester | 8 |
| Max Scherzer | 8 |
| Bronson Arroyo | 7 |
| CC Sabathia | 7 |
| Clayton Kershaw | 7 |
| Cliff Lee | 7 |
| David Price | 7 |
| John Lackey | 7 |
| Madison Bumgarner | 7 |
| Adam Wainwright | 6 |
| Dan Haren | 6 |
| Matt Cain | 6 |
| Roy Halladay | 6 |
| Corey Kluber | 5 |
| Ervin Santana | 5 |
| Jeff Samardzija | 5 |
| Jeremy Guthrie | 5 |
| José Quintana | 5 |
| R.A. Dickey | 5 |
| Tim Hudson | 5 |
| Tim Lincecum | 5 |
If we went back to beginning of this century, Mark Buehrle would actually surpass Verlander, with 14 200-inning seasons. He’s the only pitcher on this list who even gets close. Going back another 20 years will put a handful of names ahead of Verlander (Maddux, Clemens, Johnson, and Tom Glavine), but the list is short and includes players who played in a different era in terms of usage and bullpens. When compared to his peers, Verlander and Buehrle are in a class by themselves.
When considering innings, 200 is a nice, round number, but Verlander has a bunch of seasons where he pitched significantly more than 200 innings. There have been 495 individual seasons since 2006 with at least 200 innings, but those numbers go down dramatically when adding even just 10 innings at a time:
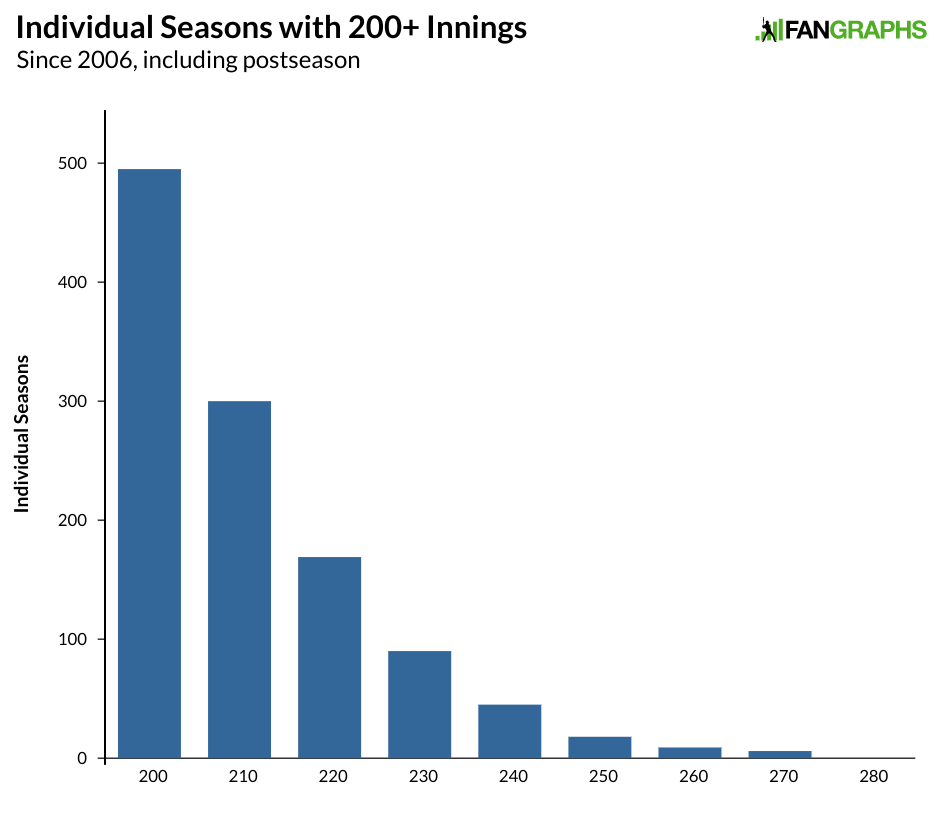
Every 10-inning increment lops off about 40% of seasons at a time. That isn’t the case for Verlander, though, as he has gone well above 200 innings in many years. The share of Verlander seasons that make up the total number of seasons goes up as a result:
| Innings | Individual Seasons | Verlander | % Verlander |
|---|---|---|---|
| 200 | 495 | 13 | 2.6% |
| 210 | 300 | 10 | 3.3% |
| 220 | 169 | 9 | 5.3% |
| 230 | 90 | 7 | 7.8% |
| 240 | 45 | 6 | 13.3% |
| 250 | 18 | 2 | 11.1% |
| 260 | 9 | 2 | 22.2% |
| 270 | 6 | 1 | 16.7% |
| 280 | 0 | 0 | NA |
Verlander has a shot of pushing those last few rows to an even higher percentage. With 10 more innings, he’ll have three of the 19 seasons above 250 innings; if he gets 20 innings — say seven tonight and two six-inning starts in the World Series — and he’ll have three of the 10 seasons of at least 260 innings. If we look at the pitchers with at least five 200-inning season, we can see how their numbers drop off compared to Verlander:
| Pitcher | 200+ Seasons | 210+ Seasons | 220+ Seasons | 230+ Seasons | 240+ Seasons | 250+ Seasons | 260+ Seasons | 270+ Seasons |
|---|---|---|---|---|---|---|---|---|
| Justin Verlander | 13 | 10 | 9 | 7 | 6 | 2 | 2 | 1 |
| James Shields | 10 | 6 | 5 | 3 | 3 | 2 | 0 | 0 |
| Cole Hamels | 9 | 7 | 5 | 1 | 1 | 1 | 1 | 0 |
| Mark Buehrle | 9 | 3 | 1 | 0 | 0 | 0 | 0 | 0 |
| Zack Greinke | 9 | 6 | 4 | 1 | 0 | 0 | 0 | 0 |
| Félix Hernández | 8 | 5 | 5 | 5 | 1 | 0 | 0 | 0 |
| Jon Lester | 8 | 5 | 4 | 3 | 1 | 0 | 0 | 0 |
| Max Scherzer | 8 | 6 | 5 | 2 | 1 | 0 | 0 | 0 |
| Bronson Arroyo | 7 | 4 | 3 | 1 | 1 | 0 | 0 | 0 |
| CC Sabathia | 7 | 7 | 6 | 5 | 5 | 4 | 1 | 0 |
| Clayton Kershaw | 7 | 5 | 4 | 3 | 2 | 1 | 0 | 0 |
| Cliff Lee | 7 | 6 | 5 | 3 | 2 | 1 | 1 | 1 |
| David Price | 7 | 6 | 5 | 4 | 2 | 1 | 0 | 0 |
| John Lackey | 7 | 6 | 2 | 1 | 0 | 0 | 0 | 0 |
| Madison Bumgarner | 7 | 4 | 3 | 2 | 2 | 1 | 1 | 1 |
| Adam Wainwright | 6 | 5 | 4 | 4 | 3 | 1 | 1 | 1 |
| Dan Haren | 6 | 6 | 5 | 3 | 0 | 0 | 0 | 0 |
| Matt Cain | 6 | 5 | 3 | 2 | 2 | 0 | 0 | 0 |
| Roy Halladay | 6 | 6 | 6 | 4 | 3 | 1 | 1 | 1 |
| Corey Kluber | 5 | 4 | 3 | 2 | 1 | 0 | 0 | 0 |
| Ervin Santana | 5 | 5 | 3 | 0 | 0 | 0 | 0 | 0 |
| Jeff Samardzija | 5 | 3 | 0 | 0 | 0 | 0 | 0 | 0 |
| Jeremy Guthrie | 5 | 2 | 0 | 0 | 0 | 0 | 0 | 0 |
| José Quintana | 5 | 0 | 0 | 0 | 0 | 0 | 0 | 0 |
| R.A. Dickey | 5 | 4 | 3 | 1 | 0 | 0 | 0 | 0 |
| Tim Hudson | 5 | 5 | 2 | 1 | 0 | 0 | 0 | 0 |
| Tim Lincecum | 5 | 4 | 3 | 1 | 1 | 0 | 0 | 0 |
The list is sortable, and if you went through every increment, Verlander leads them all except for 250+, where CC Sabathia comes out ahead with four seasons that reached that mark. In every other category, Verlander’s totals would actually lead the category one column over with 10 fewer innings. Only James Shields has as many 200-inning seasons as Verlander has 220-inning seasons. Only Sabathia has as many 220-inning seasons as Verlander has 240-inning campaigns. Nobody pitches like Verlander does. In terms of the sheer number of innings in a season, Verlander has one of the top marks, from back in his 2011 season, and two in the top-seven with his 2012, but he does not have the highest total during that time:
| Year | Player | teams | REG | PO IP | Total IP |
|---|---|---|---|---|
| 2013 | Adam Wainwright | Cardinals | 241.2 | 35 | 276.2 |
| 2011 | Chris Carpenter | Cardinals | 237.1 | 36 | 273.1 |
| 2010 | Roy Halladay | Phillies | 250.2 | 22 | 272.2 |
| 2009 | Cliff Lee | Indians/Phillies | 231.2 | 40.1 | 271.3 |
| 2011 | Justin Verlander | Tigers | 251 | 20.1 | 271.1 |
| 2014 | Madison Bumgarner | Giants | 217.1 | 52.2 | 270 |
| 2012 | Justin Verlander | Tigers | 238.1 | 28.1 | 266.2 |
| 2009 | CC Sabathia | Yankees | 230 | 36.1 | 266.1 |
| 2008 | Cole Hamels | Phillies | 227.1 | 35 | 262.1 |
| 2013 | Clayton Kershaw | Dodgers | 236 | 23 | 259 |
| 2008 | CC Sabathia | Indians/Brewers | 253 | 3.2 | 256.2 |
| 2007 | CC Sabathia | Indians | 241 | 15.1 | 256.1 |
| 2014 | David Price | Rays/Tigers | 248.1 | 8 | 256.1 |
| 2011 | James Shields | Rays | 249.1 | 5 | 254.1 |
| 2006 | Chris Carpenter | Cardinals | 221.2 | 32.1 | 253.3 |
| 2010 | CC Sabathia | Yankees | 237.2 | 16 | 253.2 |
| 2014 | James Shields | Royals | 227 | 25 | 252 |
| 2011 | C.J. Wilson | Rangers | 223.1 | 28 | 251.1 |
| 2011 | Roy Halladay | Phillies | 233.2 | 16 | 249.2 |
| 2010 | Félix Hernández | Mariners | 249.2 | 249.2 |
| 2007 | Brandon Webb | Diamondbacks | 236.1 | 13 | 249.1 |
| 2016 | Corey Kluber | Indians | 215 | 34.1 | 249.1 |
| 2012 | Matt Cain | Giants | 219.1 | 30 | 249.1 |
| 2010 | Tim Lincecum | Giants | 212.1 | 37 | 249.1 |
| 2015 | Jake Arrieta | Cubs | 229 | 19.2 | 248.2 |
| 2010 | Cliff Lee | Mariners/Rangers | 212.1 | 35.2 | 248 |
| 2013 | Jon Lester | Red Sox | 213.1 | 34.2 | 248 |
| 2015 | Clayton Kershaw | Dodgers | 232.2 | 13.2 | 246.1 |
| 2011 | CC Sabathia | Yankees | 237.1 | 8.2 | 246 |
| 2008 | Roy Halladay | Blue Jays | 246 | 246 |
| 2015 | Dallas Keuchel | Astros | 232 | 14 | 246 |
| 2010 | Matt Cain | Giants | 223.1 | 21.1 | 244.2 |
| 2015 | David Price | Tigers/Blue Jays | 220.1 | 23.1 | 243.2 |
| 2014 | Johnny Cueto | Reds | 243.2 | 243.2 |
| 2014 | Adam Wainwright | Cardinals | 227 | 16 | 243 |
| 2017 | Justin Verlander | Tigers/Astros | 206 | 36.2 | 242.2 |
| 2006 | Johan Santana | Twins | 233.2 | 8 | 241.2 |
| 2013 | Justin Verlander | Tigers | 218.1 | 23 | 241.1 |
| 2009 | Adam Wainwright | Cardinals | 233 | 8 | 241 |
| 2006 | Bronson Arroyo | Reds | 240.2 | 240.2 |
| 2016 | Madison Bumgarner | Giants | 226.2 | 14 | 240.2 |
| 2016 | Max Scherzer | Nationals | 228.1 | 12 | 240.1 |
| 2019 | Justin Verlander | Astros | 223 | 17.1 | 240.1 |
| 2008 | James Shields | Rays | 215 | 25 | 240 |
| 2009 | Justin Verlander | Tigers | 240 | 240 |
In 2014, Justin Verlander had a down, 3.2-WAR season and followed it up by pitching just 133.1 innings in 2015. We don’t know what caused his numbers to drop during those seasons, but it might have had something to do with averaging 260 innings over the previous three. This year has been another great year for Verlander in a great, Hall of Fame-worthy career. His ability to pitch at an extremely high level has been fantastic, but his ability to pile up innings in an era during which few pitchers are doing so truly sets him apart.
Craig Edwards can be found on twitter @craigjedwards.
Poor CC. Just checking out all his 250+ inning seasons, he’s the only guy to lead Verlander at any cutoff in the graph above.