Let’s Design a New Line Score
Last Friday, I suggested a change to line scores that I think would go a long way towards updating them for the modern era. I’ve spent quite a bit of time thinking about the broad strokes of the change – how errors and hits are no longer the most useful two data points, and how extra-base hits can tell you a lot about how a game felt.
One thing I couldn’t do before last Friday: get thousands of passionate baseball fans to read my idea and suggest changes. I still like my idea – one-base hits and extra-base hits instead of hits and errors – but I liked tons of the suggestions that I received in the comments as well. Rather than rule by fiat, I thought it would be interesting to poll the same people who came up with all these great ideas on which one they like best.
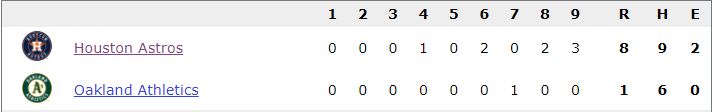
To demonstrate each of the possible scoring solutions, I’m going to use the contest between the Astros and A’s that led off last Friday’s column. As a reminder, here’s the line score rendered in the current style (courtesy of Baseball Reference):
Riffs on My Original
My Solution
Briefly: events that place the batter on first base safely (plus all errors, for ease of scoring) go in the “1B” column. Extra-base hits go in the “XB” column. That makes for two columns plus runs, just like a standard box score. I think that some of the later options will be better, if only for their handling of errors, something I was overly concerned with in my initial pass. It looks like this:
| Team | Runs | 1B | XB |
|---|---|---|---|
| Astros | 8 | 12 | 5 |
| Athletics | 1 | 10 | 2 |
Baserunner Option
FanGraphs Member g4 suggested a similar but potentially more intuitive solution. Instead of the “1B” column, they propose a column for total baserunners. The abbreviation is up to you – BR, TBR, whatever you’d prefer – but this column is every batter who reached base safely. After that, there’s another column for extra-base hits. This gets rid of “1B” while still showing you at a glance how busy the bases were. Amusingly, this first permutation shows off one of the limits of my proposed score: neither error in this game resulted in a baserunner. Perhaps errors should be treated on a case-by-case basis, which would add a slight computational load to scorers but show the results of the game more clearly. The Baserunner Option looks like this:
| Team | Runs | TBR | XB |
|---|---|---|---|
| Astros | 8 | 17 | 5 |
| Athletics | 1 | 10 | 2 |
Baserunner/Home Run Option
I liked g4’s solution, but I thought of an even simpler twist. With total baserunners on board, I’m a little less interested in separating doubles from singles. Home runs still deserve their own space though. You can easily imagine a game where a team can’t string together their doubles, but that’s not the case for homers. With doubles and triples now covered somewhere else, we could use the third column for home runs instead, like so:
| Team | Runs | BR | HR |
|---|---|---|---|
| Astros | 8 | 17 | 2 |
| Athletics | 1 | 10 | 0 |
Non-Hit Option
FanGraphs Member JohnThacker suggests a three-column option that makes “1B” actually mean singles, a definite problem with my first proposal. “XB” remains the same. A third column – baserunners as a result of non-hits – combines walks, HBPs, and errors that result in a base. I’m flying blind on an abbreviation here, but how about “OBR” for other baserunners? This gives more of a feel for how the baserunners reached – a barrage of walks and a pile of singles feel different on the field, and now they would in the line score as well:
| Team | Runs | 1B | XB | OBR |
|---|---|---|---|---|
| Astros | 8 | 4 | 5 | 8 |
| Athletics | 1 | 4 | 2 | 4 |
Total Bases/LOB Ideas
Three-Column Total Bases
FanGraphs Member HappyFunBall suggests a three-column line score (four counting runs) that includes baserunners, total bases, and the “other baserunners” column from above (they called it unforced errors, but I don’t want to score a walk as an unforced error). This has the benefit of distinguishing between doubles and home runs, showing how many runners reached base overall, and delineating between walks and singles. It has two drawbacks. First, it uses three columns, which may not be a huge problem but is worth noting. Second, the mismatch between baserunners and total bases might look weird in some cases (when there are few hits but many walks, basically). I don’t find this to be a huge problem, however, and like the density of information:
| Team | Runs | BR | TB | OBR |
|---|---|---|---|---|
| Astros | 8 | 17 | 18 | 8 |
| Athletics | 1 | 10 | 8 | 4 |
LOB Option
Commenter bennysantiago09 suggests using “left on base” as an additional variable that tells the story of the game, and I quite like it. This option didn’t have an exact suggestion for the rest of the columns, and there’s some danger of duplication of information when you combine baserunners, runs, and left on base, but for a first pass at it, I kept my 1B/XB formulation (corrected for errors that don’t allow a baserunner) and added left on base:
| Team | Runs | 1B | XB | LOB |
|---|---|---|---|---|
| Astros | 8 | 12 | 5 | 8 |
| Athletics | 1 | 10 | 2 | 7 |
Back to Basics Option
Commenter rburgh suggests a three-column approach that really hits at the building blocks of baseball. A column for plate appearances tells you how many batters each team sent up. A column for baserunners tells you how many of those reached base. A column for total bases tells you how much each runner advanced. One potentially tricky part of this solution is that in this formulation, “total bases” is not the same as the current statistic of that name. It includes base advancements on errors (and presumably steals), though not on other players’ hits. It’s simultaneously an elemental idea and one that would require getting used to:
| Team | Runs | PA | BR | TB |
|---|---|---|---|---|
| Astros | 8 | 43 | 17 | 26 |
| Athletics | 1 | 35 | 10 | 13 |
Meta Ideas
Data-Driven Option
FanGraphs Member Morris Greenberg suggests a method of coming up with a box score, rather than a specific suggestion for columns. The idea is to run a regression on runs scored, using a ton of different available measures, and see which two do the best combined job of explaining variation in runs scored. I used the 2021 season as an example, and the best two-column solution was baserunners and left on base, but that’s somewhat academic – the only way to get a baserunner off base without them scoring is to make an out on the bases, and there are vanishingly few of those these days. The best two-column solution that didn’t just close the loop completely was total baserunners and home runs, which scored very close to total baserunners and extra-base hits. Sounds like a victory for me, but I’ll still present it here:
| Team | Runs | TBR | HR |
|---|---|---|---|
| Astros | 8 | 17 | 2 |
| Athletics | 1 | 10 | 0 |
Now that you’ve read a big pile of solutions, I’m putting the question to you: which one do you like best? The following is a poll of all of these solutions except for the meta-solution, because it suggested solutions that are already included in the poll. And thanks a ton for voting. Hopefully this is another milestone on my quest to update line scores for the modern day. Here’s the poll:
Ben is a writer at FanGraphs. He can be found on Bluesky @benclemens.
One reason I like my suggestion is that it’s a relatively small change, and it keeps it easy to tell if a no-hitter is going, while also making it easier to distinguish a perfect game than the current box score.
Count me down as someone who says that no-hitters and perfect games are exciting, and that’s one thing that you want to see at a glance.
John, I voted for your idea because, as your noted, it’s important to have the easy-to-grasp notion of an ongoing perfect game/no-hitter. When I catch a linescore of a ballgame in the late innings, and I see 0 0 0, that’s all I need to know this bears watching. Yours does that.