Lorenzo Cain, Victim of Circumstance

The Milwaukee Brewers didn’t win the World Series in 2018, but that doesn’t mean it wasn’t a successful year. After several frustrating seasons of rebuilding, a division title (in a one game playoff against the hated Cubs, no less!) and a trip to the NLCS felt like huge strides in the right direction. It seemed as though the team had arrived a year early in a manner reminiscent of the 2015 Cubs, with better-than-expected seasons from young players and star turns from big offseason additions. In 2019, their young pitching staff would have another year of experience, and by adding Yasmani Grandal, the front office kept the talent pipeline primed.
144 games later, things haven’t gone as planned. The Brewers are out of playoff position, though they have lately gained ground, with only a 25% chance of reaching the postseason. Christian Yelich’s season-ending fracture adds injury to insult — a second straight MVP season would be a fun September storyline, and without Yelich’s bat, the team’s chances seem even more remote. Before his injury, however, Yelich was absolutely carrying the Brewers, improving on his MVP 2018 nearly across the board. Grandal has been magnificent as well, walking and slugging his way to a 123 wRC+ in addition to his usual excellent framing.
If those two have done so well, why aren’t the Brewers having a better season? Injuries have taken their toll. The pitching staff hasn’t developed as hoped, but that’s hardly shocking given how volatile pitching can be. More surprisingly, Lorenzo Cain has gone from down-ballot MVP contender to merely another guy, and on a team without much outfield depth, the decline has been particularly tough to deal with. While he’s been slowed by a knee injury since early August, his season was hardly better before then — his wRC+ has actually increased since sustaining that injury. What’s wrong with Cain?
One look at that oldest of statistics, batting average, will tell you something’s not right. From 2014 to 2018, Cain hit .300 or better four times and had an overall .301 average to pair with a .361 OBP. His .253 and .321 marks in 2019 are near career lows. The last time he was hitting like this, he wasn’t Lorenzo Cain, star outfielder. He was simply Lorenzo Cain, Royals prospect with a good glove. The gap between this Cain (0.9 WAR) and star-turn Cain (5.7 WAR in 2018) is so wide that it’s hardly believable.
Batting average isn’t the most valuable statistic, but the three components that make it up are all trending in the wrong direction for Cain. First, there’s strikeout rate. Strikeouts count against average without giving you a chance for a hit, so limiting strikeouts is a key component to hitting for a high average. It’s a part of the game that Cain has often excelled at — he hasn’t struck out more than the league average since 2014, and he actually got better at it as the league has gotten worse, posting a career-low 15.2% rate last year. This part of Cain’s game is worse, but that’s hardly surprising given the high bar he set last year, and his 16.9% strikeout rate is still tremendous.
If it’s not the strikeouts, is it the home runs? Home runs are hits that don’t give fielders any play on the ball, an automatic outcome not subject to the vagaries of defense and luck. If Cain lost a lot of home run power, we’d see it in batting average, and it would also sap his overall value tremendously.
The problem with this explanation is that Cain never had a ton of power to begin with. He’s a groundball hitter who hasn’t turned an average amount of his fly balls into home runs, and if you combine a below-average fly ball rate with a below-average home run rate, there simply aren’t many home runs to lose. Cain hit only 10 homers last year. He’s down to eight this year, even as the league adds power, but that smattering of lost home runs isn’t remotely enough to explain his production drop. In fact, Cain is barreling up a higher percentage of his batted balls this year than he did last year, a still-low 4.1%.
The last component of batting average is BABIP, and here we’ve struck pay dirt. Cain has always, and I do mean always, been excellent at converting balls in play into hits. Before 2019, his worst BABIP mark was .309 in 2013, and his career mark was a robust .345. It’s no secret why — groundballs lead to a higher BABIP than fly balls, and Cain is fast. By keeping the ball on the ground and beating out infield hits, he accumulated extra hits. Cain also has a swing that’s optimized to hit the ball hard and on the ground — from 2015-2018, he had the 17th-highest average exit velocity on ground balls in all of baseball, not too shabby for someone with little power in the air.
What’s happened this year? He’s running a BABIP that’s essentially league average, .295. For someone who built so much of his value for so long on scratching out extra hits here and there, the drop off is severe. Before the season started, ZiPS projected Cain for a .330 BABIP. That BABIP propped up an otherwise milquetoast forecast — were you to take away singles until Cain was projected for a .295 BABIP, his projected wRC+ would fall from 109 to 95. That’s a huge decrease, and it’s so large because the vast majority of Cain’s plate appearances end with a ball in play.
Is the BABIP decline merited? That’s harder to answer. By one simplistic metric, the answer is a clear no. If you merely look at his expected BABIP based on each ball’s exit velocity and launch angle, and fold in sprint speed for grounders, Cain has hardly lost anything this year:
| Year | BABIP | xBABIP |
|---|---|---|
| 2015 | .347 | .354 |
| 2016 | .341 | .342 |
| 2017 | .340 | .354 |
| 2018 | .357 | .342 |
| 2019 | .295 | .345 |
That’s comforting, but it’s also bizarre. Is Cain a victim of bad luck, or has something real changed that the stats don’t pick up?
To dig deeper, we need to look by batted ball type. Let’s use wOBA this time, to better represent the actual value Cain provides with his batted balls. This year’s production is all over the place:
| Type | wOBA | xwOBA | Diff |
|---|---|---|---|
| Barrel | 1.184 | 1.197 | -0.013 |
| Solid Contact | .748 | .642 | 0.106 |
| Flare/Burner | .550 | .635 | -0.085 |
| Under | .000 | .097 | -0.097 |
| Topped | .172 | .198 | -0.026 |
| Weak | .000 | .105 | -0.105 |
Some of these aren’t huge samples — Cain has 10 batted balls classified as “weak” this year. The flare/burner and under categories, however, are a problem. Cain has 116 flares and 72 balls he’s hit under this year, almost as many as he has in the other four categories combined. These contact types are similar — they’re both balls hit in the air but not well.
These two types of hits accrue most of their value by being poorly struck. Some aren’t in the air long enough for an outfielder to make a play on them. Some barely make it over infielders’ heads. Some of these are actual line drives, but many are line drives in the box score only, bloops and bleeders that find a hole.
In Cain’s case, those soft hits simply aren’t finding outfield grass. Take a look at where the “under” fly balls have landed this year:
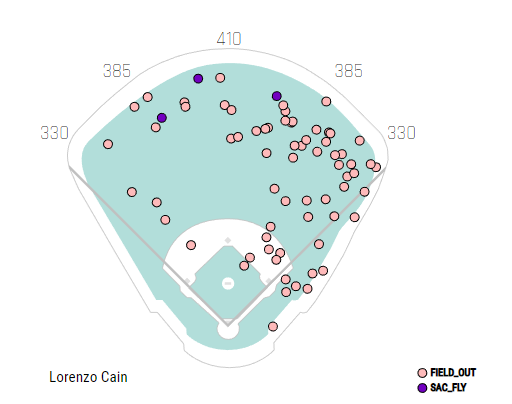
In prior years, those balls found gaps. The soft fly balls to right occasionally landed for hits, and the odd fly ball snuck over the wall for a home run. Take a look at a similar spray chart for 2016, when a home run in Houston and a few balls that fell in front of outfielders led to a more productive season of poorly hit balls:
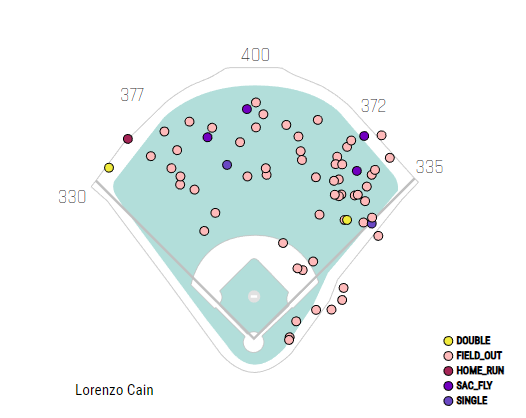
The reverse has been true for flares. More of these soft line drives are carrying to outfielders rather than falling in front of them, as can be seen in this comparison between 2016 and 2019:
It might be hard to tell the difference, but if Cain produced at his 2016 level on flares and burners, his wOBA would be 38 points higher this year. Add in the balls he hit under, and there would be another 12 points of wOBA available to him. If Cain could simply be as “fortunate” on contact as he was in 2016, he’d have a wRC+ around 110, rather than his current disappointing 77, an increase that would be worth roughly 2.2 WAR.
So have we solved it? Lorenzo Cain is still an above-average hitter, someone who should be on pace for a four-ish win season, and just catastrophically unlucky? Not so fast. When someone has a systematic problem, as Cain does with his weak contact this year, it’s worth asking whether there’s an underlying cause. In this case, I think there might be, though it’s something so tenuous it’s hard to say for certain.
The first thing worth considering is whether positioning could be to blame. The numbers are thin, but they’re qualitatively in the right direction. Right fielders, on average, start three feet shallower against Cain than they did in 2016-2018, minimizing that hole in short right. First and second basemen have never stood farther from the plate, on average, than they have this year against him, which further pinches the gap there. This isn’t some park effect, either — right fielders stand eight feet closer to home plate against Cain than they do against the average hitter in Miller Park, enough to cut off sinking liners that would previously fall for hits.
At the same time, Cain’s weak contact is carrying further than ever. His flares and burners have carried roughly 20 feet further, on average, than they did in 2016. They’re also carrying roughly 20 feet further than they did last year despite similar exit velocities. The lively baseball, ironically enough, seems to be pushing Cain’s fly balls to outfielders’ gloves.
Now that I’ve given a potential explanation for Cain’s plummeting BABIP and production, let me introduce a caveat. These two trends, adjusted fielder positioning and increased carry on soft fly balls and liners, are tremendously hard to draw conclusions from. How much has the positioning affected Cain’s production? I don’t know. How much of it is Cain, and how much of it is the particular set of defenders he’s played against? I don’t know. How much of the increased carry is here to stay, and how much is merely a quirk of Cain randomly hitting balls slightly differently than normal? You guessed it — I don’t know.
What I can say, though, is that Cain’s value has been tanked by his flagging production on flares, burners, and balls he hits under. That’s not a sexy result, not a sudden age-related decline or a shocking change in batted ball distribution. It’s not a sudden inability to hit fastballs, whatever his pitch values might suggest — his whiff rate is down against fastballs and his xwOBA on contact against them is up.
That’s not to say that age won’t catch up with Cain. His plate discipline metrics are all a tick worse this year. His sprint speed is down nearly a foot per second, and he gets down the line to first base less quickly than he used to. Some of this can surely be ascribed to his aching knee, but Cain is at the age where speed declines even without injuries. His defense, while still excellent, is a hair worse than last year, whether you prefer UZR, DRS, or OAA. Age is coming for Cain, sooner or later. But his performance decline can’t be ascribed to age, to a sudden inability to play baseball like he once did.
I’m not sure whether this should be reassuring. The thing that took Cain’s production from top 20 player in baseball to below average is squishy and confusing. It’s not easily fixable, because it’s hard to even know the root cause. That sounds bad. On the other hand, if it’s hard to know the root cause, it could correct overnight. Maybe the ball will get de-juiced and that will restore Cain’s mojo. Maybe he’ll either hit balls farther, for home runs, or shorter, for flared singles, in the future. Maybe his batted ball distribution will change and none of that will matter.
For the Brewers and Cain, 2019 looks like a lost season. There’s good news for both, though. Yelich should be back in 2020, and nothing that happened this year should make them less confident about the core of the team. The NL Central will be tough again, and the Brewers will likely be in the thick of it. For Cain, the silver lining in his precipitous drop is that it’s less of a catastrophe than it first appears. This isn’t Chris Davis suddenly turning into a pumpkin or Félix Hernández losing his zip. Cain is still, for the most part, what he was last year. What remains to be seen is whether the small margins that separate success from failure will flip back in his favor in 2020.
Ben is a writer at FanGraphs. He can be found on Bluesky @benclemens.
Wednesday, September 11 2019 is Sad Brewers Day on Fangraphs.com!