Nobody Actually Hits Good Pitching

During Game 3 of the ALCS, Jeff Francoeur noted that 10 of the 12 pitchers who had surrendered postseason home runs to Alex Bregman were All-Stars, eliciting a comment about how Bregman hits well against good pitching. That’s undoubtedly a fun fact, but the notion has been rattling around my brain for the last couple weeks. I’ve definitely heard stories about players who hit good pitching, but I’ve never heard of anyone looking at splits based on the quality of the pitcher on the mound.
The main problem with that idea is a logical one. Break down any batter’s performance into its constituent parts, and you’ve entered a zero sum game. If you’re at your best against great pitchers, that means you’re hitting worse against everyone else. It’s hard for me to imagine that there are many players who fare better against Justin Verlander than they do against, well, anyone on the Nationals.
There could be players who are less bad than average, but if I had my choice of superpowers, I’m not sure that’s the one I’d pick. It would definitely help out in the playoffs, but over the course of the season, batters see a lot more average and poor arms than they do great ones. I’d rather perform well the majority of the time.
To get altogether too cute with things, if there are players who hit better against the best pitching, then that’s a weird reverse split and we should take advantage of it. We can platoon them with players who do better against poor pitching. Player A plays against frontline starters, and Player B starts against the back of the rotation, then sits back down when the high-leverage relievers come in.
Like I said, this has been rattling around my brain for a while. So in order to dislodge it, I did some research. I identified the best pitchers in the league by FIP for each of the last two years, minimum 40 innings. Our top 50 represents the top 6% of all pitchers and the top 12% of pitchers who threw at least 40 innings. In 2021 and earlier, those percentages are slightly lower, as the number of pitchers used in a season has been climbing.
I went to Baseball Savant and pulled the wOBA of every batter in the league when facing that year’s top 50. For the rest of this article, I’ll be talking about that number, as well as a player’s wOBA against all pitchers, and the difference between the two. For the sake of simplicity, I’ll call them top 50 wOBA, overall wOBA, and wOBA difference. I’m about to type wOBA so many times; please prepare yourself for some serious semantic satiation.
Here is a graph of the 59 players who had at least 40 plate appearances against top 50 pitching in both 2021 and ’22:
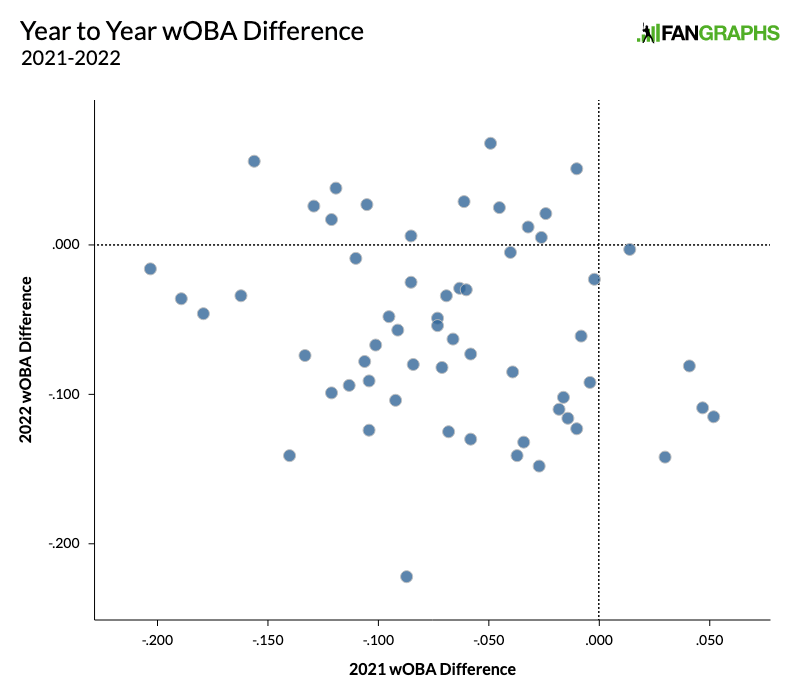
There wasn’t a single player with a positive wOBA difference two years in a row, though J.P. Crawford is oh so close over there in the upper right corner of the blob. The 2021 and ’22 wOBA differences have a correlation coefficient of -.20. In other words, if you have a high wOBA difference one year, it doesn’t mean you’ll do it again next year; it means you’re likely to get a visit from the regression monster.
I pulled the same numbers for the 2018 and ’19 seasons, and for the ’17 and ’18 seasons, and made two more scatterplot blobs. They had positive but tiny correlation coefficients of .1 and .06. At this point, I was ready to say that running a better wOBA against top pitchers wasn’t a repeatable skill.
I was’t thrilled, however, with the small sample of players and the small amount of plate appearances it took to qualify, so I went back to Baseball Savant and pulled top 50 wOBA for every batter in the last 10 years (I set a 20-inning minimum in 2020). It took a while.
In the last 10 years, 550 players made at least 100 plate appearances against top-50 pitching. That’s our sample. Before we really dig into the numbers, here are the best hitters of the past 10 years against top-50 pitching:
| Player | PA | Top 50 wOBA | Overall wOBA | Difference | % Difference |
|---|---|---|---|---|---|
| Juan Soto | 248 | .383 | .401 | -.018 | -5% |
| Austin Riley | 183 | .369 | .359 | .010 | 3% |
| Brandon Nimmo | 274 | .352 | .362 | -.010 | -3% |
| José Bautista | 363 | .349 | .357 | -.008 | -2% |
| Josh Willingham | 100 | .348 | .326 | .022 | 7% |
| José Martínez | 105 | .348 | .345 | .003 | 1% |
| Mookie Betts | 481 | .347 | .376 | -.029 | -8% |
| Joey Votto | 527 | .347 | .386 | -.039 | -10% |
| Rafael Ortega | 110 | .344 | .300 | .044 | 15% |
| Yordan Alvarez | 106 | .344 | .405 | -.061 | -15% |
Well, we’ve got some of the best hitters of the past 10 years. We’ve also got some other dudes. Most telling, I think, is that the superstars are all at or below their overall wOBA, whereas the surprises are over-performing theirs.
Now that we’ve had a chance to admire Juan Soto, we can dig into the math. As you’d expect, batters generally did much worse when facing the best pitching in the league: 95.1% of players were worse, 4.2% were better, and 0.5%, or three players, were exactly the same.
Against top-50 pitching, wOBA dropped by an average of .057, or 17.9%. The median change was nearly identical. To put that in perspective, in 2022, 57 points of wOBA was the difference between Marcus Semien and Victor Robles. Here’s a quick graph to give you the shape of the distribution. Each number along the x-axis represents wOBA changes within 20 points. (For example, the bucket for +20 includes increases of 11–30 points of wOBA.)
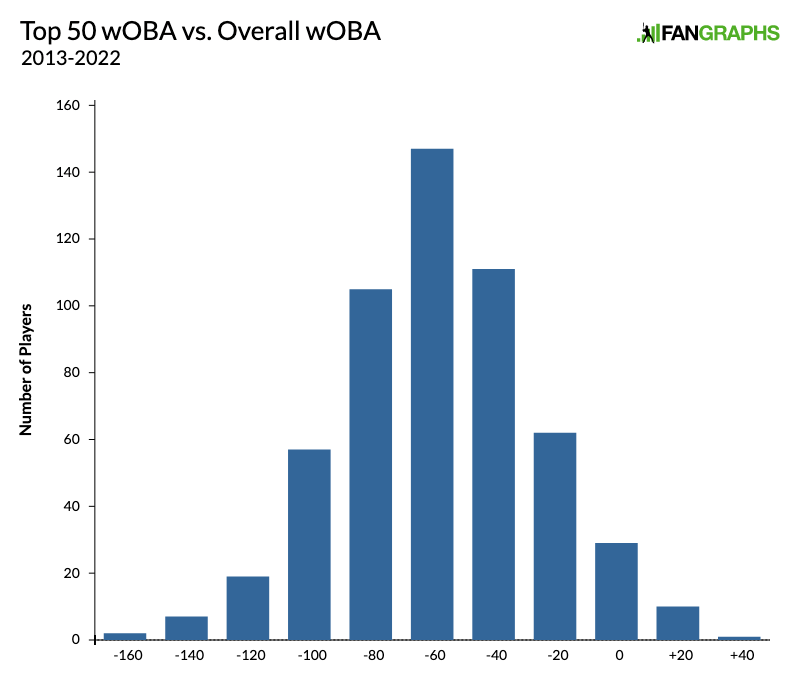
As you can see, the distribution is centered around our average loss of 57 points, and it’s extremely symmetrical. Just in time for the holiday season, you can turn this graph upside down to make a lovely, slightly overlarge menorah.
Here are the players with the biggest wOBA increases:
| Player | PA | Top 50 wOBA | Overall wOBA | Difference | % Difference |
|---|---|---|---|---|---|
| Rafael Ortega | 110 | .344 | .300 | .044 | 15% |
| James Loney | 164 | .341 | .317 | .024 | 8% |
| Devin Mesoraco | 167 | .342 | .318 | .024 | 7% |
| Josh Willingham | 100 | .348 | .326 | .022 | 7% |
| Brayan Peña | 117 | .312 | .293 | .019 | 7% |
Suffice it to say that this list no longer contains a Juan Soto or a Mookie Betts. More importantly, nobody has a wOBA difference big enough that it makes too much of a difference. There goes our weird platoon plan.
Next, I wanted to check whether good hitters fare better against good pitching. Here’s a scatterplot of overall wOBA and wOBA difference:
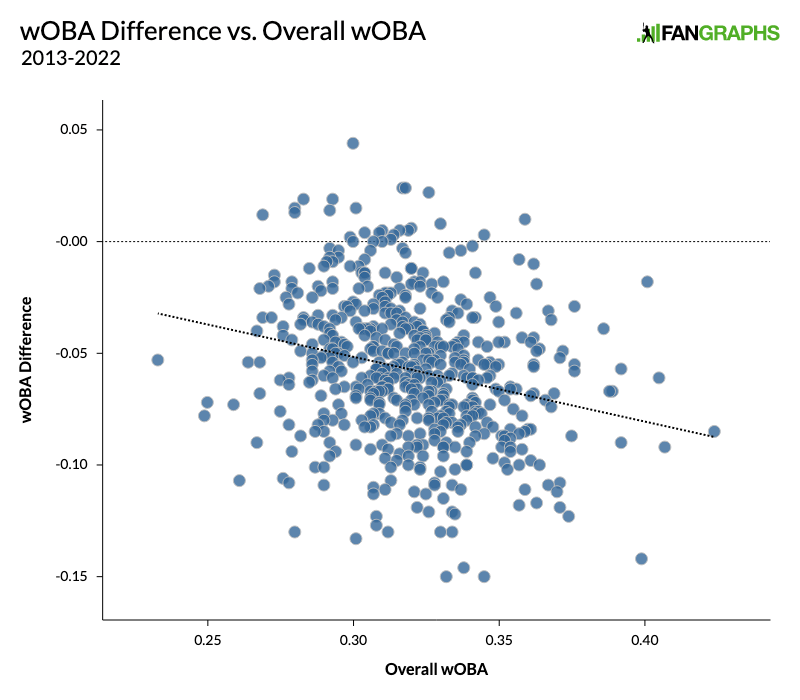
What you’re looking at is a blob with a very slight slope. That’s because there’s a small negative correlation between a player’s overall wOBA and their wOBA difference (-.24 going by actual wOBA change, and -.09 going by percentage wOBA change). In other words, the better the hitter, the steeper the drop-off when they face an ace.
Before we run too far with that conclusion, keep in mind that there’s likely some regression the mean baked in here. More importantly, better players tend to hit more often, so they’re less likely to be outliers. Here’s what happens when we start tightening up our sample size:
| Minimum PA | Players | Top 50 wOBA | Overall wOBA | Difference | % Difference |
|---|---|---|---|---|---|
| 100 | 550 | .263 | .320 | -.057 | -18% |
| 200 | 303 | .271 | .328 | -.058 | -18% |
| 300 | 171 | .274 | .334 | -.060 | -18% |
| 400 | 73 | .279 | .341 | -.060 | -18% |
| 500 | 26 | .290 | .354 | -.063 | -18% |
That’s a pretty clear trend. The players get better every time we increase the plate appearance requirement, but the wOBA difference holds fast at -18%. The list of players with at least 500 plate appearances includes players like Freddie Freeman, Paul Goldschmidt Mike Trout, and Bryce Harper, and even they fare no better against top-50 pitching.
If our hypothesis was that the best hitters find a higher gear when they’re facing great pitching, then we can officially put it out to pasture. Of the 100 players with the most top-50 plate appearances, only one had a positive wOBA difference. Elvis Andrus, please claim your prize.
The last factor is one that I speculated upon earlier. Players just don’t face elite pitching often enough for it to have an outsized effect on their overall performance. This year, Shohei Ohtani put up an atrocious .229 top-50 wOBA, but because only 57 of his 666 plate appearances came against top 50 pitching, he still put up a .370 overall wOBA, putting him in the 96th percentile.
Comparing overall wOBA to top 50 wOBA is admittedly a crude approach. I’d be interested in taking another look if and when I have the means to analyze the data in a more nuanced way. I don’t want to rule out this line of thinking out completely, even if it’s only good for bringing to light the occasional fun fact.
We have all sorts of splits these days. We break down hitters against handedness, pitch type, velocity, and vertical approach angle. The list is certain to keep on growing. For now at least, “he hits good pitching” is unlikely to become one of our go-to metrics.
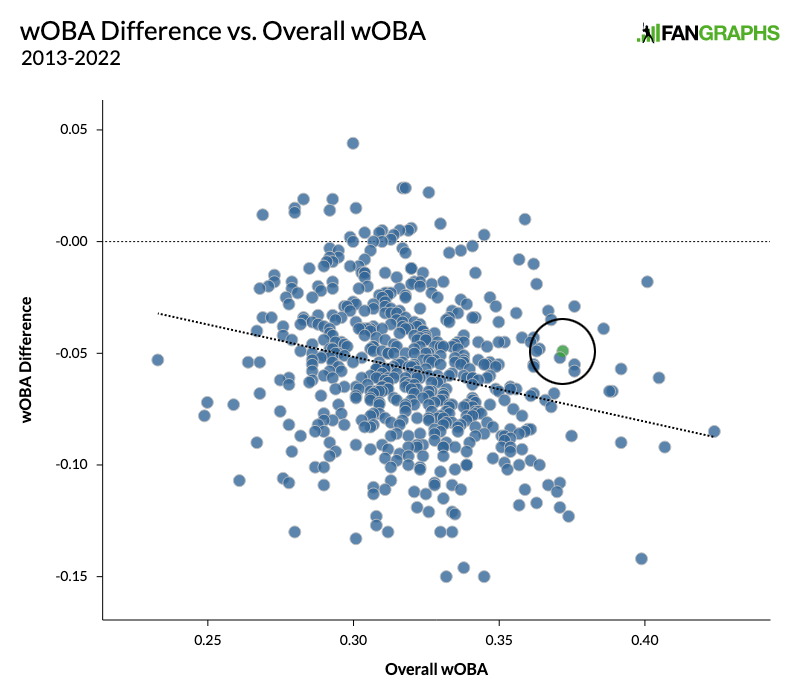
Oh, and what about Bregman, the guy who got all this started? Well, he’s definitely not better against top-50 pitching, but he is just a tiny bit less bad than average. His wOBA difference is -.047, or -13%, which puts him right where you want to be: on the good edge of the blob.
Davy Andrews is a Brooklyn-based musician and a writer at FanGraphs. He can be found on Bluesky @davyandrewsdavy.bsky.social.
I think there are a couple of lessons in all this. The first is that the good players are better than the average ones, and this is the basic overriding principle for almost everything. Platoon splits are one of the few exceptions; we shouldn’t really be expecting players to be better or worse options based on a lot of these weird splits.
The second lesson (which is probably obvious and has been echoed by a couple of other analyses here lately) is that the difference between having hitters or pitchers that “play in the playoffs” is that they just need to be better. A lot of average guys can run into decent lines when they play against other average players. In the playoffs, with the level of competition rising, that means your need for better players rises too. Alex Bregman performs better against the top pitchers because he performs better against everyone. Just because you can get by with a lineup full of guys like Eduardo Escobar in the regular season doesn’t mean it’ll work when they’re facing 3+ win guys every night; having guys like Alex Bregman in your lineup matters a lot.
“Alex Bregman performs better against the top pitchers because he performs better against everyone.”
Exactly. I think this reality may be getting “lost in the sauce” a bit in the overall article. For example, even if Yordan lost a massive 25% against Top50 pitching he would still be hitting at a level roughly equivalent to the average MLB hitter overall. So, while no one is “good” at hitting top pitching compared to regular pitching the best hitters are so darn good that they hit elite pitching as well or better than regular hitters hit regular pitching. That seems both obvious in it’s logic and yet a little shocking when you let it sink in as to what it means for how good the best pitchers and hitters both are compared to the rest of the professionals around them (let alone compared to all of us pathetic mortals).
I suspect that the story would remain the same, but is FIP the appropriate/ideal way to define “good pitcher”? Perhaps there’s something more advanced? Even just xFIP or xFIP-? Likewise, something like xwOBA for the hitters?
Moreover, should it perhaps be parsed by Starter vs Reliever?
you don’t really need anything besides FIP. other metrics like SIERA have a bunch of superfluous inferences
xERA is the only one holds water in my book. It gives credit to contact management whizzes and uses Statcast data to back it up. xFIP relies on the demonstrably horrible assumption that all pitchers should have a league-average HR/FB ratio, and the more obscure metrics like SIERA also rely on a bunch of contrived assumptions.
All that said, I think Ben Clemens (?) wrote a while back that the difference between most pitchers’ FIP and xERA evaluations is really small, so even if FIP’s not ideal, I don’t think it matters that much
I’m of the mind that xERA has largely superseded FIP and the main reason to still use FIP is for historical comparisons. The only thing that is weird about xERA is that it seems to undervalue ground balls a bit, but a quick adjustment for super heavy ground ball pitchers like Framber usually fixes that.
Isn’t part of the effect the fact that the best players don’t have as much room to improve, and that PAs against the best pitchers are the least likely situation for them to attain those peaks? If I were batting against big league pitching, the results would be so miserable that anything I scratched out would leave plenty of room for a blind lucky double or triple (dog ran onto the field and confused the shortstop) against a top pitcher; but if Mike Trout is already hitting at a rate several deviations higher than replacement-level, it’s not as if he’s going to turn it up against Justin Verlander.
I’ve been intermittently fascinated by this topic since seeing it raised on Sons of Sam Horn during the 2004 WS. To me, the most interesting question is whether running a higher/lower wOBA differential is repeatable at all. Whether they’re good, bad, or average overall you can imagine a hitter that really feasts on bad pitching and struggles against good pitching, and another that’s a tough out against everybody. But is that entirely narrative and luck in small samples, or is there an element of skill involved?
I believe that was me … and what I found, before the WS began, was that the Cardinals’ starters all had ordinary, mediocre splits, 3-4 in the batting order vs. 7 through 9. And that’s an excellent proxy for performance relative to opposition hitting quality. Elite pitchers have relative small splits — they flatten what I call the “opponent slope.” So I predicred a rout, even though the ’04 Cards had a great W/L record (best of the decade, as it turned out).
That was indeed you. Thank you for your work!
I demand more esoteric Jewish holiday jokes in my FanGraphs articles.
I think perhaps the more pertinent question would be are there hitters who are especially bad against top pitchers, notably when contending teams are trying to add pieces for their playoff runs.
For instance there were questions among Yankees fans about Judge being really quiet in the playoffs, especially in contrast to Bryce Harper for instance, and wondering if he’s truly worth the money when it’s all in the regular season. I don’t adhere to that opinion myself, but it would be interesting to see if there are more empirical data to see if certain hitters feast more on bad pitching than others.
As a longtime Astros fan I am certain Jeff Bagwell got 90% of his HoF stats against #4 and #5 pitchers throughout his career. I have no data to back this up, but it has to be true based on my perfect memory of how he let me down over and over in playoff match-ups.
I would like to see this exercise repeated with hitters against “not good” pitching (maybe excluding the top 100?)
I think your question here really digs to the heart of the matter, Baubo. And I suspect the answer to your question is that hitters who enjoy higher contact rates and better plate discipline (ie. Juan Soto) are much more likely to retain a higher degree of their productivity against good playoff pitching than do hitters that make below-average contact (like Aaron Judge, for example) but that send the ball a long way against mediocre pitching. For this reason, I would take Juan Soto over Aaron Judge in a playoff game every time.
This has to play out like the ‘clutch’ metric. Where the notion that players suddenly become better in clutch situations is nonsense, but there’s something to the idea that they don’t become demonstrably worse. Likewise, someone who is “good at hitting good pitchers” is merely not as bad at hitting good pitchers as lesser hitters are.
I have no idea who invented the idea that clutch players become better in clutch situations. Clutch players are guys who thought to not choke, which is letting the occasion get the better of you. Under pressure packed circumstances some people perform better than others, not better than themselves. In basketball for example the guy you want to take the buzzer beater is the guy who you want to take the shot under the worst possible circumstances, when the opponents best defence is stacked to prevent that shot. No one expects even average success in that situation. But “keeping your head when all about you are losing theirs” is something that some people do better than others.
I always thought that was lazy thinking.
In the postseason you are almost always going to come up against better pitching than in the regular season, and some hitters are going to have a good postseason. Drawing wider conclusions from small sample sizes is a TV commentary special.
All of these averages are results expected against that mythical mathematical entity the “average opponent”. And all averages are inflated by racking up numbers against inferior opponents. And all are deflated by the problems players encounter facing elite competition. My best guess is that what characterizes elite players is that their production is not as deflated against elite performers as lesser players.
in 2022 Verlander pitched to an OBP against of .227, and Trea Turner had an OBP of .350. Both of those numbers are against the mythical “average opponent”. In the impossible scenario of many PA against each other one would expect a number somewhere between.
Excellent work here. If you’re going to explore further, however …
I know that FIP is used for FG’s WAR, and it is a useful stat, but in no way does it measure pitcher quality accurately, because BABIP is a real pitching skill and nothing is gained by ignoring it. xwOBA is readily available and does include BABIP while excluding defense. The small year-to-year persistence of wOBA-xwOBA, with an r^2 of 6.5% of that of xwOBA (.017 vs. .263), is what you’d expect from defense.
(For hitters, wOBA is certainly good enough — the r^2 of the xwOBA difference persistence is 28% of that of xwOBA (.13 vs. .45), so the difference has a significant skill factor, beginning with pulled fly ball %.
Both of these studies use 450 PA as a season minimum.)
In theory, yes. But in practice, the ability to influence BABIP is almost non-existent, with a few key outliers. Since 1996 (the beginning of the steroid era), only 5 of the top 60 pitchers by WAR had a career BABIP under .280: Kershaw, Verlander, Mariano, Carlos Zambrano, and Jamie Moyer. And only Mariano was below .270. And zero guys were over .307, though that might be survivor bias.
So yes, those 5 might have have had some ability to influence a slightly lower BABIP. But the vast majority of pitchers are in the .280-.310 range, and pretending like a guy that managed a .250 one season can continue to do that indefinitely is just not statistically accurate.
I agree that BABIP is mostly luck, and it is worth mentioning that the difference between .280 and .310 is a hit every 33 balls in play, which in real terms is not that big of a deal. I think that his point is that ignoring hits in evaluating pitchers is a questionable decision. Gausman this year and for most of his career has allowed a higher than average BA against than the league average. That is not all defence related. His 2022 FIP was very good but his results are pedestrian.
The fact that FIP is excellent at predicting the performance of random groups of pitchers does not mean that it is excellent at predicting performance of an individual pitcher (like say Gausman)
Exactly. You’re doing a study that is going to find small effects, so why consciously include incorrect numbers for the outliers?.
The study I presented at a SABR conference that proved that hitters hit differently with runners on than with the bases empty, over the course of a career (mentioned twice at ESPN and getting Dick Cramer’s approval) estimated that there was one guy in a typical lineup tha
t was meaningfully better than average and one guy who was worse. I suspect that the same is true for hitters who hit good pitching better or worse than you’d expect from their overall numbers. At the game level it may not matter, but you’d expect the team that had 2 good and 0 bad guty in their lineup to have a measurable edge in a 7-game playoff series versus a team that had the opposite.
Cool, subtle differences between players … to find them you need to reduce the noise as much as possible. And in this case it requires almost no extra effort.
See my reply to dl80 for the typical error for FIP.
I just ran the numbers to estimate the size of the typical error introduced by giving every pitcher a league-average BABIP.
I took the 150 pitchers who had faced the most hitters in the Statcast era, calculated their aggregate BABIP and determined that the average absolute difference between actual and league-average BABIP was .011. There may be pitchers in this sample that had better or worse defense than average over the course of this large sample, but half of those cases can be expected to be good-BABIP pitchers withe bad defenses or the opposite, so this just adds player-to-player uncertainty without much affecting the overall error.
I calculated total absolute error introduced by FIP (translating hits into runs by linear weights, and assuming all singles, which is conservative). And, since Statcast has no IP numbers, I used FG to identify the 150 pitchers with the most IP (not quite the same data set, but close enough for this estimate) to get the total IP.
In this study the average FIP is off by 0.19. Call it .20 at a minimum when you include doubles and a potentially large factor from selection bias. That’s not acceptable if you’re looking to bucket pitchers into 3 or 5 groups by quality.
But the vast majority of pitchers are in the .280-.310 range
Not true. In my 150-busitest pitcher sample, it’s 73%, solid but hardly vast. For pitchers who have faced 1000 hitters, it’s 61%.
Best quote about this: (paraphrase)
Baseball is a battle between a pitcher and his stuff. Because if the pitcher is making is pitches, the hitters don’t hit.
Thank you for the great analysis. Matchups between specific-hitter and pitcher types have always been fascinating to me, and this provided great insight in that regard.
One thing that I have always wondered, which is close in topic but also a little irrelevant, is what happens when a fly-ball pitcher faces a ground-ball hitter, or vice versa? Also, what would happen if a pitcher who is known for not giving up hard contact faces Giancarlo Stanton? I suspect the results would be similar, in that Stanton would have a higher EV than the average hitter, but not close to his normal levels; even then, it would be interesting to see how much of a say pitchers/hitters have on things like launch angle and EV when facing specific pitcher/hitter types.