
On Congressional Batting Average and Walk Rate
We’re digging deep into the archives today. I’ve been meaning to write about a weird mathematical phenomenon in baseball for more than a year, and now seems like a great time to break it out. It all starts, naturally enough, with an Effectively Wild episode from 2019. That episode was about the Grand Junction Rockies’ name non-change – but it was also about the annual congressional baseball game.
Unless you follow Louisiana politics, you may not have heard of Cedric Richmond, but he figures prominently in our tale today. After a 10-year career in the House of Representatives (Orleans Parish, Louisiana), Richmond left to head the Office of Public Liaison. It’s a good thing for the balance of the annual congressional baseball game, because as Nathaniel Rakich so ably put it, Richmond was that contest’s equivalent of Mike Trout crossed with Max Scherzer, only if Scherzer got to pitch in every game.
At the time of the episode, Richmond had played eight congressional baseball games and amassed 2.5 WAR, which works out to a 50-WAR pace in a 162-game season, a number that doesn’t make any sense in the context of major league baseball. Richmond pitched at Morehouse, and while his pitching skills weren’t enough to float a minor league career, they’re comically better than your average congressperson’s. We’re talking about Jacob deGrom level dominance on the mound – at the time of the podcast, Richmond had put up a 2.20 ERA and struck out more than a quarter of the batters he faced, and completed all but one of the games he started. In a high-scoring environment (well, for people not facing Richmond), that worked out to 1.8 WAR on the pitching side.
We’re not here to talk about Richmond’s pitching, though. That’s great, and good, and his hitting is much funnier. He was hitting .652/.758/1.087, which is, uh… yeah, it’s off the charts. It’s hard to comprehend how good that is, in fact, because we don’t have any .650 hitters or .750 OBP types to create a mental framework.
This article is about that line, because something jumped out about it immediately to me as I listened. In fact, when Effectively Wild covered Richmond’s retirement from the game in 2020, Sam Miller brought it up. “There are some oddities in that line,” he said. “There’s just a real shocking lack of walks.” Seriously — where are the walks?? This guy is hitting .600 with a four-digit slug. Why throw him a pitch anywhere in the vicinity of the strike zone in a big situation, or really any situation?
Richmond’s final line in the game (he’s no longer in Congress, and thus no longer eligible) came out to .615/.730/1.038. That’s nearly indistinguishable – at least in terms of average versus on-base – from the line that first perked my ears up in 2019. Here’s a little secret, though: he walked nearly 30% of the time.
Wait, what? Yeah, today’s article isn’t actually about Cedric Richmond. It’s about math, and how numbers we think are friendly can lie to us. You probably did what I did when you saw Richmond’s line. Want to convert the difference in batting average and on-base percentage into a walk rate? Take it, sprinkle a tiny bit extra in, and convert from decimals to percentages: bam, you’ve got a walk rate. Vladimir Guerrero Jr. hit .311/.401/.601 – 12.3% walk rate. Tyler O’Neill hit .286/.352/.560 – 7.1% walk rate. Richmond’s .615/.730/1.038 – my brain tells me that’s a 15% walk rate or so.
If you break down the components, though, that’s just not how this works. Imagine a hitter who racks up 90 at-bats and never gets a hit. In 10 more plate appearance, he walks. That’s a .000/.100/.000 line, and a 10% walk rate. No adjustment necessary.
Next, let’s add nine singles. Now he’s hitting .100/.190/.100. That 90-point difference isn’t quite 10%. Why? On-base percentage and batting average don’t have the same denominator, which messes everything up.
In our first example, starting with zero, everything was easy. Zero out of 90 is the same as zero out of 100. The difference in the two rate statistics is an exact representation of how often a walk is the difference between not reaching base (never if you don’t walk) and reaching base (only when you walk).
When you start adding hits to the equation, things get distorted. Nine hits add 100 points to batting average in our example — nine out of 90 or one out of 10. They adds only 90 points to on-base percentage – nine out of 100. The two denominators are different – hits increase batting average by more than on-base percentage because one hit is a greater percentage of a player’s at-bats than of their plate appearances. Through sheer fluke of mathematical luck, our rule of “add a few percentage points to the BA/OBP gap” works quite well in the range of batting averages and walk rates that we often see.
When you start getting away from the ranges we know, those in-head rules of thumb stop working. If our fictional player went 45-for-90 at the plate, they’d be hitting .500/.550/.500. That 50-point gap in average and OBP underestimates the 10% walk rate by half. Go 90-for-90, and your 1.000/1.000/1.000 line wouldn’t have anything to say about walk rate at all.
At extreme levels of average, the rule of thumb stops working. Interestingly, that’s also true for extreme levels of walk rate. Imagine a different hitter who comes to the plate 100 times and walks 30 times while going 21-for-70 in at-bats. That’s a .300/.510/.200 line. If we took 21% (.510-.300) and added a few percentage points, we’d estimate their walk rate at 24%, maybe 25%. It is, of course, 30%.
Take Juan Soto. He hit .313/.465/.534 in 2021. An 18% walk rate, as you might estimate after a glance at his slash line? Try 22.2%. The opposite is true if you barely walk at all. Tim Anderson hit .309/.338/.469 with a 4% walk rate. If we added two or three points to his OBP/BA differential, we’d overshoot.
In fact, the relationship is strictly mathematical and makes for some beautiful graphs. For example, if the gap between OBP and average is 100 points, but a player’s walk rate is 12%, I’d call that a 1.2 walk rate multiplier. Look what happens to walk rate multipliers as average changes. The below graph is the walk rate multiplier (what you need to multiply (OBP-AVG) by in order to get walk rate) at various batting averages:
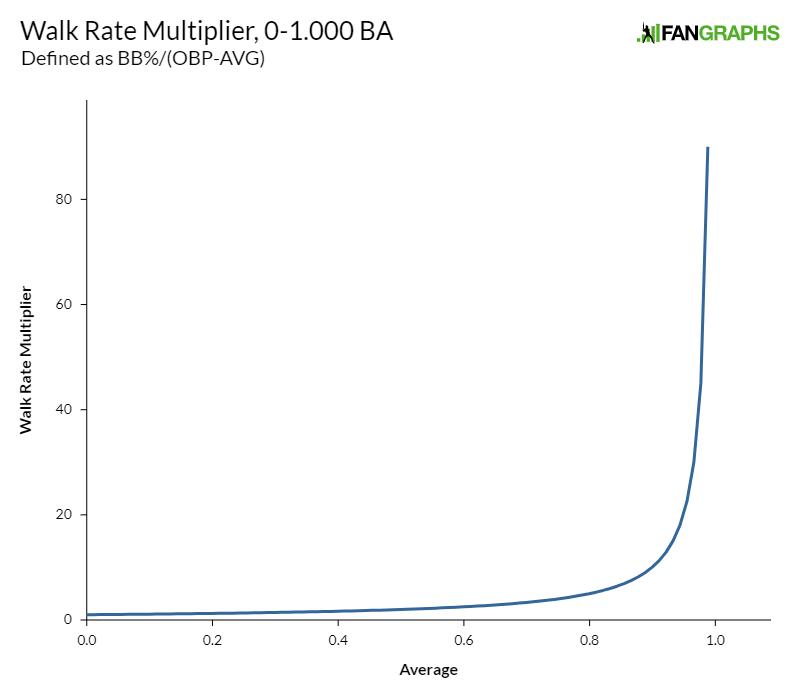
Things get silly at the extreme tail end because of the exponential growth. Say you’re batting .990 with a 10% walk rate. That’s a .990/.991/.990 slash line (all singles, naturally), which would need a 100x multiplier (.001 is 0.1%, 10% divided by 0.1% is 100). Let’s ignore that ultra-steep right side and look at that graph cut off at a .700 batting average:
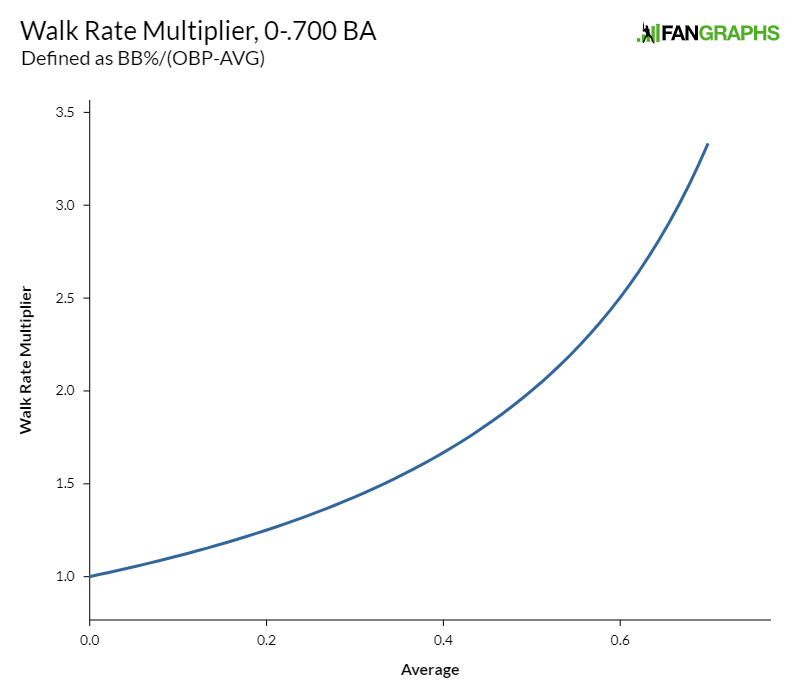
For the good hitters we’re used to, hitting around .300, this formula says that we need to multiply their OBP/AVG gap by around 1.4. That’s pretty close to that rule of thumb I mentioned up above – take the gap, then add a few points. Get up to a .615 average like Richmond, though, and you’ll need to multiply by about 2.6.
In other words, the higher the batting average, the more you need to mentally add to the OBP/AVG gap to arrive at the right walk rate. For a 10% walk rate, you get a nice straight-line relationship as batting average increases:
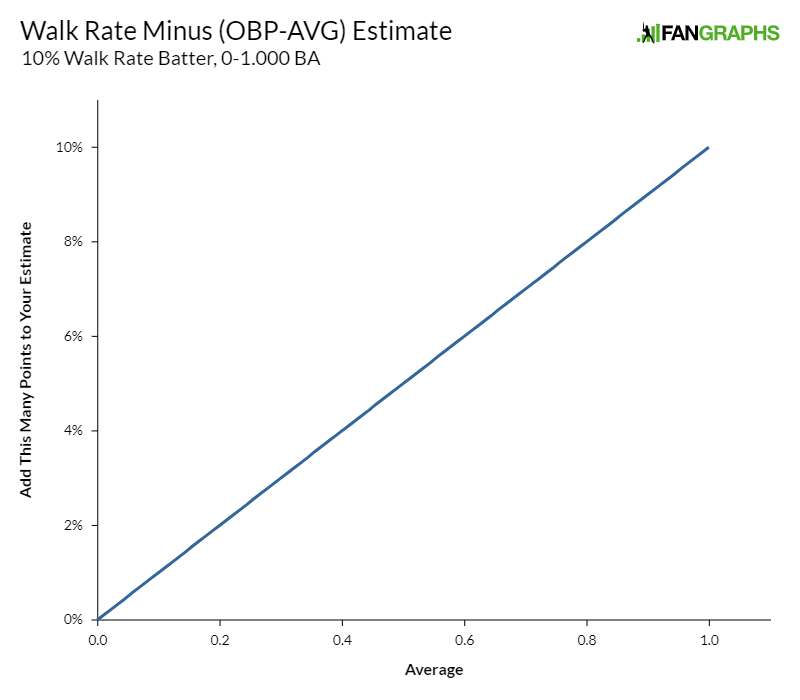
Likewise, for a given batting average, higher walk rates mean you need to add more to the OBP/AVG gap. That’s just a mathematical fact: 1.2 times 10% (.100) means adding only two points, but 1.2 times 20% means adding four points. Here’s how many percentage points of walk rate you’d have to add to the naive (OBP-AVG) estimate for a .270 hitter as their walk rate increases from 0% to 99%:
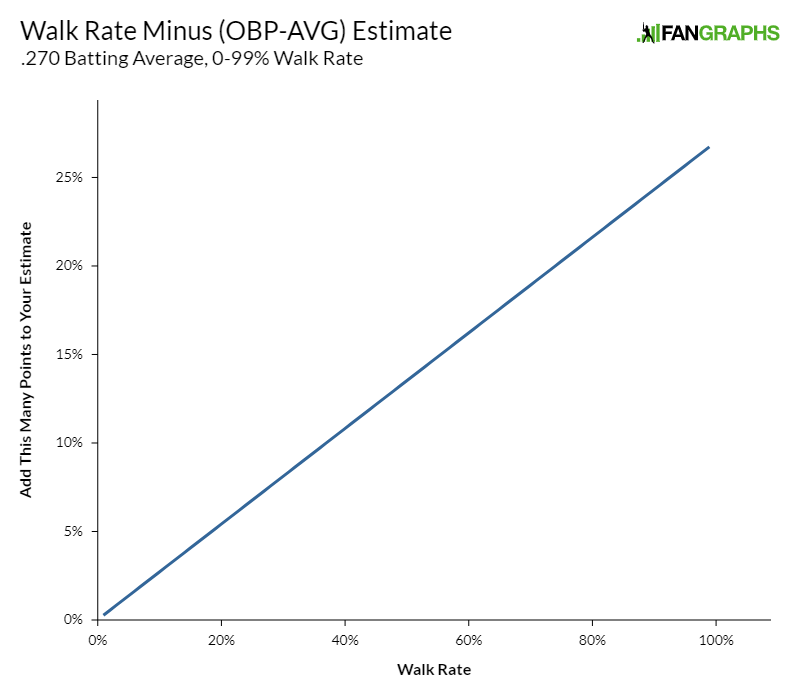
For very high walk rates, slash lines don’t make much sense; what does a .270/.990/.270 line look like, anyway? In the ranges we’re used to for walk rate, however, you can see why our rule of thumb works so well. For a 5% walk rate, you’d need to add 1.4 percentage points to the gap. For a 10% walk rate, you’d need to add 2.7 percentage points. For a 15% walk rate, you’d need to add 4.1. All of these round in our head to “a few,” which is why “take on-base minus average and add a few points” works so consistently.
Cedric Richmond’s line is anything but normal, and it won’t happen in major league baseball any time soon. The same old rule of thumb will keep working for most hitters, because most hitters exist in a narrow band of average and on-base percentage. Things will still get weird with the Sotos and Andersons of the world, of course, but their lines aren’t nearly as weird as Richmond’s comical batting success, so things won’t get that weird.
Next time you hear the name Cedric Richmond, I hope it reminds you of the beauty of baseball statistics, and how neat little mathematical relationships are hiding everywhere you look. Unless you’re playing against him in an annual Office of Public Liaison baseball game, of course. In that case, all I can say is: good luck, buddy.
Ben is a writer at FanGraphs. He can be found on Bluesky @benclemens.
Interesting! Can’t say I ever really used the “take the difference and add a few points” method to estimate walk rate, probably mostly due to the whole different denominator thing explored here that my math-major brain instinctively recoils from, but it makes sense for most MLBers and I’m sure I’ll use it now. More importantly though, math is cool!
I was actually more shocked at how low his slugging is with that kind of batting average. I assume a lot of smoked gappers ended as singles for courtesy or due to jogging it out.
This is a fascinating article.
Connected to my pet peeve about batting average.
The most overlooked flaw of batting average is that it fails to answer what I intuitively expect should be the question “How often would this batter get a hit?”
This would be answered by hits/PA, not hits/AB.
Maybe after the pitcher win is good and thoroughly dead, some enterprising young stathead can begin a campaign to MA(verage)GA by using PAs instead of ABs.
Agreed. Also, importantly, “slugging percentage” has this same problem. We want to know how OFTEN a player is going to get a total base, of any kind, when we are in a situation where you need to get a hit. Like late in the game, runners on second and third, two outs.
It’s actually not as different from the majors as you’d think. The game is played in Nats Park, so no one hits that many homers, but 41% of his hits went for extra bases (using slightly old stats I found on reddit), which is the same rate as Vlad in the bigs this year. That makes for a .400 ISO because he gets a lot of hits, but it’s not really that crazy after considering a)no one hits bombs and b)BABIP on grounders is probably quite high with random politicians playing shortstop rather than Andrelton Simmons
Andrelton Simmons, junior congressman from South Carolina, will take care of those gappers
Yeah, I’m guessing the quality of the congressional defense leaves a bit to be desired.
If your average hit is a single, your slugging percentage will equal your batting average.
If your average hit is a double, SLG = 2 x AVG, triple, SLG = 3 x AVG, home run, SLG = 4 x AVG. With a .615/.730/1.038 line, his average hit generated him 1.688 bases. Since he only has one home run (IIRC), that means a lot of doubles.
A comparable batting average to slugging percentage would be a .300 batting average with a .506 slugging percentage.
With a 30% walk rate, the comparable AVG/OBP/SLG line would be .300/.510/.506.
Gotta drag down his running component in his WAR. Not taking the extra base smh
Very, very interesting. Great work.
Somewhat related or not, I’ve always felt that a player who has a typical line of say 275 .300 .480 is more valuable in the context of an average major league offense than he is given credit for… because offense is contextual, in a different way than we normally think of it (park, league, ect).
Offense is also related to what people do around you.
A .275 .400 .375 slugging guy derives his offensive value from guys who slug .475 being in the lineup with him, the walks are nothing without hits around them to generate the runs. There is no offense without total bases, any more than there is offense without guys on base. Our mistake is that we tend to assume total bases will be there, while we give credit for high on base percentages more.
A .275 .300 .475 derives his value from lots of guys having .375 OBPs being in the lineup with him. BOTH types are essential, but we tend to act like only the high OBP guy is essential, and not the hacking high SLG guy.
I actually took a look at this earlier in the year, not that I really reached a conclusion:
https://blogs.fangraphs.com/choose-your-own-lineup-adventure-on-base-vs-slugging/
Thank you, I’ll check this out. I do realize my thought here is a bit of a “hairbrain theory”, as they say.
If you think these numbers are wild check out how much money he received from the fossil fuel industry.
I liked this article, Ben.
I liked this comment eely
My mind has been blown. Thanks, Ben.
There aren’t more Bob Bradley’s out there? I would have figured playing at an LSU or Auburn was a pretty good path to Congress, generally… I mean Cam Newton could get elected in Georgia TOMORROW.
Great stuff, Ben! Mathematics is so FREAKING elegant. And what would statistics do without baseball?
So Ben, I gotta know. Do you pay Fangraphs to be able to write such cool stuff? Is this SERIOUSLY your day job? How can one be so lucky😎