Paul DeJong Counters Strikeouts with Aggression
So here’s a thing you might see if you looked at our FanGraphs Leaderboards this morning.
| Name | PA | AVG | OBP | SLG | WAR |
|---|---|---|---|---|---|
| Cody Bellinger | 108 | .424 | .500 | .891 | 2.5 |
| Christian Yelich | 112 | .326 | .438 | .793 | 2.0 |
| Mike Trout | 96 | .303 | .510 | .636 | 1.9 |
| Paul DeJong | 108 | .343 | .398 | .626 | 1.7 |
| Matt Chapman | 108 | .311 | .407 | .633 | 1.5 |
| Jorge Polanco | 92 | .366 | .424 | .695 | 1.4 |
| Anthony Rendon | 82 | .371 | .451 | .771 | 1.4 |
| Hunter Dozier | 86 | .324 | .430 | .676 | 1.3 |
| Javier Baez | 98 | .312 | .347 | .656 | 1.3 |
That Mike Trout isn’t yet leading baseball is a surprise, and an indication that we still need some time before we start touting potential MVP candidates. Cody Bellinger is having a big year, but he put up a 138 wRC+ and four-win season when he was 21 years old. Christian Yelich was sixth in WAR last season and won MVP. Matt Chapman was seventh in WAR a year ago, Anthony Rendon was ninth, and Javier Baez was 14th. Jorge Polanco and Hunter Dozier are certainly shockers, but they are lower on this list than Paul DeJong, so it’s the Cardinals shortstop who is getting a post as he heads toward what could be his breakout season at 25 years old.
When we do an initial look at DeJong’s numbers, his .387 BABIP jumps out as unsustainable. DeJong isn’t going to put up a .343 batting average all season long. He’s not going to put up a 169 wRC+ all season long, either. He doesn’t need to in order to be one of the better players in the league, though. Since the start of last season, DeJong is just shy of 600 plate appearances and put up five wins, one of the top-30 marks in baseball despite being several hundred plate appearances behind much of the league due to a fractured left hand that cost him two months last year. DeJong’s .283 ISO does look a bit higher than we might reasonably expect, but with a .219 career ISO entering the season, it’s not like he has been without power. Even if DeJong were to drop 50 points a piece in BABIP and ISO, we’d still be looking at a player whose bat is about 30% above league average to go along with an above-average glove at shortstop. That would be roughly a six-win player, which seems rather unexpected for Paul DeJong.
If we want to look at any potential changes DeJong has made, BABIP and ISO aren’t going to tell us much this early on in the season. The big difference between DeJong this year and last year is the strikeouts. In more than 1,000 minor league plate appearances, he struck out 24% of the time. Given the level of competition, we’d expect that number to rise in the majors, and it has, as DeJong struck out 28% of the time in his rookie 2017 season and 25% of the time last season. This year, however, that number is down to 18% and it appears to be pushing his improved offensive numbers.
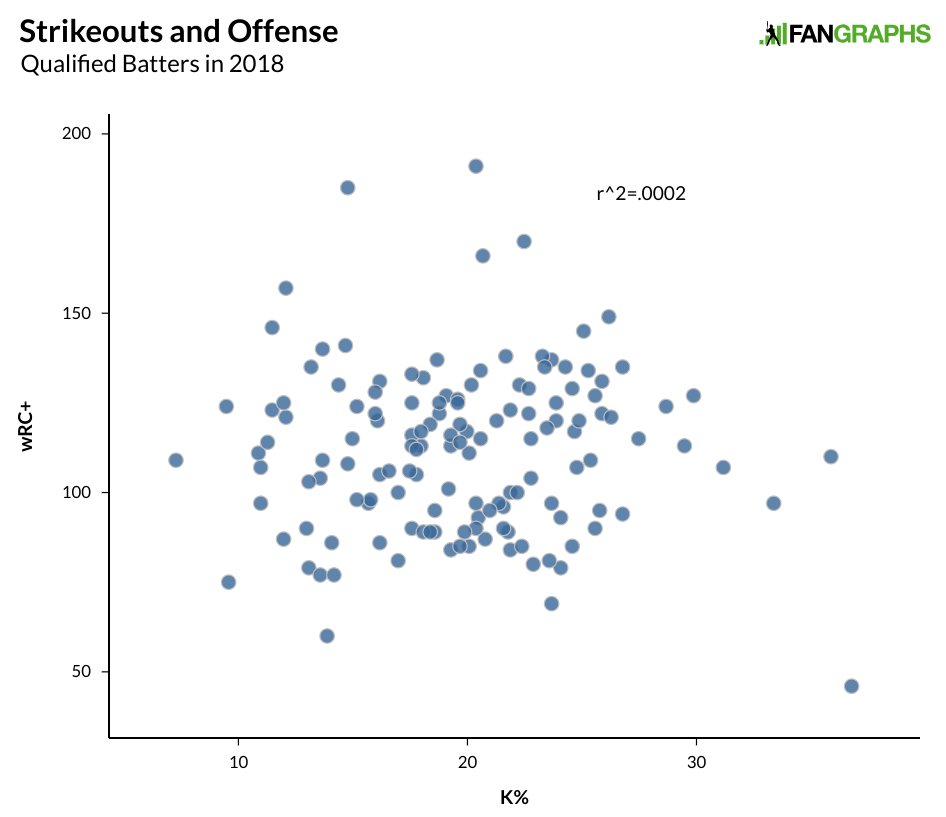
Before going on, I should note that strikeout rate and offensive production have very little relationship with each other. Hitters can have high strikeout rates and be very good, and they can post low K-rates and be quite bad. The graph below shows all qualified batters with their strikeout rates and wRC+ from a year ago.
That Paul DeJong is lowering his strikeout rate isn’t a good thing in and of itself. If he’s sacrificing power for contact, he might actually become a worse hitter. That’s something that has actually happened to DeJong at times during his career.
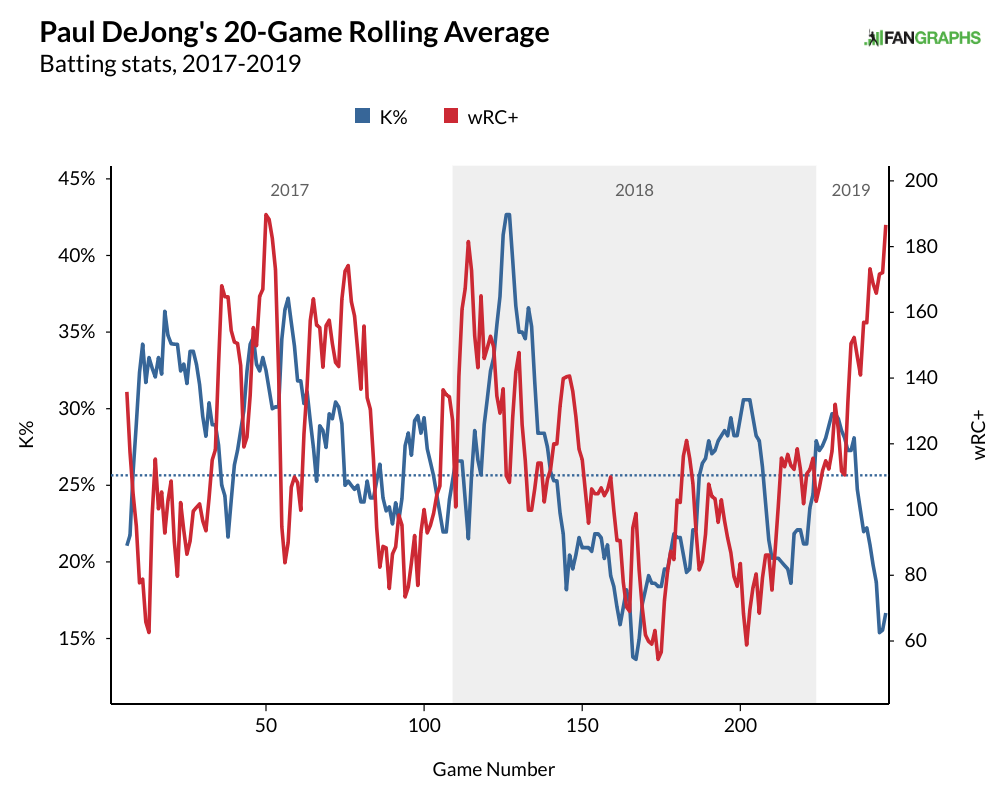
Right now, the low strikeouts are paired with a high wRC+, but there have been stretches where DeJong has struck out less often and hit very poorly. If DeJong can strike out less often and maintain the hard contact and power that has made him successful, that would be his ideal. As for what DeJong might be doing differently to make his lower strikeouts sustainable, we should first look at what a lower strikeout rate means in 108 plate appearances. A few years ago, Sean Dolinar and Jonah Pemstein updated their post on statistics and reliability and created a tool to look at how we should start believing in statistical changes. After 110 plate appearances with a 17.6% strikeout rate, the bounds of the strikeout rate with a 95% confidence interval are between 12% and 25%. We can’t be sure that DeJong’s talent for striking out isn’t still up near 25% and we can’t be sure that pitchers and DeJong might not make more changes that could push DeJong’s totals higher, but we can be pretty sure that what DeJong has done thus far isn’t a fluke. There’s something DeJong is doing to make him strike out less often.
As to mechanical changes, DeJong’s stance is slightly different. The collage below shows two pictures from 2018 on top and two pictures from 2019 on the bottom.
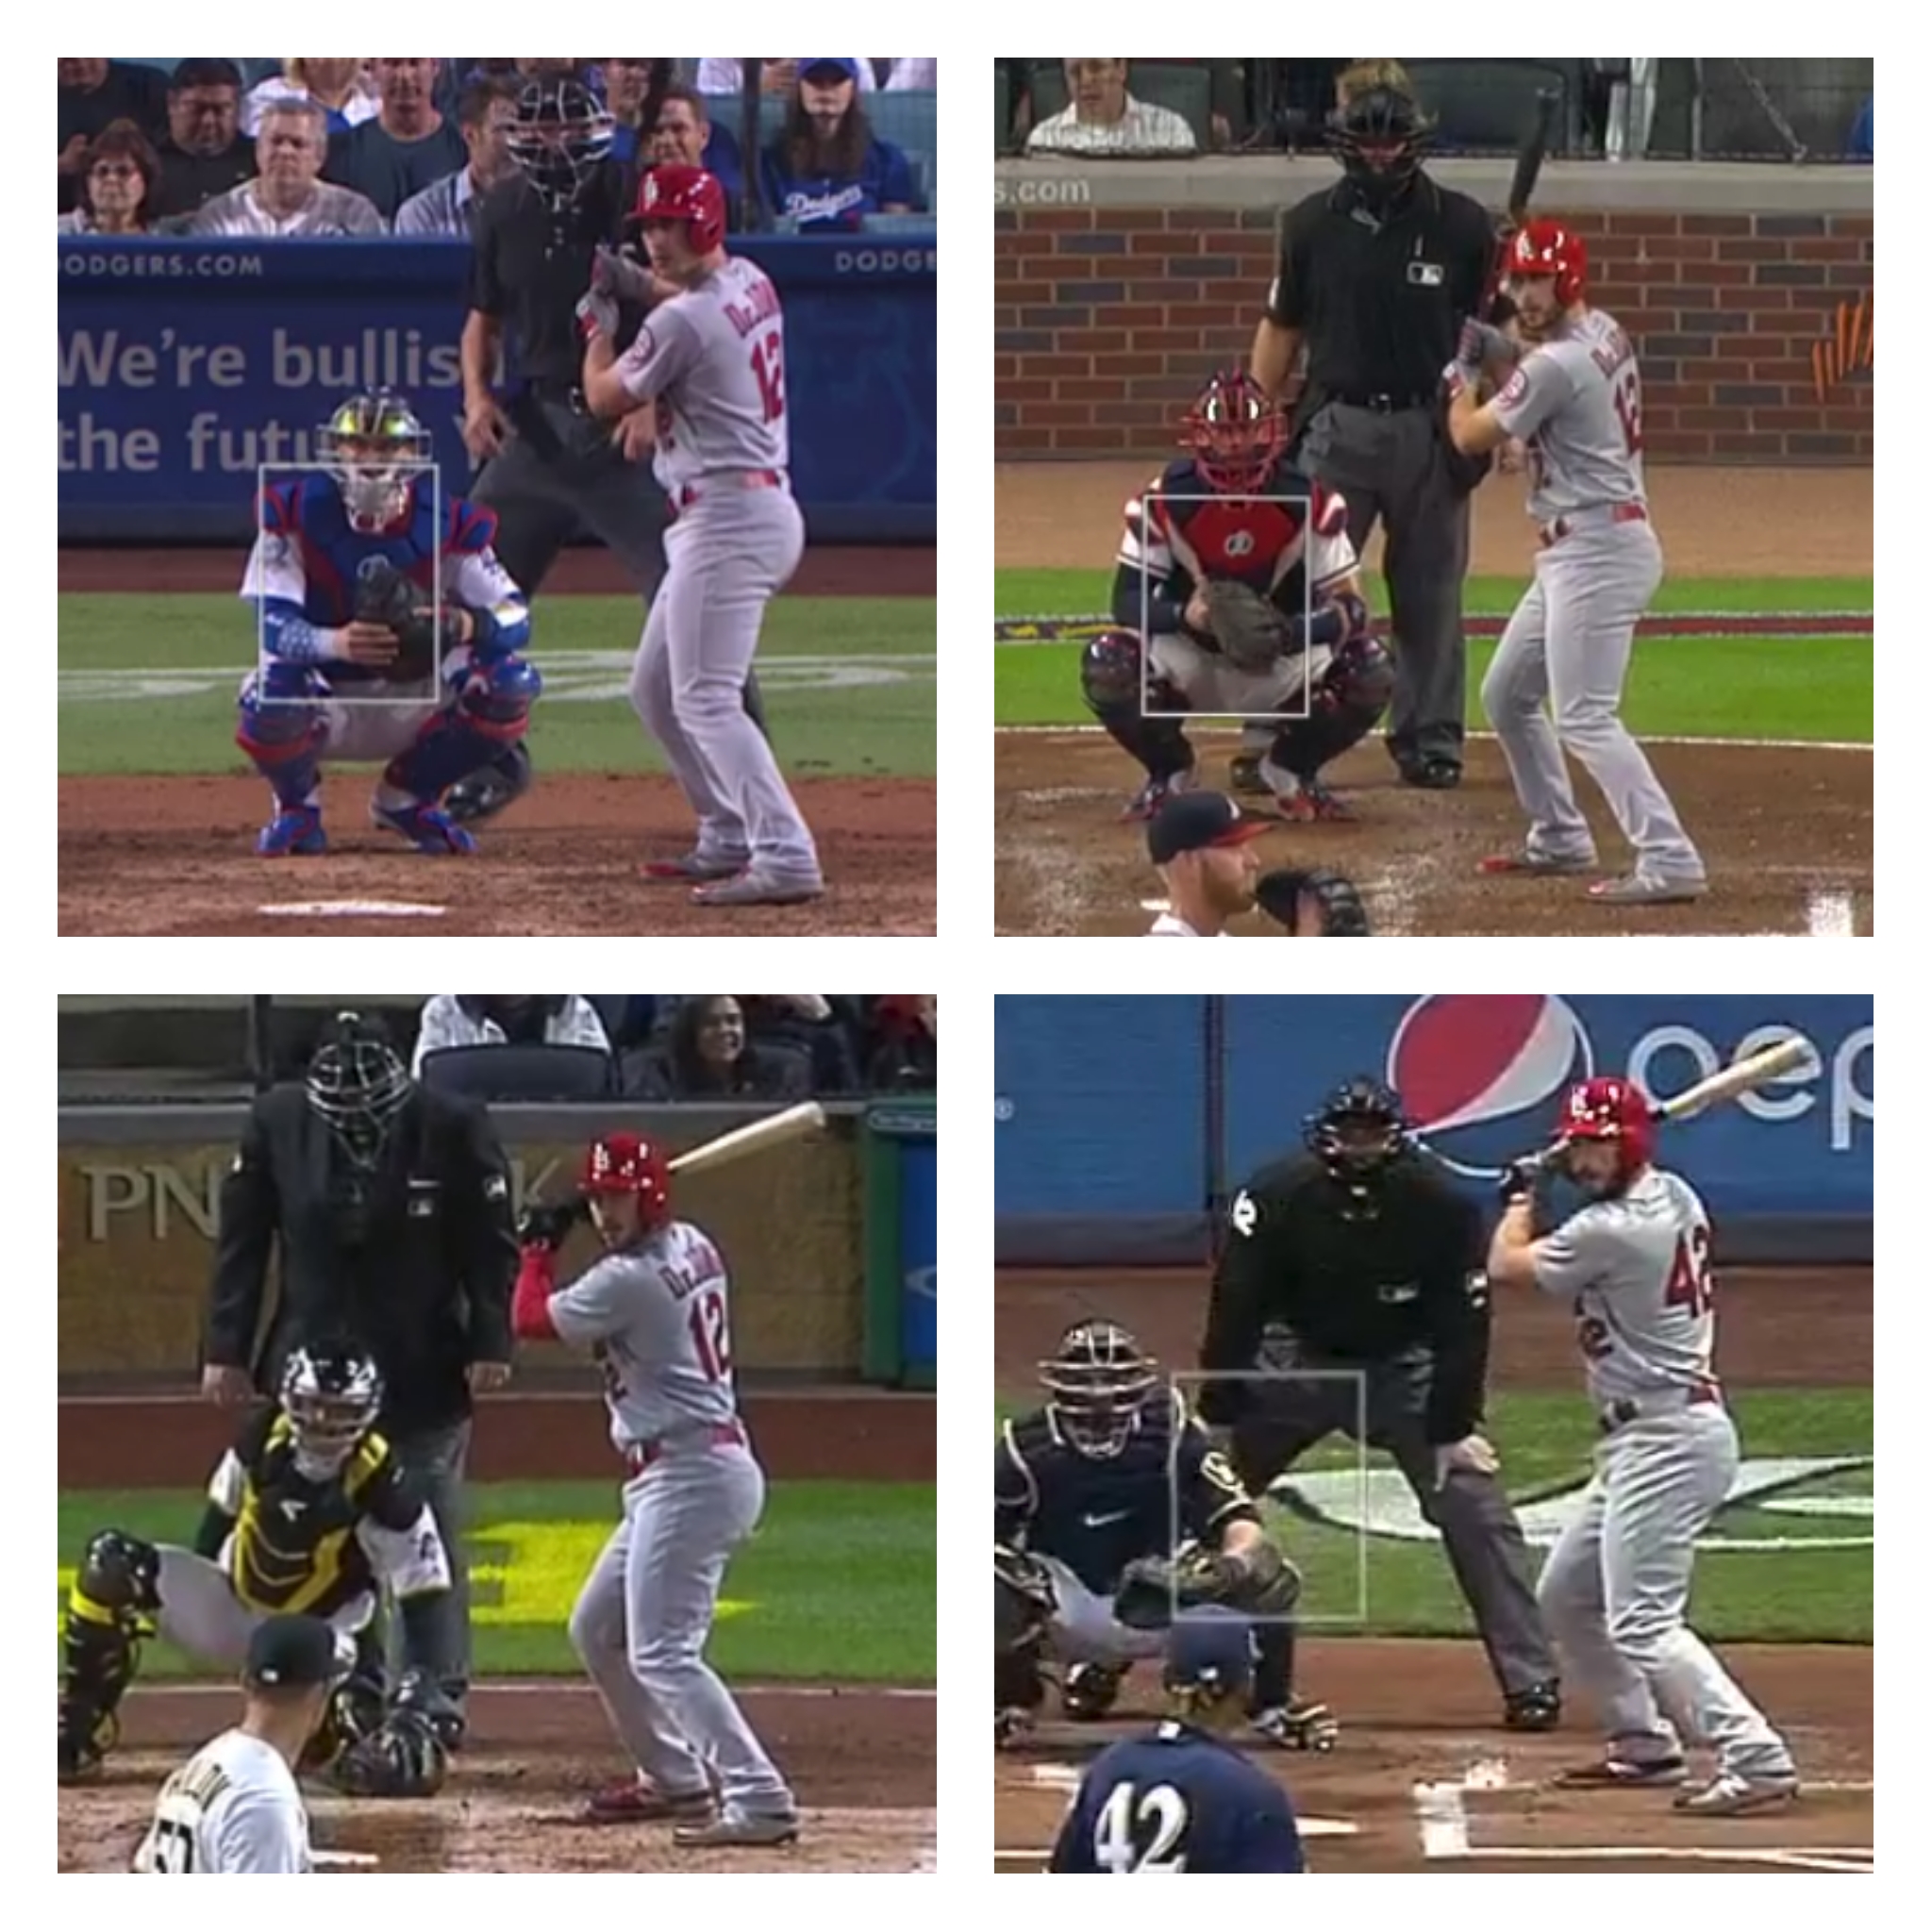
DeJong moves his bat as he gets ready to swing so the bat position isn’t really the key here. His elbow is more out closer to the plate while his hands are a little higher. It’s possible the change allows him to better hit inside pitches as he is certainly swinging at more pitches on the inner half of the plate than he did a year ago, as the graphs below show.
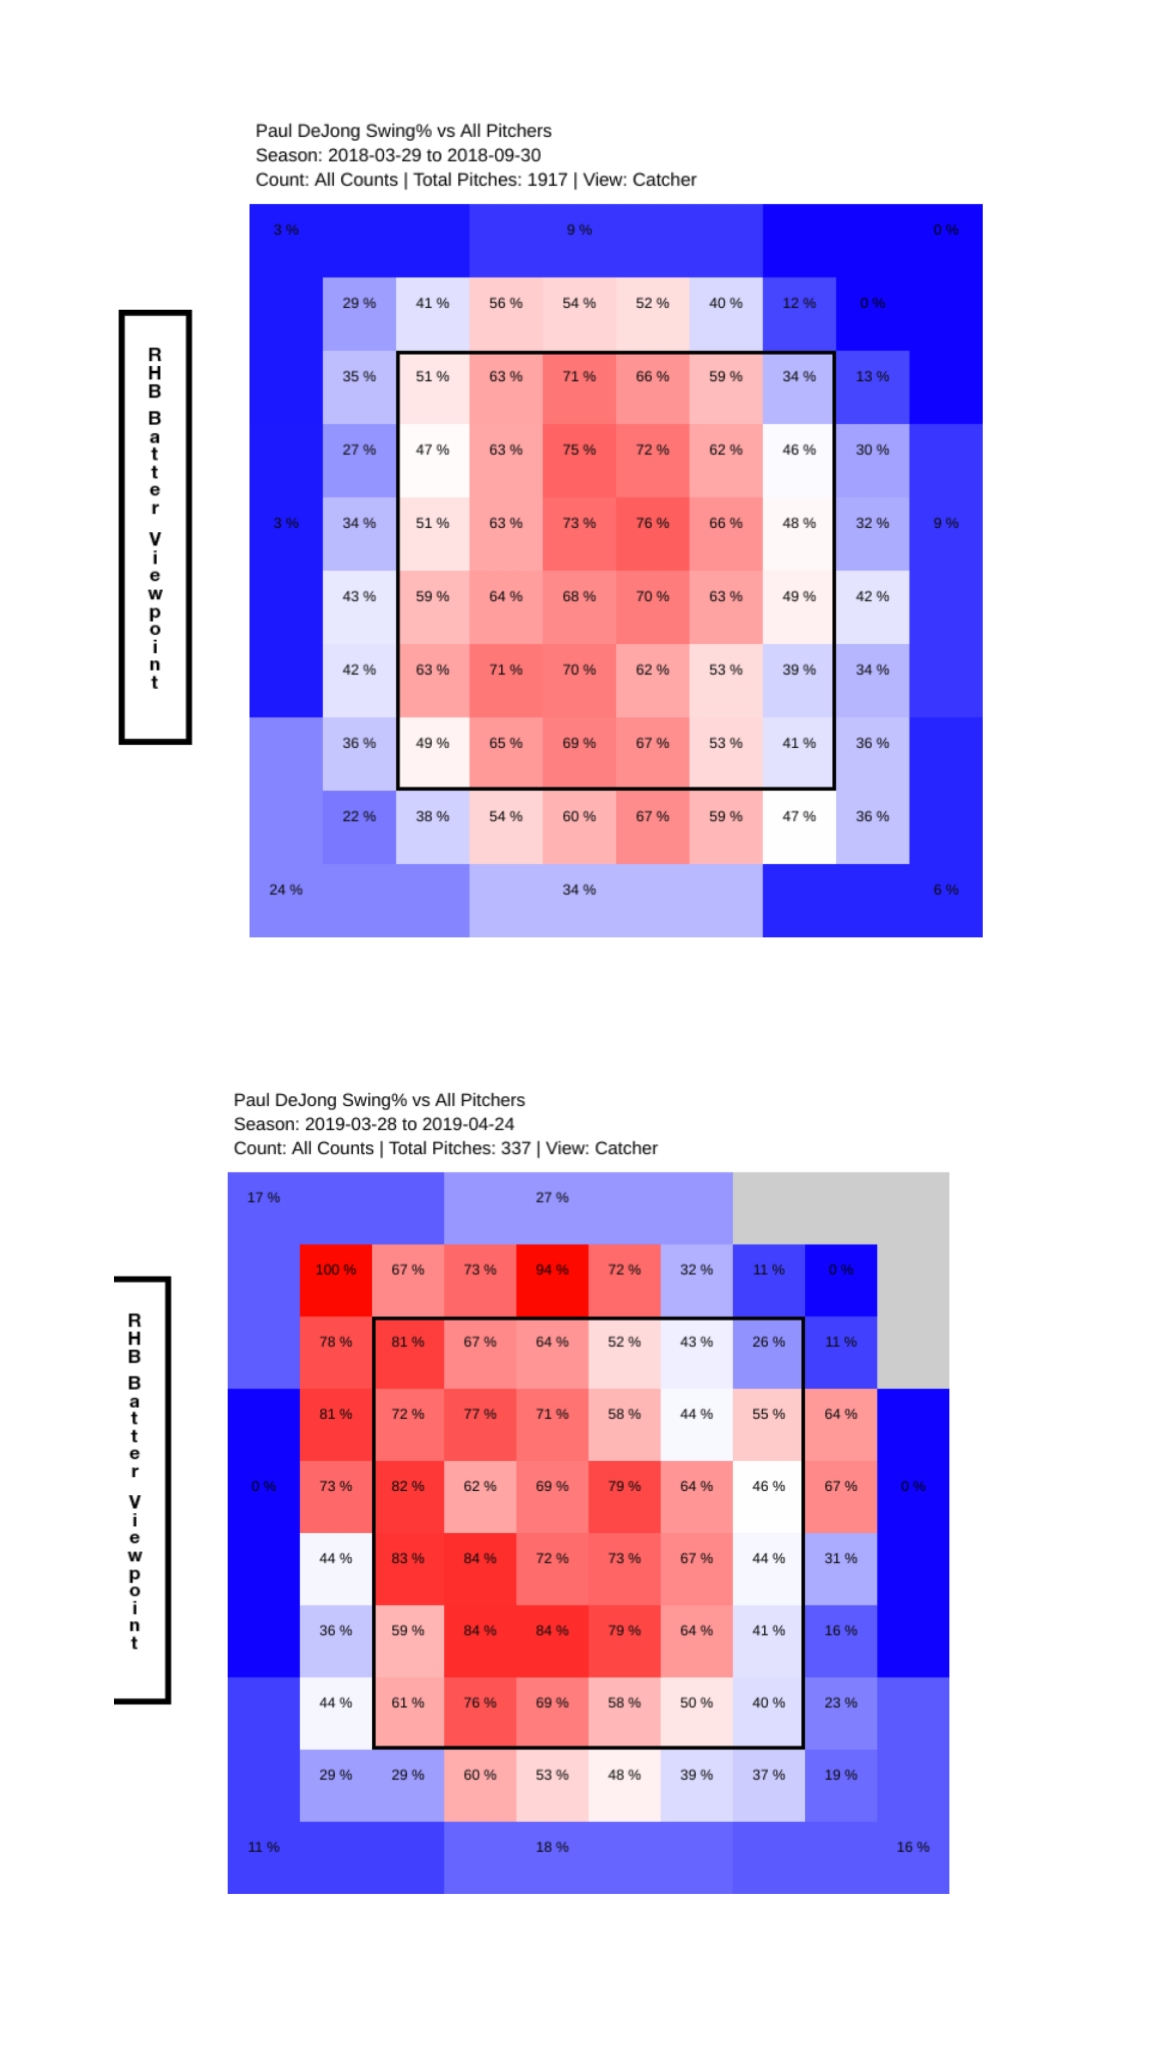
While where he is swinging is of some importance, when DeJong is swinging might carry greater weight. When we look at some of DeJong’s plate discipline numbers, the drop in strikeouts is slightly confusing. DeJong’s swinging strike rate is almost exactly where it was last season. He’s chasing roughly the same number of pitches out of the zone and he’s actually making less contact on those pitches when he does swing. What’s different, and we can sort of see it in the images above, is DeJong is swinging at more pitches in the strike zone. More contact is made on pitches in the zone leading to a lower strikeout rate. Avoiding strikeouts by not getting to two-strike counts is a bit of a galaxy-brain take, but that’s what DeJong is doing. He’s seeing a lot less pitches, which is going to keep his walk rate relatively low, but he’s getting to fewer two-strike counts, which is going to lead to fewer strikeouts.
| 2018 | 2019 | |
|---|---|---|
| P/PA | 3.9 | 3.6 |
| 2-Strike PA | 53.7% | 44.4% |
| Strikeout Rate | 25.1% | 17.6% |
Swinging more in the zone reduces strikeouts, but DeJong has used the count to optimize his swings and hit more good pitches. The table below shows how often DeJong swings in a handful of counts that might be considered hitter’s counts, as well as the first pitch of a plate appearance.
| 2018 Swing% | 2019 Swing% | |
|---|---|---|
| 0-0 | 16.0% | 23.1% |
| 1-0 | 40.9% | 46.8% |
| 2-0 | 50.7% | 68.8% |
| 2-1 | 62.1% | 68.4% |
| TOTAL | 31.1% | 48.6% |
Pitchers want to get ahead on the first pitch and they don’t want to get behind, 2-0, 3-0, or 3-1. DeJong was swinging at pitches where the pitcher really wants a strike about one-third of the time last season. This year, he has swung at those pitches 50% more often and he is doing a ton of damage, with three of his five homers coming in these counts. After getting eight hits on the first pitch of an at-bat all last year, DeJong already has seven this season. It’s possible this aggressive approach is helped by the philosophy of new hitting coach Jeff Albert, who was in the Astros organization when the club turned from one of the highest strikeout teams in the league from 2014 through 2016 into one of the lowest the last few years. David Laurila talked with Albert about his teaching philosophy and about using information to help batters, and he talked with Mike Claiborne at KMOX about using information to hit a hitter’s pitch back in March:
In theory, we want to get on base and take a strike and that sounds good. But if you have a question or a thought, you can really look at the information, the scouting report and figure out a more objective way if that might be the best way to go about it. If a guy has a wipeout breaking ball and he throws fastballs early in the count it might not be a great idea to let the fastball go by and get to the guy’s toughest pitch.
DeJong is being more aggressive in the strike zone, particularly on inside pitches and on pitches where the pitcher needs to get a strike. So far, that approach has paid off with lower strikeout rates without sacrificing any power. There’s reason to believe that Paul DeJong is responsible for the decrease in strikeouts and that it isn’t some random variation over the course of 100 plate appearances.
The Cardinals have been searching for a star player since the decline of Yadier Molina and Matt Holliday followed the departure of Albert Pujols. Matt Carpenter has been that player at times and the team acquired Paul Goldschmidt to help get them back to the playoffs, but both players are over 30 years old. If DeJong simply hits his career averages the rest of the season, he’s going to be a near six-win player at the end of the season. The Cardinals have had trouble developing a star for quite some time, but the unexpected development of Paul DeJong might make him the Cardinals best player, now and into the future.
Craig Edwards can be found on twitter @craigjedwards.
Just another Craig Edwards puff piece 🙂
Hey, I’m not complaining for the doubleheader. I just saw that the Middle infield is already worth 3.2 WAR for the Cardz.
Yes, we do need more time to sort the leaderboards out, but I have a soft spot for this time of year because someone is inevitably on a pace to break the home run record. Yelich and Bellinger are the guys this year. All we need is for them to keep whacking 40% of their fly balls for homers, and we’re set, which shouldn’t be a problem since (checks notes) not a single qualified batter has sustained a 40% HR/FB since 2000.
There is a criminal lack of Vlad Jr content on this website today. 🙁
Very interesting stuff.
DeJong’s 2-strike splits seem to reflect 3 distinct components of improvement this year:
— Fewer 2-strike counts overall, down about 10 percentage points from his prior average (from 54% to 44% of PAs).
— Fewer Ks once reaching 2 strikes, down about 9 points (from 49% to 40%).
— Absurdly better BAbip with 2 strikes, up from .313 to .520, driving an equally absurd .311 BA/.556 SLG/.910 OPS with 2 strikes.
Last year’s AL BAbip with 2 strikes was .290. (Using AL to weed out most pitchers.)
The highest season BAbip for a player with 200 PAs in this split was .468. (Using Baseball-Reference data since 1988.)
Last year, among the top 200 MLBers in 2-strike PAs:
— Highest BA was .300, and only 2 guys were above .267.
— The 28 guys with BAbip .350+ all had modest SLG of .422 or less, except Mookie Betts.
— Only Betts had an OPS over .805.
— Highest ISO was Betts’s .245, right where DeJong sits now.
In other words, DeJong’s current combination of 2-strike BAbip, BA and SLG are extremely improbable.
But yes, it’s good to have fewer 2-strike counts and to make more contact once there.
I meant to add that DeJong’s NON-2-strike results so far this year are much the same as his past results (up by an insignificant amount).
So his overall improvement this year pretty much all lies in his 2-strike data.
Actually, the biggest difference between 2018 and 2019 for DeJong is a healthy wrist. While he wasn’t this good, he also got off to a great start last year until he broke his wrist. Obviously, that injury was still affecting him after he returned from the DL, as his numbers were way down for the rest of the year compared to what they were before the injury.
The lower K rate without sacrificing power has probably helped him become even better, but it’s really not fair to compare his 2019 season to his entire 2018 season.
i[‘m shocked hes had the success hes had. would have never guessed. congrats to him.
One aspect that seems missing is “what pitch types is he swinging at more often?”
Is he jumping on the first hittable fastball he sees? Or just the first hittable pitch in favorable situations?
If he’s swinging at the first hood strike he sees, that may say something about his approach. If hes swinging at the first good fastball he sees, that says a lot about his approach.
Nice piece, Craig. I’m interested to see which hitters use this approach and what their results look like.