
Pete Alonso Crushes the Ball
Pete Alonso, it should first be said, really isn’t a great defender. The Mets were quick to let everyone know this throughout 2018, when they didn’t call him up early in the year, when he won Defensive Player of the Month for the Mets’ Triple-A affiliate in July, and when they didn’t make him a September call-up in a completely lost season for the big league club. Seventeen games into his major league career, however, I can say one thing with certainty: I don’t care that he’s supposedly bad at defense. Alonso’s plate appearances are turning into appointment viewing, because he flat-out crushes the ball. I’m not talking garden-variety “boy, that large man can hit,” either. Alonso might not have the best strike-zone recognition, or the best general plate discipline, but when he makes contact, he’s doing damage like almost no one else in baseball.
If you want to understand how truly incredible Alonso’s start has been, you need to look past the WAR leaderboards. Heck, you need to look past the wRC+ leaderboards — like I said, his plate discipline is a work in progress. Alonso has a near-200 wRC+ with a 31% strikeout rate — the three players at the top of the wRC+ leaderboard check in at 11.5%, 8.6%, and 15.0%, respectively. No, the magic really starts when Alonso puts the ball in play, and I do mean magic. Take a look at the top 10 players in baseball in terms of barrels (a Statcast designation that basically means a ball that is tremendously likely to be an extra-base hit) per batted ball:
| Player | Barrels/Batted Ball |
|---|---|
| Pete Alonso | 31.6% |
| Gary Sanchez | 31.3% |
| Joey Gallo | 29.6% |
| Mike Trout | 29.0% |
| Christian Walker | 25.0% |
| J.D. Davis | 23.3% |
| Franmil Reyes | 23.1% |
| Anthony Rendon | 22.9% |
| Willson Contreras | 21.4% |
| Jay Bruce | 21.1% |
Think of it this way: about a third of the time that Alonso puts the ball in play, he’s hitting an absolute rocket. Just being on this list, let alone at the top of it, tells us something. This isn’t a list of guys who have lucked into some game power. It’s not a list you can get on just by taking some walks, like a wRC+ leaderboard — Alex Bregman might have had a nice 2018 at the plate, but it’s hard to fake hitting the ball this hard and this optimally (Bregman ended 76th in barrels per batted ball last year). This isn’t just home run power, either, though it’s certainly that — Alonso has six homers already, including a 118.3-mph, 454-foot missile off of Jonny Venters that had SunTrust Park looking like a water hazard at the Masters:
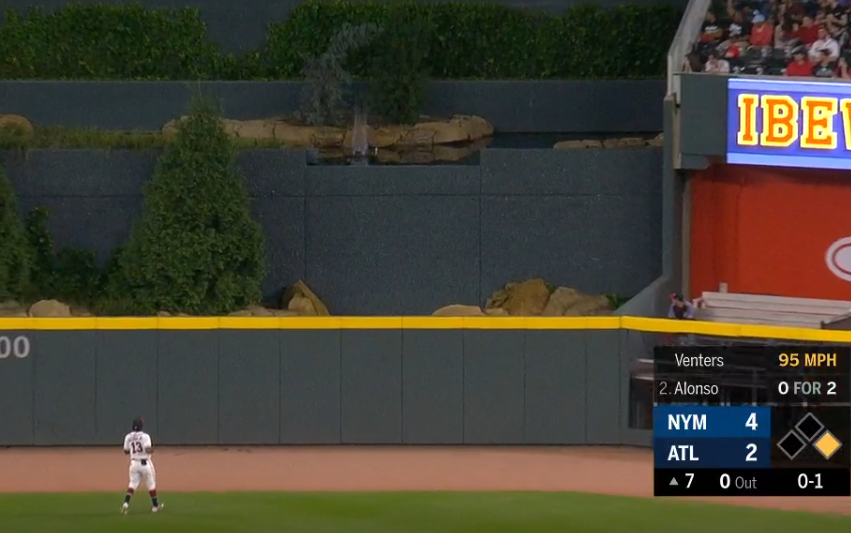
Merely looking at barrels doesn’t describe just how well Alonso is hitting the ball. Even his outrageous rate of barrels, after all, only covers about a third of the time he puts the ball in play. That undersells what Alonso is doing, because even when he doesn’t absolutely destroy the ball, he’s hitting the ball hard and at dangerous launch angles. When I look for players who are striking the ball with authority, I like to exclude ground balls from the calculation. Then I look at the average exit velocity they’re producing. Why exclude the ground balls? Well, a 115-mph rocket on a hop to shortstop might get you a single (or not — fielders are great these days!), but it’s hard to generate extra-base power on the ground. If you want to know who has a swing that will produce extra-base hits, look to the air:
| Name | EV (mph) |
|---|---|
| Cody Bellinger | 99.3 |
| Franmil Reyes | 98.1 |
| Pete Alonso | 97.6 |
| Yoan Moncada | 97.4 |
| Gary Sanchez | 97.1 |
| J.D. Martinez | 96.9 |
| Anthony Rendon | 96 |
| Paul Goldschmidt | 95.5 |
| Joc Pederson | 95.5 |
| Trey Mancini | 95.2 |
Cody Bellinger is having a great season so far, no doubt, and Franmil Reyes has undeniable pop, but there’s Alonso again, smashing baseballs into the stratosphere.
If you merely looked at Alonso’s batting line, you might be inclined to forecast some regression. He has a .424 BABIP, after all, and the highest BABIP since World War II (minimum 400 PA) is Reggie Jefferson’s .408 in 1996. I’m not here to tell you Alonso won’t regress — he probably will! I will say, though, that he’s deserved that BABIP so far. By looking at Statcast’s xBA statistic, which calculates the probability of a hit based on launch angle and exit velocity, and limiting it to only balls in play, we can calculate an xBABIP for everyone in baseball. It’s not perfect, but it’s a proxy for what you might expect someone’s BABIP to be if you stripped out the fielding luck part of it. This is an article about Pete Alonso, so you probably knew he’d do well, but jeez:
| Name | xBABIP |
|---|---|
| Aaron Judge | 0.455 |
| Nick Markakis | 0.446 |
| Domingo Santana | 0.442 |
| J.D. Davis | 0.441 |
| Niko Goodrum | 0.440 |
| Migeul Cabrera | 0.439 |
| Pete Alonso | 0.424 |
| Cody Bellinger | 0.424 |
| Jordy Mercer | 0.421 |
| Tyler Naquin | 0.417 |
Now, there are more luck-based components to BABIP other than just where the fielders are standing, but this isn’t some Wee Willie Keeler “hit ‘em where they ain’t”-style BABIP — Tim Anderson and his .500 BABIP with a .365 xBABIP can’t say the same. While Alonso’s BABIP is sure to come down as the season goes along, it hasn’t been a product of fluky hits so far. He isn’t directing ground-ball singles through gaps in the defense — he’s directing line drives through outfields.
When I mention line drives, I’m not doing it out of some idle authorial reference to a well-struck ball. I’m doing it because Alonso hits line drives, and lots of them. He’s hit an above-average amount this year, a probably-not-sustainable 28.2%. That home run off of Venters that turned center field into a golf course? That was a line drive, struck at a 17.7-degree launch angle. He also avoids ground balls like the plague, a skill he’s always had but has kicked into overdrive this season.
Another test I like to use to look for hitters maximizing their contact is to check for how frequently they avoid bad batted ball types. An infield pop-up, for example, is basically as good as a strikeout. A ground ball isn’t nearly that bad, but league-wide wOBA on ground balls is .225 in 2019. Fly balls check in at .474, and line drives are at a mouth-watering .662. If you want to look for the hitters who are putting the ball in play in a useful way, then it’s best to look at the percentage of good batted ball types they generate (line drives plus fly balls minus infield fly balls), and Alonso doesn’t disappoint here either:
| Player | Good Contact % |
|---|---|
| Jay Bruce | 83.4% |
| Jorge Polanco | 76.7% |
| Matt Carpenter | 74.5% |
| Pete Alonso | 74.4% |
| Christin Stewart | 73.7% |
| Michael Conforto | 72.0% |
| Xander Bogaerts | 70.8% |
| Jeimer Candelario | 70.8% |
| Cody Bellinger | 70.7% |
| Niko Goodrum | 69.7% |
This table and the exit velocity on balls in the air from earlier in the article encapsulate what’s great about Alonso. He’s one of the best in baseball at putting the ball in the air without popping up. He’s also one of the best in baseball at hitting balls in the air extremely hard. Those things go together as well as you’d expect. Alonso also has the fifth-highest xwOBA on contact in baseball this year, behind noted extremely large humans Joey Gallo, Gary Sanchez, Aaron Judge, and Cody Bellinger. That would be impressive for anybody, but it’s particularly impressive for a rookie who’s faced Max Scherzer, Patrick Corbin, and Stephen Strasburg twice each in his first seventeen games.
At this point, you should have no doubt that Pete Alonso hits the ball phenomenally hard when he hits it. Thus far in his career, that “when he hits it” looks to be the only thing holding him back. Alonso’s raw strikeout and walk numbers aren’t pretty (31% strikeouts and only 12.7% walks is not a good look). Per an equivalence formula I outlined last year, Alonso would need to produce contact 10% better than league average just to be a league-average hitter overall. He’s vastly outstripping that so far, but it’s still a bad base to start from.
It’s early in the season to trust strikeout and walk rates. Even if you look at more granular data, however, Alonso has some work to do. So far this year, he’s swung at 32.3% of pitches outside of the strike zone versus a league average of 29.1%. At the same time, he’s only swung at 63.9% of pitches in the zone, where league average is 66.8%. This combination of swinging more frequently than average at balls and less frequently than average at strikes is, as you might assume, bad.
Not only that, but Alonso makes less contact than league average when he swings — 71% against an average of 75.7%. Among qualified batters last year, only four batters met those three criteria, and they combined to average 25% strikeouts and 8.4% walks. While there are some encouraging names there (Giancarlo Stanton feels like an apt comparison), it’s definitely not a place you want to be. The mere fact that so few batters combined these traits (four out of 140 who qualified) suggests that it’s hard to get enough playing time to qualify when hitting like that.
The two parts of this article are the Pete Alonso experience in a nutshell. The quality of contact isn’t the question — when Alonso hits something, it goes a long way. The question is always going to be whether he can make enough contact to tap into his tremendous raw power. The early returns are promising, but they’re also confusing. Alonso can hit — not that there were many questions about that before — but he’s been a pure manifestation of 80-grade power this year. He’s also struck out 30% of the time, which is, you know, not great.
Will the strikeouts hold him back? Will he be the next Joey Gallo, comic-book strong but held back by a video-game strikeout rate? Only time will tell. There’s good news on one front, however. Despite his defensive shortcomings and the handicap of playing first base, Alonso has put up 1 WAR already. He’s the Mets’ most valuable player by both fWAR and bWAR. It looks like the defense wasn’t bad enough to hold him back from the majors after all.
Ben is a writer at FanGraphs. He can be found on Bluesky @benclemens.
Alonso is an elite power hitter and will regularly hit 40 bombs, I think he can become a Khris davis or Nelson cruz caliber power hitter.
However he is not going to hit 300+ with a 25+% K rate, his babip is currently 430.
I don’t think he will remain at 31% Ks but 26-28 is probably realistic and then he probably is a 260/350/500 hitter with 35+ homers which is great.
But don’t fall for the “he hits the ball so hard that he beats the BABIP and hits 300 despite a high 20s K rate”. We fell for this already a few times for example when sano had his hot streak couple years ago or even judge.
And it is not about deserving either. Sano also had a 400 xBABIP but it still isn’t sustainable, maybe the pitcher finds a little hole or the player just regresses a little in his skill. Nobody sustains a 400 babip even if his xstats say he deserves it for a couple months.
Here is the “sano defies the babip odds with otherworldly contact quality” article
https://community.fangraphs.com/miguel-sano-is-the-three-true-outcomes-hitter-weve-been-waiting-for/
Yeah I definitely agree with the sentiment that he’s not going to sustain these xBABIP numbers. Looking at full-season 2018, only two players were even above .380 xBABIP (Yelich and Pham). No one sustains most of the stats Alonso is putting up- only Gallo and Judge have ever had higher EV’s on air balls over a full season. It’s still incredibly impressive that he has ‘deserved’ his results so far though. There aren’t that many players capable of hot streaks like this, basically, which I think says something about his true talent level.
Yeah the EV is rare. The list of guys who even hit only two balls at 115+ isn’t all that long. But I think his babip will regrees especially when teams start to get batted ball tendencies.
There is no doubt that his BABIP is going to tumble. In the divisional era since 1969, there have only been 3 qualified seasons over .400 – 1977 Rod Carew, 2002 Jose Hernandez and 2000 ManRam – and Carew is the only player to maintain a BABIP over .360 over 2000+ PA since then.
That said, Aaron Judge is on year 3 of maintaining a BABIP over .360. Now Alonso isn’t as fast as Judge so he might lose a few hits that way, but if he keeps hitting the ball the way he has, there is no reason he couldn’t maintain a BABIP north of .340.
Quick tangent on context …
Overall BAbip in recent years is the highest it’s been since the mid-1930s.
— From 1940 through 1992, the 5-year BAbip never got as high as .286.
— Since the start of the PED era, 5-year BAbip has been at least .295.
— BAbip for the previous 5 years was .299.
There are 25 guys who debuted since WWII with at least a .343 BAbip and 1,500 PAs. Fifteen of them have played this year, and three more entirely within the past 10 years.
Alonso’s BAbip will surely tumble, but I don’t think we’re far enough into this particular era of MLB to have a good idea of upper bounds for individuals.
Babip certainly went up over the years but the last 20 years it was pretty stagnant. Power increased but so did defensive positioning due to analytics.
I think he hits closer to 40+ HRs than 30+ HRs, and ultimately finishes with a BA closer to .280-.290 then .260, but I do agree that he’s unlikely to finish the season with a .300 BA as a rookie.
Also very interesting to see J.D. Davis on a few of those leaderboards. This Mets team has made a few very shrewd moves over the offseason.
Also, those people who wanted to give up on Gary Sanchez are idiots. His health will probably hold him back, but he has a ceiling on par with Mike Piazza.
Oh yeah. Sanchez just oozes potential, and even if he never taps into it fully, just getting a piece of it would be incredible from a catcher. This is a guy you give a LOT of chances to at literally every other position. But catcher? Yes, just let the kid play.
Hoo boy, I’m a Gary fan, but that’s some lofty comparison. Gary crushes, but his contact skills (or lack thereof) seem to eliminate that kind of ceiling as a realistic possibility. In Gary’s monster 2017, he ran a 129 wRC+. Piazza had 10 straight seasons above that (often substantially above that) from 1993-2002.
I should have been more careful. This is likely true; the contact is not on the same level as Piazza. Let me clarify.
I do think that if he stays healthy enough (which I am getting less optimistic about) he’s going to put up Piazza-level power numbers–quite frequently landing in the 40 homer range. But his OBP is probably going to be 50 points lower. I’m thinking more in the range of Piazza’s 1999 as his standard (which is similar to what Sanchez did in 2017), but occasionally reaching back for even more.
There will NEVER be another Mike Piazza. You find a catcher that hits like Piazza and he will be converted to another position to play 155 games a year.
I had a feeling that JD Davis had potential when they traded for him. Granted, his track record in Houston was abysmal, but he was still young and crushing the ball in AAA.
The thing that is doing him in right now is that his defense is very sub-par. However, I loathe the day that Frazier comes back because I know that the Mets have $9M reasons to put him into the lineup.
I also don’t understand the Lowrie signing because his primary position is 2B, and at the time of the signing you had Cano and McNeil who could both play that position. Assuming McNeil was 1st on the depth chart for 3B, then if Cano goes down or needs a rest you slide McNeil to 2B and put JD Davis at 3B.
Jordy Mercer among leaders in xBABIP is what has me shook from this article.
There’s something to be said about a guy who has so much power and who makes such good contact that the strikeouts don’t matter as much. This makes him a bit different from a guy like Judge, who is the 80-iest 80-grade raw power out there, who literally just has to make enough contact to be a star (“quality” of contact doesn’t matter quite so much; although he did have a top-of-the-line barrel % last year, but I suspect that’s because literally every ball he hits is crushing the ball). And it separates him from Gallo, who is a 3-true-outcomes monster with a low BABIP.
I like these guys with 80-grade power on a personal level, because despite the superficial similarities of their batting lines, they’re really kind of different under the surface. Stanton, Franmil Reyes, and Khris Davis have their own little weird quirks too. It’s kind of the reverse of the “unhappy families are all unhappy in their own way” quote; 80-grade raw power gives you the ability to succeed despite serious flaws.
Also, I just want to give a big thumbs up to Ben for this article (among several other great articles recently). There isn’t a whole lot we can learn from the top-line stats this early in the season, but Statcast data, pitch mix, swing changes, plate discipline, etc…those things are a lot more interesting this early. Many of them won’t hold either, but they’ve got a better shot. And even better, they’re the kinds of things that you don’t get from looking at the FG leaderboard.
A lot of his babip will also depend on his pull rate. Pulling helps power but is negatively correlated with babip. Hitting the ball hard helps babip but if you have a very polarized batted ball profile mlb defenses will make you pay. Many hard hitting pull hitters had high babips in the minors because they just hammered the balls through the fielders but in mlb they are analysing you and putting the shift on which they don’t do much in the minors because it is not about winning but player development.
Schwarber is a good example, mid 300s in the minors, 270s in the majors.
Alonso isn’t a pure pull guy like bautista (who always had low babips) but last year in AAA he pulled way more than he does now and also had a sub 300 babip.
If he can continue to hit the ball that hard and maintain such a high up the middle percentage he probably can sustain a babip well over 300.
But if he goes back to pulling the ball 45+% teams will probably eat some of his babip away with the shift.
“extremely large humans Joey Gallo, Gary Sanchez, Aaron Judge, and Cody Bellinger…HEY!”
-Gary Sanchez-
Watching Alonso stretch and dig out bad throws from his fellow infielders, he plays a very acceptable 1B. Save the “style points” criticisms for ballet, he gets the job done.
A couple years ago there was an article stating that only like 10% of a first baseman’s defensive value is catching a ball and scooping bad throws, most of it is fielding and especially range. Hosmer is great at scooping but still not a great defender because his range isn’t great.
Good column! I have a sincere question about this statement:
“31% strikeouts and only 12.7% walks is not a good look”
What do we know about the relationship between K% and BB% that would make an otherwise good BB% into a point of concern?
I’ve never really studied this question, but here’s a very rough go at it:
I took the top 200 batters by most total PAs since the start of 2015 (all at least 1,383 PAs).
For each, I calculated his K%, BB%, and K/BB ratio.
Then I made groups based on each of those rates, grouping by highest-50, middle-100, and lowest-50.
And I took the unweighted average OPS+ of each group.
The results:
Grouped by K%
106.4 OPS+ for highest 50
108.4 for middle 100
106.5 for lowest 50
Grouped by BB%
119.9 OPS+ for highest 50
106.9 for middle 100
95.9 for lowest 50
Grouped by K/BB ratio
95.5 OPS+ for highest 50
108.6 for middle 100
117.1 for lowest 50
By this rough thumbnail, K% alone doesn’t tell much; I know I’ve “selected out” those who whiffed too much to keep a regular job, but that’s not close to an issue for Alonso.
BB% and K/BB both say a lot — but for Alonso, they tell different stories.
Alonso’s BB% of 12.7% would rank top-20, a very good indicator for his OPS+.
His K/BB ratio of 2.44 would fall well within the middle of this pack (91st); the top 50 are all well over 3 K/BB.
Even with the obvious limitations of my study, it doesn’t suggest that Alonso’s K/BB _ratio_ is anything like a problem. His walk rate is good, and that shouldn’t have to be qualified in terms of his K%. I’d love to hear other views on this.
Is it a factor that as far as OPS+ is concerned a strikeout is the same as a ground out?
OPS+ doesn’t care if you have 100 SO and 100 GB outs or 50 SO and 150 GB outs. But OPS+ does positively value BB, so the two buckets that include BB as a factor show something more because more BB means something in OPS+?
Yeah so, this is a really tough question actually. There are a lot of confounding variables (when I’ve investigated this in the past, strikeout rate and OPS+ have been marginally positively correlated even because power is good but correlated with whiffs).
I have noodled around with a formula that basically works out how good your contact needs to be given the amount and type of non-contact outcomes you have- one way to think of it is that at a K/BB ratio of 2.44:1, your non-contact results are a bad wOBA- this year’s walk wOBA factor is .693, so .693/3.44= .201 wOBA. Therefore, ratio isn’t enough- you also need to know what percentage of the time you aren’t putting the ball into play.
Imagine Pete Alonso with 1% walks and 2.44% strikeouts- he’d basically be the best hitter ever because he does so much damage on contact and that’s a lot of contact. At 29% walks and 71% strikeouts he’d obviously be unplayable. Given that Alonso’s wOBA on contact is really high, the worrisome thing is that about half of his plate appearances don’t end with the ball in play.
That’s essentially the concern I have with his numbers- while it’s definitely true that power hitters can strike out more and be fine, Alonso just has so many plate appearances end without putting the ball in play, and at a ratio that favors pitchers, that he’s starting out behind. He makes up for it by clobbering the ball, it’s just a hard profile to make work for a consistent period of time.
Here’s one way to look at it- if you combined his strikeout and walk numbers with J.D. Martinez’s league-best .535 wOBA on contact last year, you’d get a .389 wOBA, which is excellent but miles lower than what you hope for given how hard he hits the ball. That’s even assuming he has the actual best contact quality in the majors- if you think he was merely MVP Christian Yelich in terms of contact quality, that’s around a .370 wOBA.
I wrote a little about this last year (linked in the article) and came up with the idea of indexing required contact quality to league average- if you had league-average plate discipline and put the ball in play a league-average amount of time you’d have a NOC+ of 100. Mike Trout’s last year was 129.6- he could have contact quality 29.6% worse than average and still be a league-average hitter. Alonso’s this year is around 90- he is starting off at a huge deficit in terms of being a truly elite hitter. That’s basically the issue with the strikeouts- not so much that they are high as that they limit his ceiling.
K/BB is pretty useless, you have to use K%-BB% which is one of the best predictors of pitching success, for hitters of course it is not as easy because the power component is added while pitchers face a good mix of different power guys so it should cancel each other out.
K-BB works for hitters too but you have to consider power too.
With k-bb it doesn’t matter
If you are at 15-10 or 10-5 because as I wrote below the linear weights are pretty similar. The notion that a K is not worse than a groundout is correct but of course a K could also have turned into a double or homer so a k doesn’t just replace a random groundout but the whole range of outcomes. Because of that it is not quite correct to compare that value of a K with an out in play, you have to compare it with the value of a ball in play which can turn into anything from a double play (worse than a K) to a homer (of course way better than a K).
More Ks simply mean you have to produce the same in less chances since a k can’t turn into anything.
Thanks for the input!
Thanks for the in-depth reply!
You are welcome if you meant my reply:)
I did, Dom. 🙂
I found it is almost a direct linear relationship between k, bb and power
https://community.fangraphs.com/introducing-k-bb-iso/
A k and a bb almost have the same value, a bb is slightly worth more though. I think linear weights are k=-.28 and bb=+.31 or so. Because of this K-BB works so well for pitchers, it is not quite perfect but almost.
Going by k-bb he is at 18% which is somewhat worse than the league average of around 13%.
However there of course is a third component which is power and Alonso obviously is great at that.
K rate does correlate well with performance but only if you normalize for bb and iso. The reason why low k rate doesn’t correlate with success is a selection bias: high K hitters without power don’t make the majors while some low k guys without power do make the majors. If you normalize for walks and power there is a strong positive effect of K avoidance but in practice you don’t always get the full package.
The very best mlb players mostly have single digit K-bb rates whether it is 20/15 guys like trout or 13/8 guys like altuve but there are a few exceptions.
“Lucked into some game power” is a weird phrase given that the whole thing with the Ramirez/Hoskins/Bregman types is that they have elite contact skills that let them get as much as possible out of their average raw power. I guess they’re lucky to be playing today and not 30 years ago, but the skill’s very much there.
Is there a leaderboard on fangraphs / another source for xBABIP. Baseball Savant has a leaderboard for xwoba but not xBABIP from what I can tell. Thanks!
There is not. I just use the Baseball Savant bespoke search and input the correct query manually. It’s a bit of a pain but hey, somebody’s gotta do it.
I think the small sample period for writing articles is over by now and can confidently say that Ben Clemens is just Jeff Sullivan getting around his allegiance to the Rays
The Frananimal has gotten so unlucky to start this season. When you couple that with above average contact ability, he should be an absolute monster.