
Pitchers Plan, and Mike Trout Laughs
Imagine being a pitcher who has to face the Angels this year. It’s not hard to figure out which batter you most need to prepare for. When the Angels played the Cubs last night, Albert Pujols batted third, which is a lot less imposing in 2019 than it was in 2008. Shohei Ohtani had the night off, which meant that Tommy La Stella was the best non-Trout bat in the lineup. He’s having a good year, as Jay Jaffe noted, but unfortunately for him, he’s still Tommy La Stella. Cesar Puello batted fifth, and hey, good for him. Still, though — the scouting report was probably just Mike Trout written in various fonts over and over again.
It’s safe to say that every game the Angels play, the opposing team has spent a lot of time trying to work out a way to get Trout out. Los Angeles has a robust 109 wRC+ this year among non-pitchers, which sounds good until you realize that non-Trout Angels have a 100 wRC+. The team is scuffling — two games below .500 in a division where you might need 100 wins to topple the Astros, and potentially a little lucky to be there given their BaseRuns record. The pitching staff is essentially made of duct tape and fervent prayers — Ty Buttrey leads the staff in both fWAR and RA/9 WAR, and their starting rotation looks like a horror story told to kids to keep them from becoming Angels fans.
Amidst this chaos, this unending deluge of mediocrity, Mike Trout is putting together another masterpiece of a season. It’s boring to say, almost — his 180 wRC+ is both the fourth-highest in baseball and the lowest Trout has recorded in the last three years. Being one of the best players in baseball is old hat for him. Still, he’s improving his craft incrementally, slowly shoring up weaknesses and adding to strengths. His unintentional walk rate, a gaudy 19%, is the highest of his career. His strikeout rate, a minuscule 16%, has never been lower. Trout’s 2019 might be the best he’s ever hit, a crazy thing to say about undoubtedly the best player in baseball.
Baseball is largely a game of failure and limitations, which makes talking about Trout’s plate discipline feel somewhat surreal. Consider this — Trout has started making contact with basically everything he swings at in the strike zone. His zone contact rate of 94.9% is sixth in baseball and the highest of his career. That’s strange, because for the most part, guys who make contact with everything are contact hitters who sacrifice power to put the ball in play. David Fletcher and his .137 ISO top the list.
This makes a rough kind of sense — hitting everything you swing at in the strike zone means you are probably putting some tough pitches in play, and cutting down on your swing to make more contact means those swings generally have less behind them. That, at least, is the logic that constrains mortals. Mike Trout started hitting everything in the strike zone, and he’s still slugging .600. That slugging percentage might be selling Trout short — he has the highest xSLG (a Baseball Savant statistic that predicts slugging percentage from angle and speed of hits) of his career, a gaudy .643.
What does making contact with every pitch in the strike zone look like? Well, in 2018, Trout was great, but he was great while being only very good against high and outside pitches. Take a look at the upper righthand corner of this chart, the percentage of swings he made contact on by zone in 2018:
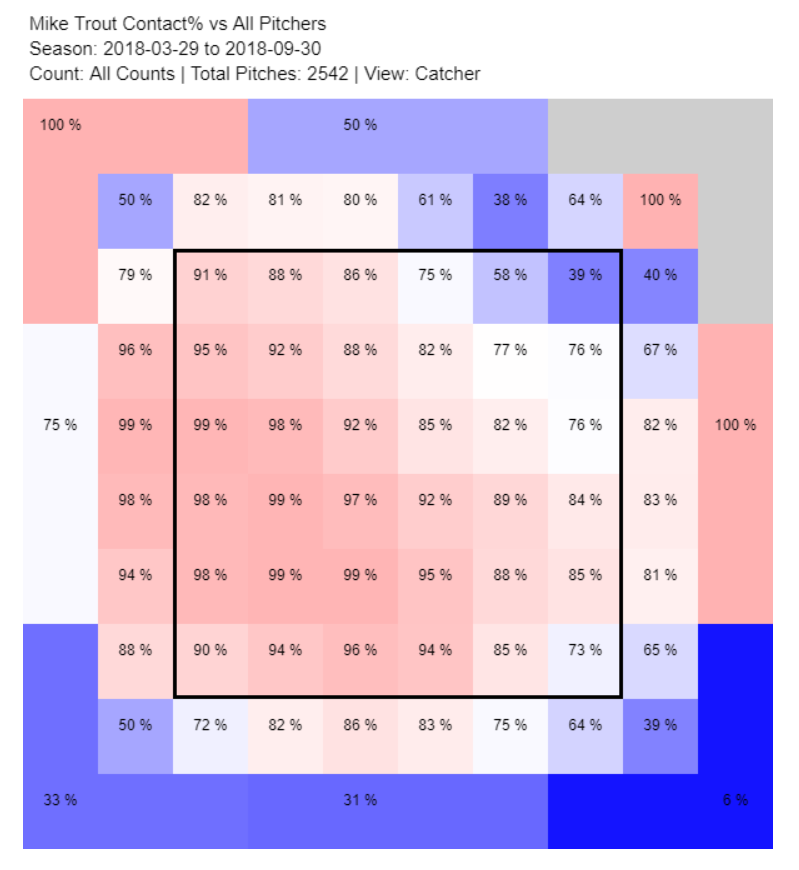
Pitchers know about this marginal weakness, and they do their best to exploit it. The book on Trout is to get him high and away. Take a look at where pitchers are attacking him in 2019:
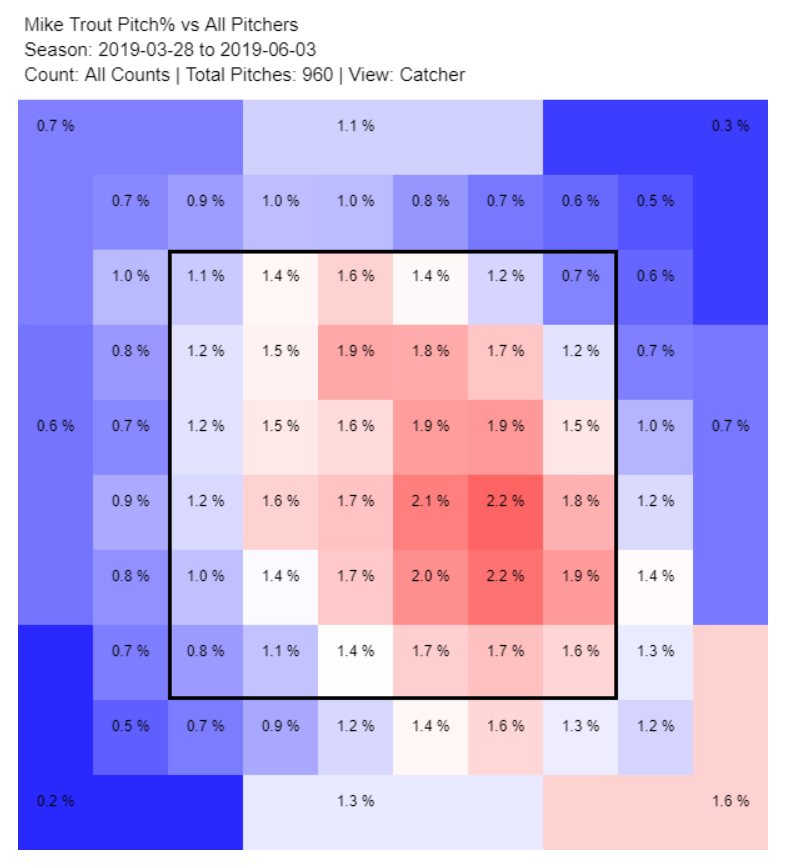
That’s good pitching right there. Find out where a hitter is most likely to get bad results, and aim for that spot. Maybe their focal point is a little too low, but the general idea of throwing away is certainly easy to see. Major league pitchers are tremendously skilled, and they spend countless hours perfecting their craft. That should work out to their advantage, right? Well, bad news, pitchers — this is Mike Trout we’re talking about here. Look at his contact rate in 2019:
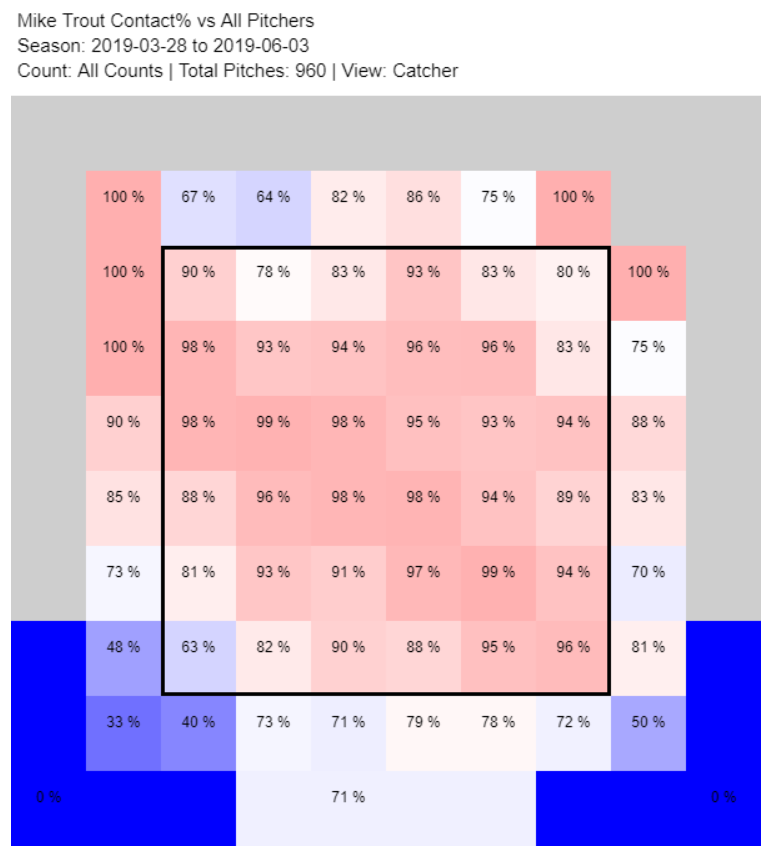
It would be one thing to protect a weak point in your swing with some defensive hacks. Plenty of good hitters punch outside pitches the other way, sacrificing power for contact on pitches that are hard to drive. Again, though, Mike Trout isn’t “plenty of good hitters.” He’s the best hitter in baseball. Trout is punishing outside and high pitches in 2019, doing a tremendous amount of damage when he puts the ball in play:
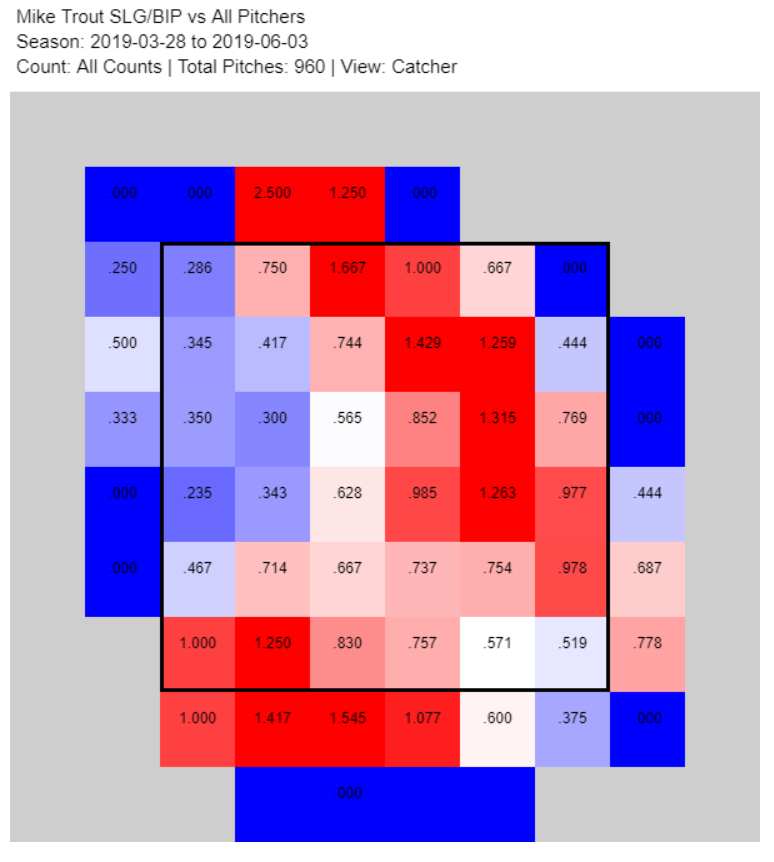
You’re reading this chart right — Trout is now getting his greatest production on balls in play in the very part of the strike zone where pitchers are attacking him most. That, in a nutshell, is what pitching to Trout is like. You might think you’re attacking a weakness, doing your research to put yourself in an advantageous position. Trout’s better at adapting than you are; he’s better than everyone. He reacts to your changes faster than he can be solved.
Pitch location isn’t the only part of Trout’s plate discipline pitchers have focused on this year. They’ve changed how they attack him on the first pitch of a plate appearance, and Trout is yet again using that to his advantage. For years, the book on Trout was that he was patient on the first pitch to the point of somnolence; he basically never swung at first-pitch breaking balls, for instance. Over the past few years, Trout has turned this trend around, becoming increasingly aggressive on the first pitch — he swung at 19.7% of first pitches in 2017 and 18.3% in 2018, the two highest rates of his career.
To combat this trend, pitchers are going out of the zone on first pitches more than they ever have. Trout is seeing strikes on 47% of first pitches, down from his career average of 55% and below the major league average of 51%. This adjustment was largely out of self-preservation. Trout slugged 1.061 with a .485 batting average when he put the first pitch into play last year. He hit five home runs on first pitches, a career high. Sticking with get-me-over first pitch fastballs was no longer an option.
In classic Trout fashion, though, he’s turned pitchers’ adjustments into another tool in his tool belt. Now that pitchers throw him fewer first-pitch strikes, he’s simply swinging less. He’s down to a 17% swing rate on first pitches this year while still swinging at 27% of pitches in the zone. He’s also missing less — he’s swung and missed at five first pitches this year, a 2% rate that would be his lowest since 2015, the last year of his extreme passivity on first pitches. Between this improved swing discipline and pitchers avoiding the zone like the plague, Trout is falling behind in the count 52.9% of the time this year, a career low and 5.2% below last year’s level.
2019 is arguably Mike Trout’s finest batting season so far. His xwOBA of .473 is the highest it’s ever been and 30 points higher than his wOBA, suggesting that he’s been unlucky this year to put up “only” a 180 wRC+, the third-highest of his career. He has the highest walk rate in baseball and a strikeout rate in the lowest 21% of qualified batters. He’s getting on base at the highest rate in his career despite the lowest BABIP in his career (excluding his brief 2011). The two changes pitchers have made to how they approach him this year sure don’t seem to have worked.
Pitchers will try to make other adjustments. They’ll start challenging him in the strike zone more on the first pitch — maybe with offspeed pitches, something that pitchers mostly haven’t tried yet. They’ll aim inside, where Trout’s power is down this year. They’ll continue to hunt holes in his game, small edges that they can use to blunt Trout’s effectiveness.
But until I see some evidence to the contrary, I don’t think it will matter. Pitchers can adjust all they want, try any gambit they’d like. For the most part, it seems like adjusting to beat Trout only plays into his hands. Someday, Mike Trout will grow old. He’ll slow down, get worse at recognizing pitches, stop instilling terror into opposing pitchers the way he does now. That day still feels infinitely far off, though. For now, he’s three steps ahead, putting up unreal numbers while shrugging off regression. Pitchers can plan all they want. Trout won’t stop laughing his way around the bases any time soon.
Ben is a writer at FanGraphs. He can be found on Bluesky @benclemens.
Learning new things to love about Mike Trout is like learning new things to love about an old partner 🙂 It also made me think: what would the pitcher equivalent of Mike Trout be?
Koufax?
Greg Maddux maybe?
I think the understanding, adaptability, and intellect are there … but Trout can also be simply overpowering. I think Peak Pedro (below) might be closer, right? Maddux was (amazingly) many things … but overpowering?
Nolan Ryan
Pedro Martinez, circa 1997-2005. Five pitches with command of all of them. 65.4 WAR over 9 seasons. Trout will be in the low to mid 70s at the end of this year (8 full seasons).
That was going to be my pick
Easily the most dominant pitcher I’ve ever watched in the ~30 years or so of watching baseball. Peak Pedro was ludicrous at a time when offense was ludicrous.
He had very long fingers that would actually stretch out of the joint when he needed spin. I doubt anybody got more spin!
Good pitcher, but once they saw him bat they would switch him to the OF and he’d become the best OF ever. Sounds kind of like Babe Ruth.
Why do posts about the Angels make me feel so bad for Mike Trout?
I am blatantly stealing this from an ESPN piece today, but with another fantastic start to the year (3.9 fWAR thus far) he has passed all of the following HOFers in career value (using fWAR): Gwynn, Edgar, Biggio, Killebrew, Raines, Yount, Larkin, McCovey, Ozzie, Molitor, Fisk. Mize, and Walker. Using the Depth Chart projection of 5.8 WAR for the rest of the year, he’s looking at also passing: Harry Heilman, Thome, Carter, Pudge 2.0, Santo, Crawford, Miggy (unless Miggy can come up with another 3.5 WAR by the end of the year which seems doubtful), Murray, Frank Thomas, Carew, Arky Vaughn, Appling, Reggie, Fred Clarke, Jeter (c’mon, you know he’s as good as in), and Ed Delahanty. Assuming even 8 WAR next year he’s looking at another 10 HOFers (plus Pete Rose). He has basically reached the point on the career WAR list where everyone he passes is a HOFer.
Mike Trout is 27. . . .
Would the best strategy against Trout (if there is such a thing) then be just to completely randomize?
Why bother pitching to him? How close is he to having a lower run expectancy standing on first than batting?
This came up many, many, many times back when Bonds was at his peak. Except for certain specific situations, you’re usually better off pitching to the elite guy than walking him. The math just doesn’t work out because the guy is going to make some outs if you pitch to him and zero outs if you don’t.
Robert Gsellman has 1 plate appearance this season, which was a walk and he has a wRC+ of 346. So unless Trout gets his wRC+ up in the 300s, it probably doesn’t make sense to walk him every time.
I don’t think that would help very much, unless we see some evidence that Trout is doing so well because he can predict what’s coming better than anyone else. That’s possible – he’s better at a lot of things – but not something I’ve seen. The idea from articles like these seems to be that he can just hit everything no matter when you pitch it.
My question is whether it’s better to just pitch Trout generically and take your lumps than to spend any amount of time and energy thinking about getting him out. Hard up and in, soft low and away, and put your thinking points into getting the other eight guys. This will probably be a little worse than a specific approach against Trout, but I’m guessing it won’t be enough so to counterbalance the benefit you’d get the rest of the time, since the specific approaches aren’t effective.
Though there’s probably some ego involved too – everyone wants to be the guy that figures him out.
Disclaimer: I’m a huge Astros, fan.
I watch the Angels a fair amount since I watch them play the Astros a fair amount, but I have never been in complete awe of Mike Trout the way everyone else seems to be. He has never seemed like a game changing player in the games I’ve watched, (which is the vast majority of them since 2013). But obviously he is amazing and every objective metric confirms this.
I have actually been in awe of Andrelton Simmons, who looks like the best shortstop that has ever lived, and who seems hit hr after hr against the Astros. I was wondering why there was such a mismatch in my perception of Mike Trout and the objective statistics, and whether the Astros might just be doing an excellent job at managing Mike Trout. So I looked at some team splits.
Below is Mike Trout’s OPS against the Astros and his OPS on the year. Keep in mind that as opponents in the same division, this is actually a fair amount of plate appearances.
YEAR ASTROS MLB
2016: 0.918 0.991
2017: 0.780 1.071
2018: 0.716 1.088
2019: 0.125 (very small sample) 1.060
So it seems to me like against the Astros, Mike Trout as has been a solidly average batter, at least in terms of OPS. Furthermore, the Astros have held Mike Trout to far below his average OPS against the league. This either says a lot about the Astros management of Mike Trout, the Astros rotation itself, which is obviously has been excellent in the last 2-3 years, or perhaps both.
I looked up Andrelton Simmons for comparison.
YEAR ASTROS MLB
2016: 0.690 0.594
2017: 0.662 0.752
2018: 0.887 0.754
2019: 0.536 0.738
There doesn’t seem to be much of a drop-off in production for Simmons against the Astros the way we saw for Trout. And at least in the recent past, it looks like Andrelton Simmons might indeed have outperformed Trout against the Astros. So while my perception of Simmons’ offensive prowess was clearly exaggerated, I feel at least slightly comforted that my perception of player quality given the games I saw wasn’t completely out of line with the stats put up in those games.
Lastly to investigate whether Mike Trout has simply been handled well by the Astros, or whether the Astros staff has just been that good I looked up the OPS against the Astros vs. the league Avg. OPS.
YEAR ASTROS MLB
2016: 0.737 0.739
2017: 0.720 0.750
2018: 0.640 0.728
2019: 0.651 0.746
So in 2018 and 2019, the Astros staff has been great. But that doesn’t explain Mike Trout’s 0.300 gap in performance against the Astros vs. the rest of the league in 2017. Also, I will very un-scientifically claim that Mike Trout’s 0.300 gap in OPS against the Astros compared to the rest of the league seems like a lot more than the 0.050 – 0.100 gap in OPS that the Astros staff has compared to the rest of the league.
All of this is to say I loved the article, but to me at least it looks like there is at least 1 team has made Mike Trout look completely average for 2-3 years.
How many games are we talking total? Because I’m tempted to say SSS and be done with it
Sure. That might be the case. Since 2017, it’s 141 plate appearances which is definitely less than the 300-400 you would expect for statistics to stabilize. If I throw in 2016, a year when the Astros staff was basically average, but when they still managed to do better than the rest of the league against Trout it’s 220 PA.
But 141-220 PA is also not that much less than the ~250 PA on which this article was based.
That’s more than I thought it would be, tried to come up with a number in my head without looking and was around 100 or so. It’s definitely something interesting to monitor going forward, but as I would with any other player I’d just expect them to perform closer to their career baseline than a selectively smaller sample, regardless of opponent.
B-ref splits show sOPS+ which allows you to compare Trout’s numbers against the Astros to everyone else’s numbers against the Astros:
2016 157
2017 103
2018 144
2019 -54
Over that same time his overall OPS+ is 185 so there is no question the Astros have managed him better than the league overall, but still, it’s the Astros. You know, one of the two the best pitching team in the league over that period (with the Indians).
My first inclination was to blame it on the uniforms making him physically ill, but it’s not the ’80s any more.
Also presumably half of those games were in Houston, where, against a neutral pitching staff, you’d expect Trout’s OPS to be higher than almost anywhere else.
Josh Bell appears to actually be turning in to a good player, but Mike Trout already has more WAR this season (in 56 games) than Josh Bell does in his 410 game career.
That’s not surprising, because Josh Bell is almost unbelievably bad on defense. By defensive runs (i.e. Def, not DRS), he’s the worst in the NL since his first full season by over 8 runs (nearly a full win). The only players worse in that category throughout the MLB are primary DHs. He’s also dead last in BsR over that period. His -48.3 combined BsR + DEF over that period. That’s actually worse than the -47.5 runs that Chris Davis was worth last year not including replacement runs.
I skipped over replacement level runs here since they’re both 1B generally but obviously they may be a little bit of a difference. The point is, Bell has been astoundingly bad at everything that’s not hitting.
Other Trout mottos, i.e. Trouttos:
The pitcher proposes, Trout disposes.
Trout is what happens while you’re making other plans.
The best-spotted pitches gang aft over the fence.
Speaking of David Fletcher, he sure looks like a pretty damn good player. He’s been worth 4 wins in his first 530 career plate appearances, he looks to be an elite defender, and he’s taken a step forward in nearly every possible way as a hitter this year.
Fletcher has a 1.9% (!!!) swinging strike rate this year!
That contact rate in the strike zone is absolutely bonkers given the XBH he accumulates. What a treat to watch.
“Trout has started making contact with basically everything he swings at in the strike zone. His zone contact rate of 94.9% is sixth in baseball and the highest of his career. ”
Maybe SSS, but is there some team/park specific thing going on? Right now the leader boards have five of the top 11 in the Majors as far as Z-Contact%/qualified all on the Angels. n=167, so they have five batters at the 93rd percentile or higher.
Trout aside, it’s a team hitting philosophy. A legacy of the Scioscia old-school era.
It may be time to switch the Trout-Mantle comparos to Trout-Williams.
It is just ridiculous that a guy that physically gifted should be so game savvy.
Come what may, nobody will ever be able to argue he didn’t get the most out of his natural talent.
As an all-around player, I like Trout-Aaron. Not to mention the clocklike excellence they’ve shown year after year.
If Trout died tomorrow, the 10-year rule would be waived and he would be a first ballot HOF.
But here’s some fun with math. Over the 7 seasons from 2012-2018, Trout averaged 146 games played. If you take his per game averages over those 7 seasons (ignoring the 2011 cup of coffee) and project them through his age-39 season playing 146 games a year (essentially “what if Mike Trout was MIKE TROUT until the end of his age-39 season?”) you get these career totals:
676 HR
2229 R
1822 RBI
3341 H
1963 BB
184.3 WAR
That’s good for 5th in HR, 3rd in R, 21st in RBI, 10th in Hits, 5th in Walks, and 1st in WAR.
Trout is ahead of his career pace in most counting stats (though not hits) this season. But I suspect the one “What If?” question we will have on our minds two decades from now is “What if Mike Trout had been in a better lineup?” He won’t miss years to military service like Ted Williams, but what would his stats have looked like on a better team?
Less walks.
Bigger factor IMO, his home ballpark. Put him in Yankee stadium or Boston, etc and those counting stats look even more insane.
Enjoyed the analytical section of this article quite a bit, but thought the snarky preamble was trying a little too hard to emulate the stylistic irreverence of FG vets like Sullivan and Cistulli. The Angels’ rotation has been simply terrible, but it seems an odd year to try to paint their team offense as particularly weak, or as you’ve put it: “this unending deluge of mediocrity”. Just two examples of where the rhetoric seems a little over-eager to shit on the Angels here:
“Los Angeles has a robust 109 wRC+ this year among non-pitchers, which sounds good until you realize that non-Trout Angels have a 100 wRC+.”
One, removing the peaks from a composite team metric to try to prove that the baseline is relatively poor just seems like drunk statistics. But the real problem is: 100 wRC+ is simply not bad in this era of superteams. 17 teams in the MLB had wRC+s lower than 100 going into play tonight, so that suggests a slightly better than median offense even without their best player. The Angels came into tonight with 10 players with 100 wRC+ or better, including Pujols, which is saying something.
“He’s having a good year, as Jay Jaffe noted, but unfortunately for him, he’s still Tommy La Stella.”
This just seems like a cheap shot, and a misleading one. The very interesting thing about what La Stella is doing, and why Jaffe was on point, is that La Stella is *not* Tommy La Stella this season, or not who he once was, given prior use.
All of this no doubt is a little pedantic, but I think it’s a shame to miss what’s unique about the Angels this season, compared to some of their recent clubs. They’ve actually put together a reasonably interesting offense, with unique characteristics (historically low K-rates, for one), but their dreadful pitching has overshadowed it.
To be a bit pedantic, 100wRC+ is exactly average (sure, might not be the median because of skew) and mediocre means “of average quality”. So to call a team offence with a 100wRC+ (outside of Trout) a mediocrity is fair enough.
All reasonable Angels fans recognized going in that this would be a rough year from a wins perspective. Yes, I know you could make an SSS argument about that. 😉 But you’re certainly right that there have been parts that are interesting to watch.
Also, I hope he feels quite fortunate to be Tommy La Stella.