Shane Bieber’s New Old Curve
It’s the beginning of August, and one only one pitcher is on pace for a 6 WAR season. In a normal year, that would be disappointing; there are usually something like four or five of them. In this short year, on the other hand, it’s downright amazing, and I don’t know a better way to say it than that: right now, Shane Bieber is downright amazing.
Through two starts, Bieber is putting up numbers like peak Craig Kimbrel, only he’s doing it as a starter. You’ve seen individual games like this before, so the numbers might not sound completely wild to you, but they’re wild. A 54% strikeout rate and 2% walk rate, a 0 ERA, a -0.36 FIP; that’s all obviously excellent in an abstract sense. To truly understand it, however, you have to take a closer look at Bieber’s stuff. He’s absolutely bullied his way through two straight dominant performances, and there’s no better way to do it than to take a trip through his overpowering secondary stuff. Watch hitters flail, and you can get a better sense of how thoroughly masterful Bieber has been this year.
In 2018 and 2019, Bieber’s calling card was his wipeout slider. He threw it 23% of the time in 2018 and 26% of the time in 2019, and hitters simply couldn’t do anything with it. They whiffed on roughly 43% of their swings against the pitch in both years, often looking foolish:
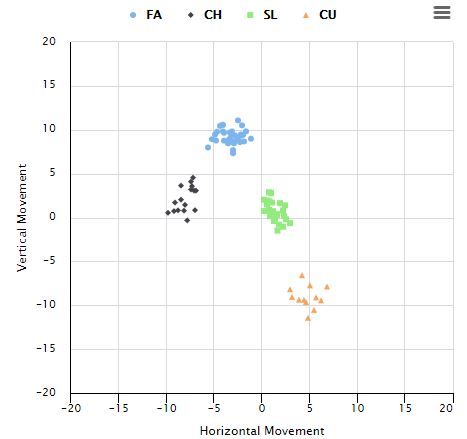
As Michael Ajeto noted last year, Bieber made a remarkable in-season change: he changed his curveball to better mirror his slider. Early in the year, they looked like this:
By season’s end, he had pared nearly five inches off of the curve’s drop, curtailed its horizontal break, and turned it into more of a bigger-dropping slider:
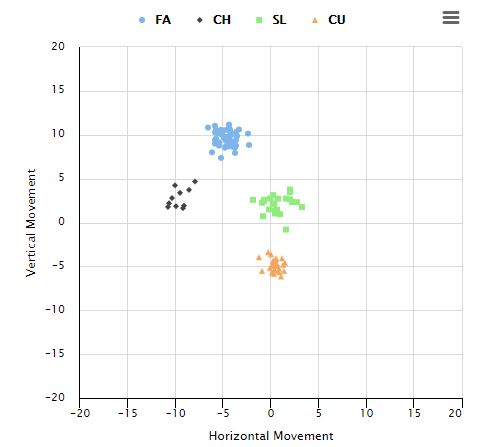
Neat, huh? I can’t speak for Bieber, but the plan seemed to be something like this: throw the curve enough like the signature slider that batters can’t recognize the different spins out of my hand, but with enough velocity and movement gap to make them miss. Due to the effects of gravity, the curve still dropped by roughly an extra foot by the time it crossed the plate, even with the new tighter configuration.
If it ended there, that would be a great story. He found a new way to throw his curve, started using it more, and profited. There’s one small problem with that tale, however: it didn’t go that way. As Bieber threw this new curve more and more, he first saw a huge spike in results. Judging by his FIP and xFIP, however, batters were able to adjust as the season wore on, and by year’s end, he was back at his prior performance level despite throwing many more curves:
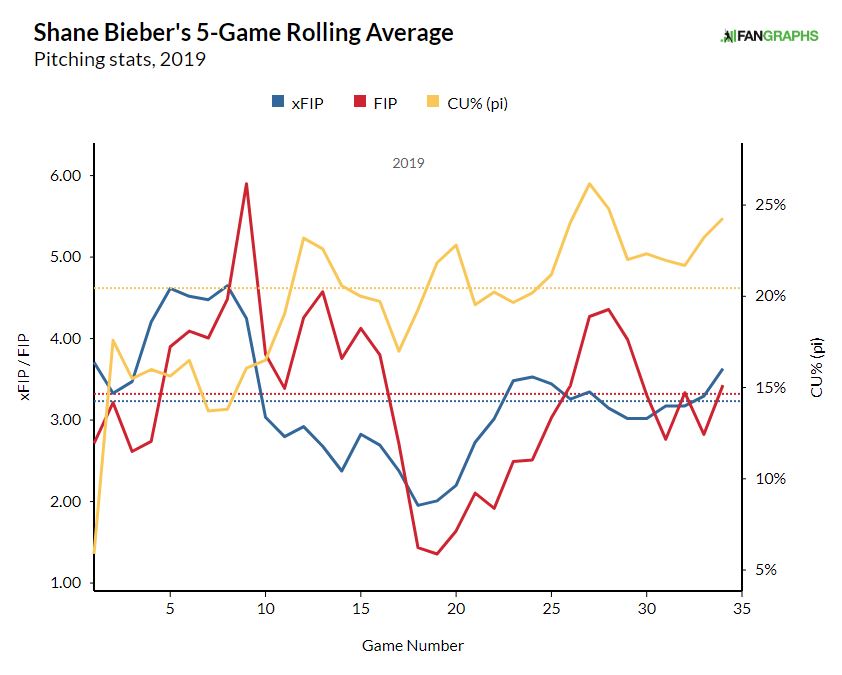
That’s not a bad thing, necessarily. Bieber was awesome last year. Even if you trimmed out the June and July stretch where he bamboozled batters with his new pitch, he would have put up a 3.81 FIP on the season, and you can’t simply strip those out: the ongoing game of cat-and-mouse is a real part of pitchers’ results.
Still, it isn’t hard to imagine Bieber being frustrated with the results. He completely remade one of his three best pitches in the middle of the season. After an adjustment period, he seemed to be no better off than before. The whiff rate on his curve never jumped like he hoped, and gains on the slider were short-lived:
| Month | Fastball | Slider | Curve |
|---|---|---|---|
| April | 12.5% | 42.7% | 53.1% |
| May | 12.1% | 43.2% | 56.3% |
| June | 15.3% | 48.2% | 54.6% |
| July | 11.8% | 49.1% | 41.9% |
| August | 18.1% | 37.2% | 44.6% |
| September | 10.8% | 42.3% | 41.2% |
In fact, if you believe this data, batters figured out Bieber’s new look quickly. New isn’t always better, particularly after the shock value wears off. For Bieber, it was decision time: stick with the smaller-bending curve, with less movement but a better approximation of his slider, or return to his old form and throw the pitch with more break.
Of course, you could always do both:
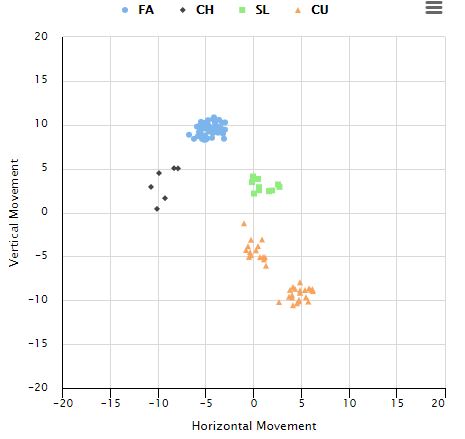
That’s right: Bieber is throwing both curves this year. They’re both curveballs, and so the aggregate movement data takes an average of the two, but there are two distinct clusters: the faux slider and the big hook. Both classes of curve have the same velocity, too. The only way to know they’re different is to watch them all the way to home plate, where they end up roughly seven inches apart from an identical initial trajectory.
There are two other changes going on here, one of which isn’t clear from this graph. First, the obvious one: Bieber throws more curveballs now. He’s thrown the pitch 35% of the time this year, and in each of his two starts, he’s leaned more heavily on it than he had in any previous start in his career.
Additionally, Bieber changed his slider to go with the new curves. You can’t really see it from the movement (without the effects of gravity); the green cluster looks to be in roughly the same spot in all three plots. One major difference: it’s three miles an hour faster now. That means the pitch drops nearly five fewer inches over its homeward flight while getting there faster. That’s less decision time, and more separation from the curve-mirroring slider even if batters manage to pick up the spin.
The net result is miserable for hitters. Bieber throws three breaking balls, and you have to be ready for any of them. They end up nowhere near each other, even though two of them look almost the same out of his hand. One even clocks in in the upper 80s, adding some time pressure to the whole puzzle.
There’s even yet one more benefit to this new model of Bieber: speeding up his slider might help out his changeup. The two pitches now move at roughly the same speed and with similar vertical break. The only difference? They end up a foot apart horizontally. Yikes! It’s still way too early to tell, as Bieber has only thrown 17 changeups in games this year, but if lefty batters try to sit on his slider, you might see more of this:
You might wonder, a thousand words into the article, why I haven’t talked much about Bieber’s fastball. It’s still there, still doing its thing, and it even has a little more oomph; he’s clocked in at 94 mph on average with the pitch this year, a hair faster than last year. For the most part, however, it is what it is. The pitch that doesn’t let batters cheat too much on the devastating array of breaking balls. It plays up, as it always has, because batters have that slider in the front of their minds when facing Bieber, but short of a further jump in velocity, it’ll always be more of a supporting act.
Now, however, it’s supporting three plus pitches instead of two. Keeping in mind that it’s still small sample size theater time, both of Bieber’s flavors of curveball have been awesome this year. Draw a line through the two sets of curves and consider them separately, and they both stand up (called strike rate here is the number of takes that are called strikes):
| Pitch | Whiff/Swing% | Called Strike% |
|---|---|---|
| Slider | 41.7% | 20.0% |
| Tight Curve | 60.0% | 30.8% |
| Big Curve | 61.9% | 27.3% |
It’s tough to capture the difference in video form, but I’ll try. Here’s the late 2019 model, the less-bendy one:
Still more than enough bend for Josh Donaldson, though! Here’s the big model, turning Jorge Polanco from a professional hitter to a man uncertain of his surroundings:
The moral of the story? Bieber has two separate curveballs, and they’re both getting unbelievable results. It’s too early to know how much of that is a side effect of hitters caught in between one and the other, and how much will fade as batters adjust to this new approach. For now, however, Shane Bieber has the best curveball in baseball, and also the second-best curveball in baseball. That’s quite the trick.
Ben is a writer at FanGraphs. He can be found on Bluesky @benclemens.
Lord god almighty.
Even the “BIG” curve is sitting at 82 mph. So Bieber has three pitches of similar speeds, yet different ending locations.
I love me a good Uncle Charlie with a huge hook (Looking at Waino with his 74 mph hook), but the 11in drop at 82 mph is something visually and physically ridiculous…