
Team Entropy 2021: Dial M for Mariners
This is the fifth installment of this year’s Team Entropy series, my recurring look not only at the races for the remaining playoff spots but the potential for end-of-season chaos in the form of down-to-the-wire suspense and even tiebreakers. Ideally, we want more ties than the men’s department at Macy’s. If you’re new to this, please read the introduction here.
The Mariners haven’t reached the postseason since 2001, and all season long, our Playoff Odds have strongly suggested that their drought — the majors’ longest active one — will continue. But as we head into the final weekend of the 2021 season, they’re on a 10-1 tear that has interjected them right into the thick of an American League Wild Card race with a decided East Coast bias. With the Yankees sweeping the Red Sox in Boston and then taking two out of three from the Blue Jays in Toronto while the Red Sox somehow dropped two out of three to the Orioles in Baltimore, we now have four teams separated by three games from top to bottom, with just three to play for each:
| Team | W | L | Win% | GB |
|---|---|---|---|---|
| Yankees | 91 | 68 | .572 | +2 |
| Red Sox | 89 | 70 | .560 | — |
| Mariners | 89 | 70 | .560 | — |
| Blue Jays | 88 | 71 | .553 | 1 |
This is not a drill! I’ll get to the mechanics of how this will be sorted out soon enough, but first, I’m taking the opportunity to spotlight the Mariners’ unlikely run and the trends they’re up against. This isn’t a dive into individual performances; elsewhere on FanGraphs today, Jake Mailhot has a closer look at what’s fueled their September run. Here I’m looking at the bigger picture. But first, an illustration of the Mariners’ Playoff Odds over the course of the season:
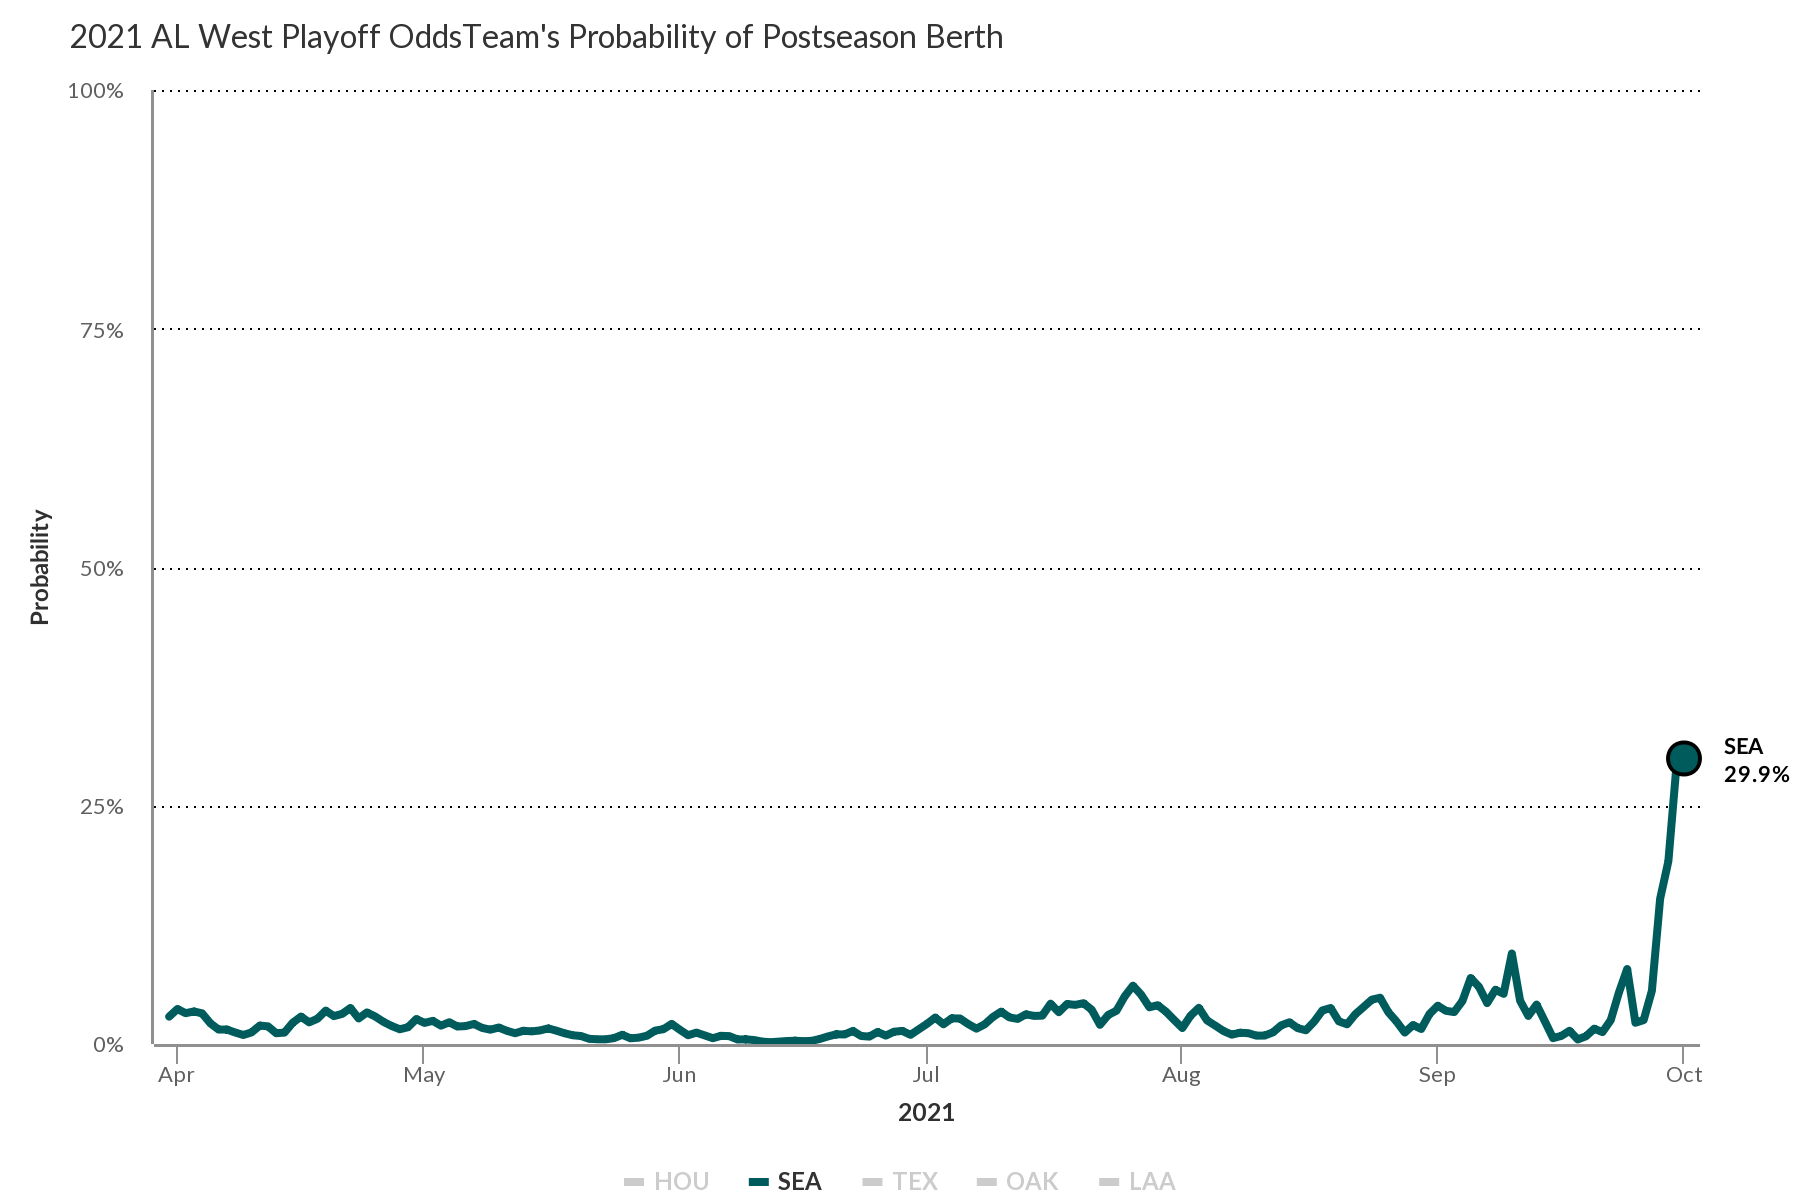
It’s been awhile since the Mariners were anywhere close to this position. While they went 89-73 just three years ago before slipping below .500 in both 2019 (68-94) and ’20 (27-33), that ’18 squad fell eight games short in the AL Wild Card race and finished 14 games behind the Astros in the AL West race. They did finish three games back in the AL Wild Card race in 2016, going 86-76 while both the Orioles and Blue Jays went 89-73, but they were a distant nine games behind the Rangers in the AL West. Not since 2003, when they went 93-69 in Lou Piniella’s final year at the helm, have they come as close by both routes to the postseason; that year, they finished three games behind the A’s in the division race and two behind the Red Sox in the AL Wild Card. And not since that 2001 team set a modern record with 116 wins have they qualified for the playoffs.
The Mariner’s postseason drought is the runaway leader among active streaks. Only the Phillies’ elimination on Thursday night trimmed the Mariners’ margin to less than a decade, and perhaps only temporarily:
| Team | Last appearance | Seasons |
|---|---|---|
| Mariners | 2001 ALCS | 19 |
| Phillies | 2011 NLDS | 10* |
| Tigers | 2014 ALDS | 7* |
| Angels | 2014 ALDS | 7* |
| Pirates | 2015 NL Wild Card | 6* |
| Royals | 2015 World Series | 6* |
If the Mariners fall short, the franchise will tie the Pirates for the fifth-longest drought of those that have crossed into the Wild Card era (1995 onward):
| Team | From | To | Seasons |
|---|---|---|---|
| Expos/Nationals | 1981 | 2012 | 30 |
| Royals | 1985 | 2014 | 28 |
| Brewers | 1982 | 2008 | 25 |
| Blue Jays | 1993 | 2015 | 21 |
| Pirates | 1992 | 2013 | 20 |
| Mariners | 2001 | — | 19 |
Even as they approach 90 wins, it must be acknowledged that these Mariners aren’t exactly a powerhouse. In fact, they’ve been outscored by 48 runs. Not only could they become just the sixth team with a negative run differential over the course of a full 162-game season to make the playoffs, but they could potentially do so with both the largest negative run differential and the most victories of those teams — and that’s a difficult trick to pull off:
| Team | Year | Wins | Losses | RS | RA | Dif |
|---|---|---|---|---|---|---|
| Padres | 2005 | 82 | 80 | 684 | 726 | -42 |
| Diamondbacks | 2007 | 90 | 72 | 712 | 732 | -20 |
| Twins | 1987 | 85 | 77 | 786 | 806 | -20 |
| Royals | 1984 | 84 | 78 | 673 | 686 | -13 |
| Giants | 1997 | 90 | 72 | 784 | 793 | -9 |
| Mariners | 2021 | 89 | 70 | 687 | 735 | -48 |
Even before going 18-8 this month to give themselves a shot at a playoff spot, the Mariners were making light of their run differential while highlighting their fun differential. Baseball Reference has even gotten in on the joke.
The Mariners got to this peculiar spot in part by going 33-18 (.647) in one-run games; both their win total and winning percentage are tops among the 30 teams, but in the division play era, that .647 winning percentage only ranks 43rd, a far cry from the 2016 Rangers’ .766 (36-11) for the highest of the period.
At the other end of the spectrum, the Mariners are a ghastly 11-28 (.282) in games decided by five or more runs, which is quite bad but just the 72nd-lowest mark of the division play era (the 2019 Tigers went 6-40 for a .130 mark!), and well ahead of the Orioles (13-42, .236) among this year’s crop. It’s when you put those two extremes together that you get something, ummm, special:
| Team | Year | W-L 1-Run | Win% 1-Run | Rdiff | W-L Blowout | Win% Blowout | Rdiff | Net Win% |
|---|---|---|---|---|---|---|---|---|
| Padres | 1974 | 31-16 | .660 | 15 | 7-38 | .156 | -230 | .504 |
| Cleveland | 2012 | 24-12 | .667 | 12 | 12-32 | .273 | -146 | .394 |
| Mariners | 2021 | 33-18 | .647 | 15 | 11-28 | .282 | -135 | .365 |
| Tigers | 2003 | 19-18 | .514 | 1 | 7-40 | .149 | -222 | .365 |
| Reds | 2003 | 30-21 | .588 | 9 | 9-29 | .237 | -154 | .351 |
| Tigers | 2002 | 23-23 | .500 | 0 | 7-37 | .159 | -230 | .341 |
| Rangers | 2016 | 36-11 | .766 | 25 | 18-24 | .429 | -52 | .337 |
| Orioles | 2010 | 29-21 | .580 | 8 | 10-31 | .244 | -135 | .336 |
| Padres | 2009 | 23-18 | .561 | 5 | 10-32 | .238 | -150 | .323 |
| Phillies | 2016 | 28-23 | .549 | 5 | 10-34 | .227 | -192 | .322 |
What’s here are splits covering 90 Mariners games at either competitive extreme — the close ones and the laughers — during which they went 44-46 while being outscored by 120 runs! In the rest of their games, they’ve gone 45-24 while beating opponents by 168 runs 72 runs (reversed a minus sign there previously, sorry). Here’s a breakdown of their won-loss record by score margin:
| Margin | Wins | Losses | Run Dif |
|---|---|---|---|
| 1 | 33 | 18 | 15 |
| 2 | 17 | 13 | 8 |
| 3 | 11 | 7 | 12 |
| 4 | 17 | 4 | 52 |
| 5 | 3 | 7 | -20 |
| 6 | 6 | 8 | -12 |
| 7 | 0 | 5 | -35 |
| 8 | 0 | 2 | -16 |
| 9 | 1 | 2 | -9 |
| 10+ | 1 | 4 | -43 |
Forget that 11-28 record in games decided by five or more runs; the Mariners are 2-13 in games decided by seven or more runs. Their .133 winning percentage in that context is 81 points lower than the next-lowest team, the Orioles (.214, 6-22).
Splits like these will do a number on the way a team’s Pythagorean record matches up — or doesn’t — with its actual record, and in fact, it’s here where the Mariners really shine:
| Tm | Year | W-L | Win% | RS | RA | Rdiff | pythW-L% | Pythdif |
|---|---|---|---|---|---|---|---|---|
| Mariners | 2021 | 89-70 | .560 | 687 | 735 | -48 | .469 | .091 |
| Tigers | 1905 | 79-74 | .516 | 512 | 604 | -92 | .428 | .088 |
| Rangers | 2016 | 95-67 | .586 | 765 | 757 | 8 | .505 | .081 |
| Padres | 2017 | 71-91 | .438 | 604 | 816 | -212 | .364 | .074 |
| Athletics | 1955 | 63-91 | .409 | 638 | 911 | -273 | .335 | .074 |
| Angels | 2008 | 100-62 | .617 | 765 | 697 | 68 | .543 | .074 |
| Dodgers | 1954 | 92-62 | .597 | 778 | 740 | 38 | .524 | .073 |
| Diamondbacks | 2005 | 77-85 | .475 | 696 | 856 | -160 | .403 | .073 |
| Yankees | 2004 | 101-61 | .623 | 897 | 808 | 89 | .551 | .073 |
| Mets | 1984 | 90-72 | .556 | 652 | 676 | -24 | .484 | .072 |
| Mariners | 2018 | 89-73 | .549 | 677 | 711 | -34 | .477 | .072 |
| Dodgers | 1924 | 92-62 | .597 | 717 | 679 | 38 | .525 | .072 |
| Orioles | 2012 | 93-69 | .574 | 712 | 705 | 7 | .505 | .069 |
| Reds | 1970 | 102-60 | .630 | 775 | 681 | 94 | .560 | .069 |
| Diamondbacks | 2007 | 90-72 | .556 | 712 | 732 | -20 | .487 | .068 |
Note that where my data source, Baseball Reference, uses the version of the Pythagorean formula with 1.83 as the exponent, I’ve opted for Pythagenpat, which uses an exponent based on the run environment. The choice of exponents reorders the top two teams, but as that’s the version of the formula we use at our Projected Standings page, it makes sense to fall in line. (Hat-tip to Baseball Prospectus‘ Rob Arthur for tracking that one, albeit with different exponents.)
As to why the Mariners are deviating from their Pythagenpat record to such a great degree, it comes down to good timing, which often has words like “clutch” or “luck” attached. Their offense has hit for a 94 wRC+ overall, which ranks 18th in the majors, but their 136 wRC+ in high-leverage situations is 20 points better than the next-highest team, the Giants. Our splits in this area only go back to 2002, but the Mariners’ performance is tops so long as we disregard both the Padres’ 166 in the shortened season last year and the 2017 Astros’ 147, which probably wasn’t all on the up-and-up. The 2005 Yankees (134) are the next-highest over a 162-game season in our limited set of data.
By our Clutch metric — which tracks how much better or worse a player (or team) does in high leverage situations than in a context neutral environment, the Mariners’ offense’s mark of 9.3 is the highest in our set of data, which goes back to 1974 and beats out the aforementioned 2016 Rangers’ 8.2 (and hat-tip here to Lookout Landing’s Isabelle Minasian for tracking that one). Throw in their 7.4 Clutch mark on the pitching side, which is merely the 12th-highest since 1974, and you’ve got another record, as their hitting-and-pitching sum of 16.72 obliterates the 2008 Angels’ 14.7 as the post-1974 record. The 2018 Mariners, who cracked the Pythag table above, challenged the mark, as Jeff Sullivan noted at the time, but they regressed to finish at 11.6. Justin Choi tracked the Mariners’ progress as far as this year’s two-way total.
With three days in the regular season to go, this plucky, Pythagenpat-defying group of clutch-sters is guaranteed nothing, and the Playoff Odds (29.9%, remember?) still say their season is more likely to end in heartbreak than not, but right now, they’re Team Entropy’s darlings. Here’s the head-to-head grid:
| Team | Record | GB | Yankees | Red Sox | Mariners | Blue Jays |
|---|---|---|---|---|---|---|
| Yankees | 91-68 | +2 | — | 9-10 | 5-2 | 8-11 |
| Red Sox | 89-70 | — | 10-9 | — | 4-3 | 10-9 |
| Mariners | 89-70 | — | 2-5 | 3-4 | — | 4-2 |
| Blue Jays | 88-71 | 1 | 11-8 | 9-10 | 2-4 | — |
If the season were to end today, or if this exact order held through the weekend — during which the Yankees host the Rays, the Blue Jays host the Orioles, the Mariners host the Angels, and the Red Sox visit the Nationals — the Red Sox and Mariners would play a Game 163 tiebreaker in Boston on the basis of the two teams’ season series results, with the winner moving on to play the Yankees in New York in the Wild Card game. Indeed, the Red Sox hold the tiebreaker advantage over all three of their competitors should such a situation arise. If they were to wind up in a three-way tie for the second spot with the Mariners and Blue Jays — and currently our Playoff Odds Tiebreaker page shows a 9.0% chance of some kind of three-way tie — the Sox would have dibs on the top spot in the pecking order on that basis, with the Mariners choosing second and the Blue Jays third for the following scenario: Club A would host Club B, with the winner of the game hosting Club C to determine who would become the lower Wild Card seed.
As for the other permutations involving a three-way tie for the second spot, if it’s the Mariners who somehow wind up above the fray, the selection order for the other three goes Red Sox, Blue Jays, Yankees. If it’s the Red Sox in the top spot, the other three would be ranked on the basis of combined winning percentage within the scrum, since each owns the upper hand in one season series but not both. That would shake out as Blue Jays (.520, 13-12), Yankees (.500, 13-13), Mariners (.462, 6-7).
The only way the Blue Jays could get to the top spot would be to sweep the spoiler-minded Orioles while the Yankees are swept, with either or both of the other two teams joining the fun by winning two of three. In this case, a three-way tie would mean three teams battling for the two Wild Card spots, the formula for which is Club A hosting Club B, with the winner becoming the top Wild Card seed, and then Club C hosting the loser of the A/B game to determine the lower Wild Card seed. We already know two of the pecking orders, namely Boston/Seattle/Toronto and Toronto/New York/Seattle. Of the others, one would go Boston/Toronto/New York (the Red Sox won both season series and the Blue Jays beat the Yankees in theirs) and the other Boston/New York/Seattle (the Red Sox won both season series and the Yankees beat the Mariners in theirs).
If we’re somehow blessed with a four-way tie (0.5% chance of happening!), the teams would be ranked by combined head-to-head winning percentage: Red Sox (24-21, .533), Blue Jays (22-22, .500), Yankees (22-23, .489), Mariners (9-11, .450). In that order, they’d draft spots in the following scenario: Club A hosts B for one Wild Card spot, while Club C hosts Club D for the other spot. The protocol page is a little murky but I believe the A/B winner would be the Wild Card host (it’s explicitly spelled out that way for the four-team, one-spot tiebreaker, which is no longer possible); if not, head-to-head records would determine the host, for which you’d consult the table above.
It’s bananas, right? And the Mariners are clear underdogs here because there aren’t many scenarios where they’re the home team in a tiebreaker situation, though they’re still in a better spot than the Blue Jays (13.6% odds). What’s more, their odds of making it through are about triple those of the two-games-back Dodgers overtaking the Giants in the NL West (9.5%) in the only other undecided race. That one wraps up with the Dodgers hosting the Brewers while the Giants host the lifeless Padres, who have lost 10 out of 11 and 16 out of 19, though all three of those wins were over the Giants. If the two teams wind up tied — meaning that the Dodgers sweep while the Giants lose two of three — they’ll meet in a tiebreaker at Oracle Park, with the loser then playing the Cardinals in the Wild Card game.
I don’t know about you, but my head is spinning from all of this. I’ll be back over the weekend with brief updates as needed.
Brooklyn-based Jay Jaffe is a senior writer for FanGraphs, the author of The Cooperstown Casebook (Thomas Dunne Books, 2017) and the creator of the JAWS (Jaffe WAR Score) metric for Hall of Fame analysis. He founded the Futility Infielder website (2001), was a columnist for Baseball Prospectus (2005-2012) and a contributing writer for Sports Illustrated (2012-2018). He has been a recurring guest on MLB Network and a member of the BBWAA since 2011, and a Hall of Fame voter since 2021. Follow him on BlueSky @jayjaffe.bsky.social.
The most likely scenario here in my opinion, is that the Yankees win 2/3 over a Rays team that isn’t playing for anything. Though I’m sure they’d be happy to hurt the Yankees in any way they can. I think Seattle is in the best spot. Go take a look at the Angels lineup they’ve been running out. It’s awful. I really think they’ll sweep the Angels. So the Red Sox would have to sweep the Nationals to keep pace. That means the Blue Jays are sitting out, no matter what they do.
So I think we may get a game 163 with the Red Sox and Mariners to decide who gets the WC2 spot, then the winner will play the Yankees. I’d love for the Jays to get in, but the Nationals and Angels are just too weak, one of them will get swept IMO. Unless Boston lets Juan Soto beat them. They’ve got to walk him in basically every non blowout spot, right? I mean he’s been ridiculous.
Nope
He came up with the based loaded tonight and hit a sac fly.
I am rooting hard for the Mariners right now. I wasn’t earlier this year and I might not be next year but I haven’t seen this big of an underdog so close to making the playoffs in a while (well, except for 2020 where the playoffs were weird). There is no way the Mariners should be in this position, not based on their talent, and not based on their run differential.
If they make it into the wild card game and win it, I’d be thrilled even if they get blasted by in a longer series later.
I’m a Mariners fan, and it’ll be typical Mariners fashion to miss the playoffs (or lose game 163) after a crazy streak to end the season and ruin their draft position. This is a franchise that can’t even lose properly hahaha.
That said, I do hope they make it in!
If it makes you feel any better, going from about 14th->20th in draft position doesn’t mean all that much.
They consistently play themselves out of top 10 hahaha
amartin, 1995 would beg to disagree. And this feels very 1995 at this juncture.
This season is maddening!
Could there really be a 4-way tie for the Wild Card? Indeed there could be.
In this messy season there’s enough entropy for this level of disorder to actually unfold. 0.5% chance notwithstanding, I believe in the 4-way tie and therefore it will happen.
I didn’t realize the Mariners run differential was so extreme. Based on that, they’ve essentially been as good as the Rockies.
They are 13-6 against the Rangers, 10-6 against the Angels, and (somehow) 15-4 against the Athletics for a combined 38-16. They’re 51-54 against everyone else. It pays to play a ton of games against two crappy teams and the Athletics, apparently.
Come on now. Other than the AL East, every team plays a ton of games against two crappy teams.
That’s fair. Not every team capitalizes on those games against crappy teams though.
The last year the Phillies made the playoffs, 2011, they went 12-6 against the Marlins. The Marlins were 5th in the NL East for 5 of those years. The Marlins have had only two winning seasons against the Phillies since 2011, 2019 and 2020, but part of the reason why the Phillies haven’t seen the postseason is because, for whatever reason, the Marlins have their number, even when they are crappy.
The Mariners have the best record against teams over .500 though
For all of the discussion of how terrible the Rockies were earlier in the year they’re going to finish the year with a record similar to the Angels, Twins, Royals, and Mets. And yes, all of those seasons were colossal disappointments but they’re clearly better than the Marlins / Nationals / Pirates / Rangers tier of teams, much less the Orioles and D-Backs. This team isn’t good but it’s not nearly as bad as everyone said they were earlier.
Hey, the Rockies played at a 96 win pace this year at home! That has to count for something. The Rockies at home were a top 5 team in baseball lmao.
.
,
?
!
*
Not only are the Mariners 11-28 in games decided by five runs or more, they’ve lost games 16-1, 15-1, 14-1, and 12-1. That’s a -53 run differential in but four games. Jeepers.
…it’s almost as if season run differential is an imperfect way of predicting future wins and losses in September. Mariners had some volatile starters with a tendency to get lit up (Kikuchi, Sheffield in particular). Thing is …losing by 9 runs is still only 1 loss. And those guys aren’t even in the rotation now. But we’ll hear about run differential again…and again…and again as if it is more predictive than it actually is. Of course it matters…but anyone who thinks the mariners are a far below .500 team talent-wise right now just isn’t paying attention.
Run differential is a joke at this point in the season.
I wouldn’t say far below .500. I would say pretty close to .500…which is probably in line with the predictions, right?
Even if you look past those losses, it would still be pretty amazing to have 89 wins with equal RS/RA.
A 0.5% chance is slightly better odds than rolling triple sixes in Risk. So not as far fetched as one would think.
“Fun differential” should be a thing.
Teams with high “fun differentials” are more likely to win.
Winners are more likely to have high “fun differentials.”
Which leads to which is the big question.
It really comes down to strong fundamentals.
Is fun a fundamental?
Definition of Clutch in Sports: of a player or action) achieving or characterized by success at a critical moment in a game or competition.
“a clutch quarterback”
Definition of Luck in Sports: success or failure apparently brought by chance rather than through one’s own actions.
“it was just luck that the first kick went in”
Now, you wouldn’t call A Clutch QB like Russ Wilson or Peyton Manning (who’s success are achieved by ones actions) a Lucky QB would ya?
The Mariners Are Clutch as in they work there ass off yo hey to Clutch moments and tend to shine when that moment comes. Lucky Moments? In 9 innings? Baseball is almost all luck it that’s the way you define such.
Lazy
Definition of catch in sport: person or action) to achieve success at a crucial moment in a match or competition.
“protective goggles”
Definition of happiness in sports: Success or failure seems to be accidental, not one’s own actions.
“Luck for the first bullet that hit the target”
So you wouldn’t call a drink like Russ Wilson Contagical Manning a happy DESIGN, would you?
Sailors did it, ass, that, hey, to connect with the moment and they tend to shine when that moment comes. A happy moment? In 9 rounds? Baseball is almost always luck, that’s how you define it.
Lie
I’d like a drink called “Russ Wilson Contagical Manning”, even not knowing what’s in it.
Bottoms up!
Definition of Clutch:
(of a player or action) achieving or characterized by success at a critical moment in a game or competition.
“a clutch quarterback”
Definition of Luck: success or failure apparently brought by chance rather than through one’s own actions.
“it was just luck that the first kick went in”
Ya wouldn’t call a Clutch QB who success at critical moments Lucky because they worked ass off to get to that Moment. Same with Clutch Teams. I know ya wouldn’t call Russ Wilson or Tom Brady Lucky QBs would ya? Exactly.
Horrible use of words, LaZy as a matter of fact, al
Speaking of entropy – we have a tiebreaker scenario to break right here in the comment section.
Which MLBPDX#90214 (sp?) post gets translated? This one I’m replying to, or the older one just above it?
Thx,
Serb
Do we need a tiebreaker here? How about giving one of them a wild card and doing both?
{Done, and done. – Serb}
Merge definition:
(person or action) achieving or demonstrating success at an important point in a game or competition.
“protective goggles”
Definition of happiness: Success or failure seems to be the result of chance, not one’s own actions.
“Luck for the first bullet that hit the target”
I wouldn’t call the clutch that succeeds in key moments happy because they worked hell to get there. There is a control glass. I know you wouldn’t call Russ Wilson or Tom Brady a fun RADIO, would you? Taco I
Terrible use of words, really lazy, everything
Taco I, the first of the long Taco dynasty, had a particular interest in hot sauce. Near the end of his reign, he established a secret laboratory that he personally supervised to devise the perfect heat-scorching topping. Rumors abounded that the laboratory’s explosion and the king’s unceremonious death was orchestrated by the ambitious Taco II. More recent evidence suggests that the scientists under his direction had created a monster that they could not control.
Taco XL has been a regular in my Fridge Five.
The 2014 Mariners finished one game out of the second wild card spot.
Records against teams with records over .500
Mariners 44-34
Yankees 47-41
Blue Jays 48-44
Red Sox 46-48
It’s pretty obvious that run differential isn’t as important as records against other good teams.
Not quite sure how this makes anything obvious other than the M’s played 10, 14, and 16 less games over teams with records over .500. Yes, their win percentage in those games is better, but the totals are lower.
lol…just smh.
oh cmon lol. they could go 0-10 in hypothetical bonus games against >.500 talent and have the. 3rd best record there. the only thing this says is that the quality of the mariners >.500 opponents likely differed from that of the blue jays/yankees/red sox, seeing as the latter three all play in the same division
Actually this just proves that Pythag, run differential, and playoff odds are useless metrics for baseball. So non-correlated as to be completely useless.
On the longest playoff drought streak graphic, I’d put a footnote in on the 94 Expos best record in baseball, alas, the strike season kept that streak going 🙁