
The 2019 Pitcher Projections: Where Did We Go Wrong?
If the other projectionators are anything like me, the projections going awry, afoul, or askew is always something in the back of their minds. Ideally, one should make projections, let the rubber hit the road, and then worry about what actually happened in the fall post-mortems. As much as I’d like to do that, when ZiPS makes an aggressive projection in one direction or the other, especially one that departs from the consensus of the other projection systems, I can’t help but look over my shoulder.
Two of the projections keeping me up at night the most from the preseason are those of Shane Bieber and Giovanny Gallegos.
Coming into 2019, ZiPS projected Bieber to go 13-8, with a 3.71 ERA, a 3.49 FIP, and 3.8 WAR. Those numbers were a bit sweat-inducing given that 3.8 WAR was enough to rank Bieber 13th in the majors entering the season. Bieber had a 3.23 FIP in his rookie season, but posted a 4.55 ERA and appeared to lack an out pitch against left-handed batters. Players with fewer projected wins included reigning AL Cy Young winner Blake Snell, Stephen Strasburg, German Marquez, and Patrick Corbin. Thankfully, this was one projection where ZiPS had company, with the rest of the projection systems housed at FanGraphs (Steamer, THE BAT, ATC) joining in. Whether your preferred quote about friendship is “I would rather walk with a friend in the dark, than alone in the light,” or the considerably darker “Misery loves company,” we all went down the Bieber road together.
But ZiPS went out on the Giovanny Gallegos branch nearly alone. Gallegos was in the top 10 of pitchers ZiPS was the most optimistic about. Indeed, with a 0.57 ERA difference between ZiPS and the consensus, ZiPS was only more optimistic about three other pitchers: Brad Brach, Mychal Givens, and Juan Nicasio. ZiPS is losing those battles so far, but Gallegos has been terrific for the Cardinals, striking out 13 batters a game; he was recently moved into higher-leverage spots.
For those curious, the consensus RMSE (root-mean-square error) among pitchers with 25 innings is 1.384; for ZiPS, it’s 1.387. That’s actually slightly better than expected for ZiPS — consensus projections tend to beat all the projection systems individually — but the system can’t make any claims to improved accuracy given that we’re talking half of a season’s worth of data. Nor would it be fair for me to make such a claim given my insurmountable conflict of interest! (Incidentally, we all struck out quite horribly on the level of offense in the league.)
| Name | Consensus ERA | Actual ERA | Diff |
|---|---|---|---|
| Dan Straily | 4.98 | 9.82 | -4.84 |
| Corbin Burnes | 4.11 | 8.64 | -4.53 |
| Nick Kingham | 4.53 | 8.73 | -4.20 |
| Wei-Yin Chen | 4.27 | 8.16 | -3.89 |
| Drew Smyly | 4.58 | 8.42 | -3.84 |
| Shelby Miller | 4.78 | 8.59 | -3.82 |
| Erik Swanson | 4.38 | 8.04 | -3.67 |
| Ryan Carpenter | 5.27 | 8.82 | -3.55 |
| Adam Conley | 4.09 | 7.31 | -3.22 |
| Chris Stratton | 4.46 | 7.52 | -3.06 |
| Matt Harvey | 4.52 | 7.50 | -2.98 |
| Jonathan Holder | 3.84 | 6.81 | -2.97 |
| Trevor Cahill | 4.12 | 6.93 | -2.82 |
| Kyle Freeland | 4.34 | 7.13 | -2.79 |
| Matt Grace | 3.89 | 6.53 | -2.64 |
| Corey Kluber | 3.22 | 5.80 | -2.59 |
| Mike Foltynewicz | 3.84 | 6.37 | -2.53 |
| Zack Godley | 4.11 | 6.61 | -2.50 |
| Manny Banuelos | 4.52 | 6.90 | -2.38 |
| Edwin Diaz | 2.45 | 4.78 | -2.33 |
Looking at our worst undershoots, we can instantly pick out what’s most volatile when it comes to pitchers: injuries, homers, and BABIP shenanigans. Nobody expected Dan Straily to actually be a good pitcher in 2019, and he’s regularly brought up as the main piece in one of the worst trades in recent memory, but the depths to which he has sunk are impressive. As terrible as allowing a homer every 10 batters is — that’s essentially turning a league-average hitter into Barry Bonds — that level of incompetence likely isn’t sustainable.
I’m not surprised that projection systems have trouble with pitchers like Drew Smyly, Shelby Miller, and Matt Harvey, given their brutal injury records. Corey Kluber isn’t actually a .370 BABIP pitcher, so I expect that if and when he returns, he will at least gets closer to the prognostications. Similarly, Edwin Diaz has a .397 BABIP with the Mets, suggesting he’s been cursed with poor luck on top of rather poor team defense. I’d be more worried about Diaz if his 2017 walk rate returned.
| Name | Consensus ERA | Actual ERA | Diff |
|---|---|---|---|
| Shane Greene | 4.22 | 0.87 | 3.35 |
| Emilio Pagan | 4.01 | 1.14 | 2.87 |
| Brandon Workman | 4.45 | 1.70 | 2.75 |
| Yoan Lopez | 3.85 | 1.11 | 2.74 |
| John Means | 5.20 | 2.50 | 2.70 |
| Amir Garrett | 4.11 | 1.75 | 2.36 |
| Will Harris | 3.49 | 1.19 | 2.30 |
| Lucas Giolito | 5.01 | 2.72 | 2.29 |
| Liam Hendriks | 3.53 | 1.38 | 2.15 |
| Brandon Kintzler | 4.20 | 2.06 | 2.14 |
| Adam Ottavino | 3.58 | 1.45 | 2.13 |
| Kirby Yates | 3.31 | 1.27 | 2.04 |
| Mike Minor | 4.40 | 2.40 | 2.00 |
| Austin Brice | 4.17 | 2.23 | 1.94 |
| Tommy Milone | 4.88 | 2.95 | 1.93 |
| Luis Perdomo | 4.24 | 2.32 | 1.92 |
| Tyler Glasnow | 3.76 | 1.86 | 1.90 |
| John Gant | 4.21 | 2.32 | 1.89 |
| Hyun-Jin Ryu | 3.71 | 1.83 | 1.88 |
| Scott Oberg | 3.85 | 1.99 | 1.86 |
Seeing Hyun-Jin Ryu on this list really outlines just how impressive his 2019 has been. While it’s not surprising to see Ryu’s projection have more volatility than the average projection might given his injury history, we’ve seen a lot of healthy Ryu in 2019 and he hadn’t previously pitched like he’s pitching now. He’s already three-quarters of the way to a career-best WAR. Walking just seven batters in a half-season is Tewksbury territory, and Ol’ Tewk certainly never struck out eight batters per game. He only struck out eight batters in a game a handful of times during his career!
While there are some out-and-out flukes on this list (Shane Greene, Yoan Lopez, and Austin Brice are all among the leaders in FIP overachieving), there are a few pitchers here about whom I think the projection systems will be incorrect. Tyler Glasnow is much more aggressive at getting first-pitch strikes now than he was with the Pirates, and Lucas Giolito’s changeup is suddenly a dangerous weapon. I don’t expect projection systems to be able to predict these sorts of things. Indeed, they serve as a reminder that the error bars around pitchers are huge and that you should never count out phenomenally talented young players.
I’m still not sure what to think about John Means. His 2.50 ERA is probably an illusion, but the Orioles would happily take his 3.95 FIP for the next six years. ZiPS tends to do well with the changeup guys (Kyle Hendricks and Doug Fister were long-term ZiPS favorites), but it didn’t see it with Means. These successful change-of-pace artists have a tendency to dominate the minors, but without velocity, scouts tend to generally be suspicious of them pulling the same tricks against major league hitters. In Means’ case, while his minor league history was fine, it wasn’t particularly noteworthy. I’m not quite a believer in Means, but objectively speaking, I can’t justify being a disbeliever.
Next up: The Batters.
Dan Szymborski is a senior writer for FanGraphs and the developer of the ZiPS projection system. He was a writer for ESPN.com from 2010-2018, a regular guest on a number of radio shows and podcasts, and a voting BBWAA member. He also maintains a terrible Twitter account at @DSzymborski.
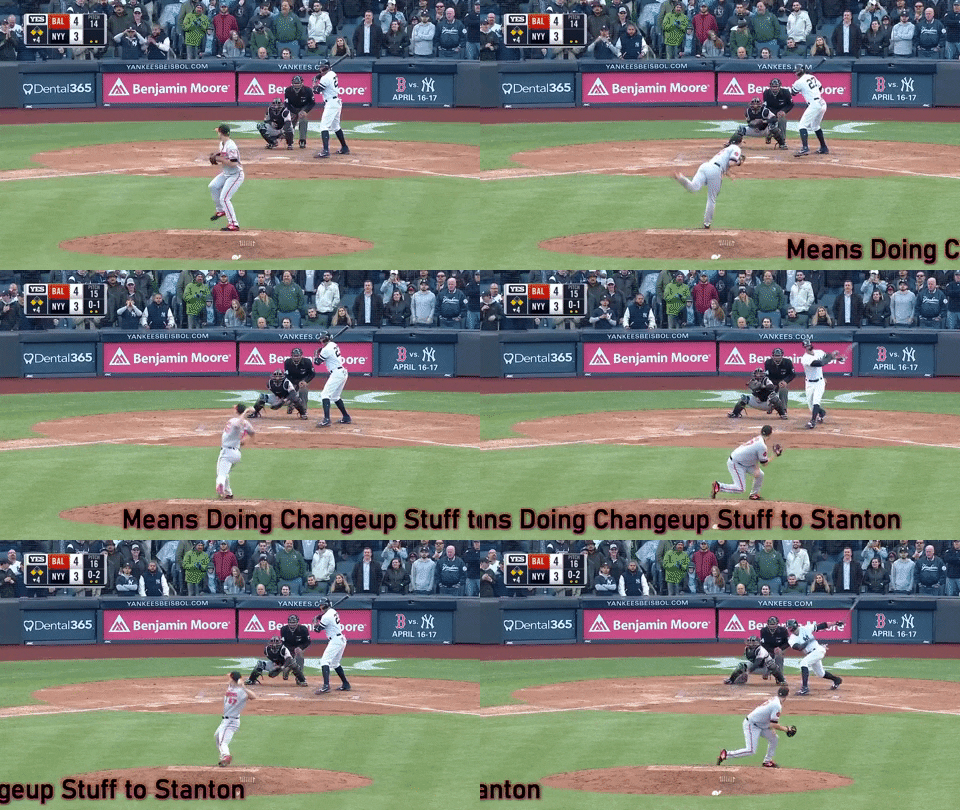
I think you mean Means Doing Mean Changeup Stuff to Stanton.
“and he hadn’t previously pitched like he’s pitching now.”
’18 (82.1 IP): 1.97 ERA, 3.00 FIP, 3.11 xFIP
’19 (103.0 IP): 1.83 ERA, 2.88 FIP, 3.05 xFIP
Looking similar?
And JFYI, below is the full list of active SPs who have a lower career ERA (min. 650 IP) than Ryu:
1. Kershaw
2. deGrom
3. Sale
No, he was excellent last year, but not *quite* like now with that walk rate. Last year he was in awesome control pitcher territory, not superfreakopia!
Edwin Diaz has been the culprit much more than the victim of poor defense? What the %$^&*# did defense have to do with the 7 bombs that have gone off in his 32 innings of pitching. The worshipers of the strikeout are the only ones who can see anything good in his performance this year. There are many reasons the Mets have imploded but the 5/29 game against the Dodgers in which Diaz blew an 8-5 lead in the 9th looks more and more like the fuse that started the conflagration. The Mets were 27-27 at the time and about to win a series in LA. It didn’t happen and it has been nothing but a chute to oblivion ever since.
Diaz’ 48% hard hit % is fifth worst in MLB (with a minimum of 30 IP). Ouch
The Mets went 5-5 with a zero run differential in the 10 games following that Diaz blown save. The point you’re making regarding the HRs is legit, but the chute to oblivion didn’t really occur until the last week.
I’m a little bit mad that Tewksbury’s player page isn’t linked.
Brandon Workman has not been getting enough credit for the amazing season he is having. It is also perhaps the most bizarre pitching line ever seen. He is allowing an unbelievable 2.97 hits/9 innings. and is walking 6.32/9. I think it is safe to say that no pitcher has ever been this effective while walking twice as many batters than he is giving up hits. Workman still has a long way to go to stay ahead of Aroldis Chapman’s 3.5 hits/9 in 2014. In addition it looks like Cora has no choice but to give Workman the ball and live on this shaky tightrope which won’t make it any easier to continue this pace.
Alex Colome is allowing 3.27h/9ip while walking only 2.7/9. Helps that Colome’s BABIP-against is .099 and Workman’s is .164.
Why is there was no conclusion to the Bieber and Gallegos projections versus results? Even as an Indians fan, I had lost track of how well Bieber had done. His 2.7 WAR is 15th in the MLB, which you would not guessed from the tone of this article.
Could it be that the technology of adaption has overtaken that of projection?