The Real Reliever Problem
With so many variables, isolating specific trends in baseball can be tricky. Relievers have been pitching more and more innings. Strikeouts keep going up. The ball has been juiced, de-juiced, and re-juiced, making home run totals hard to fathom and difficult to place in context, both for this year and for years past. One noticeable aspect of this season’s play, influenced by some or all of the factors just listed, is that relievers are actually performing worse than starters. Our starter/reliever splits go back to 1974, and that has never happened before. Here is how starter and relievers have performed since 2002:
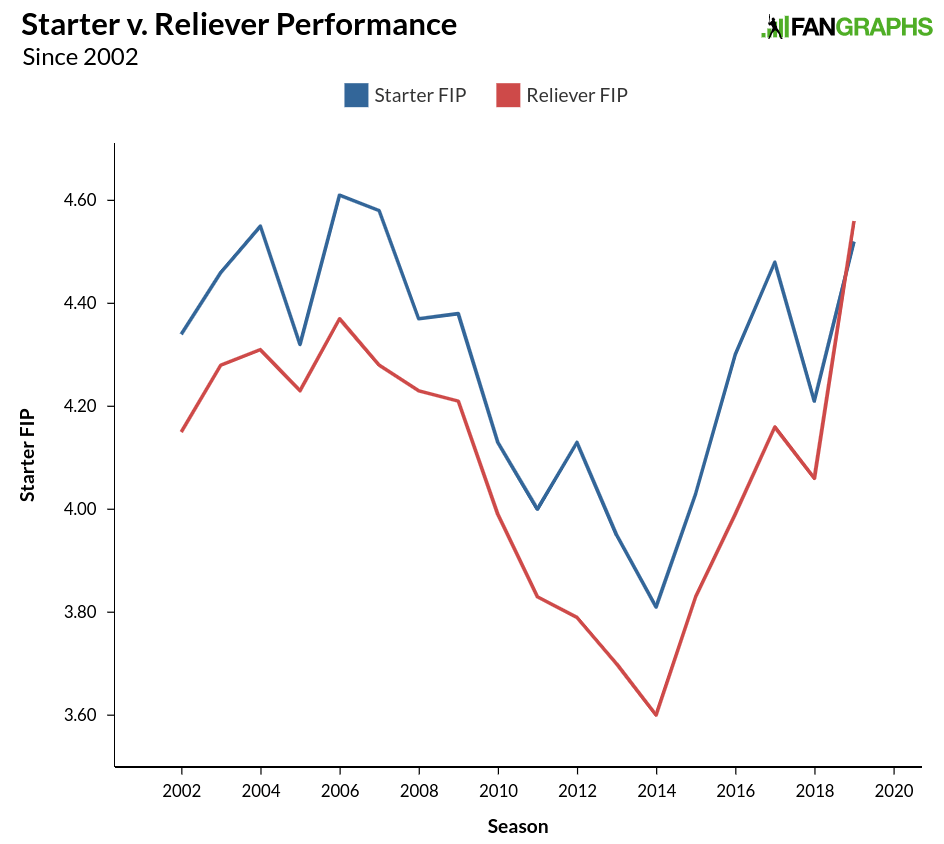
A healthy gap between the two roles has existed for some time, but seems to have taken an abrupt turn this year. Ben Clemens looked at the talent level between starters and relievers earlier this season in a pair of posts that discussed how starters are preparing more like relievers, as well as the potential dilution of talent among relievers. The evidence seemed to point toward the latter theory, though exactly how that dilution has affected performance comes in a rather interesting package. Providing some evidence for the dilution effect is the number of innings handled by relievers in recent seasons. While the idea of starters pitching better than relievers is a new one statistically, the trend of increasing reliever innings likely made this year’s change possible. Below, see the share of reliever innings and reliever WAR since 2002:
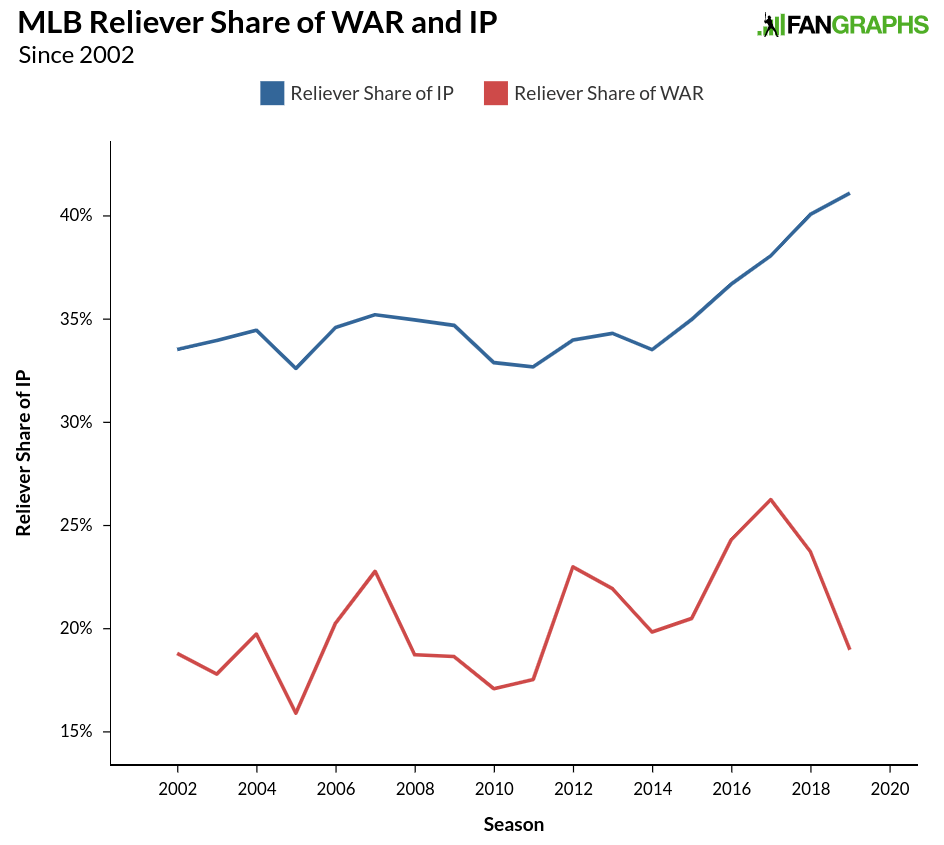
The share of innings taken by relievers has gone up rather sharply since 2015, when it was around 35%, to this season’s 41%. While the reliever share of WAR went up in 2016 and 2017, last season saw the share go back to 2016 levels and this season, reliever WAR is roughly the same as it was from 2002-2015. More innings has not meant greater efficacy; indeed, increased exposure has resulted in a decline in overall quality from relief pitchers.
We might assume that the overall quality of relievers has decline top to bottom, but that hasn’t been the case. If we assume that managers are generally optimizing their bullpens and pitching good relievers in important situations (and bad relievers in unimportant situations), we can look at performance by leverage index to see where the gains and losses in effectiveness have been made. The graph below shows reliever performance in high and medium leverage situations compared to overall starter performance:
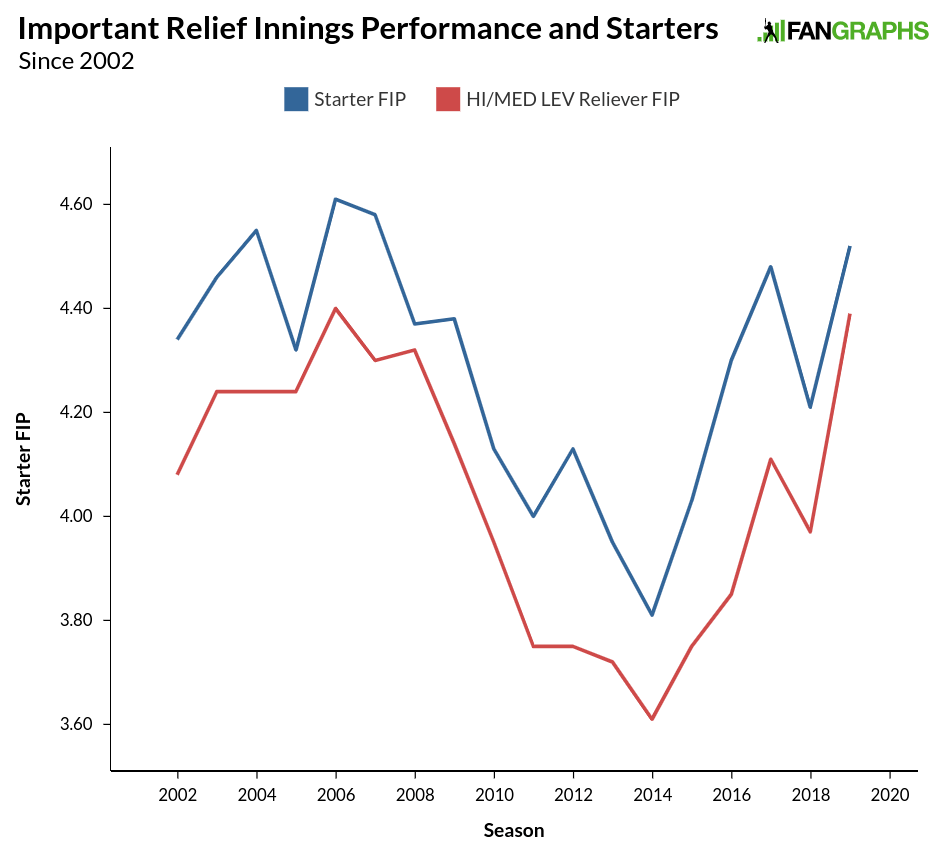
When we compare only the relievers we presume to be the better ones, we see a performance in line with previous seasons. The gap is smaller this season than in years past, but it is still evident. Here’s what happens when we add in low-leverage performances:
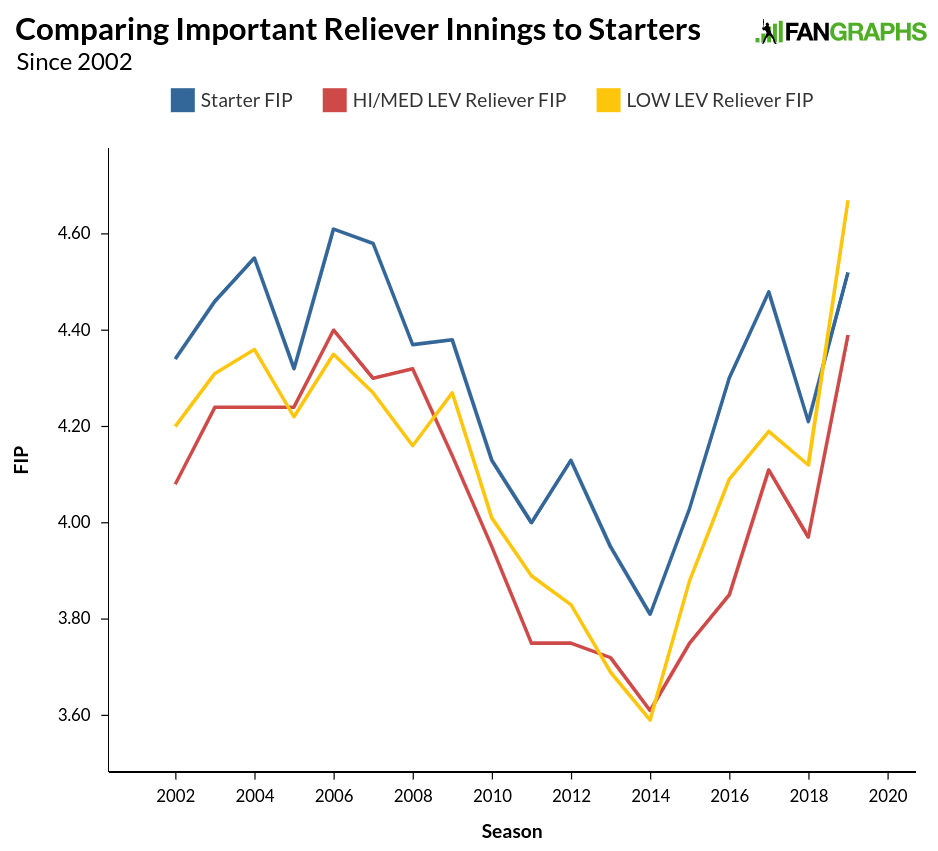
Much of what we saw prior to 2015 was simply managers using their bullpens sub-optimally. The pitchers pitching in less important situations were almost exactly as good the pitchers trying to get outs in moments that mattered. Either all relievers were the same, or good relievers were pitching too much when the game wasn’t on the line, while poor relievers were taking on too many hitters with the outcome of the game yet to be decided. Since 2015, we’ve seen a small gap in performance between the two different situations, with an explosion this season as the 0.28 difference in FIP almost doubles last season’s difference and the average since 2015, both of which were 0.15.
These differences are exacerbated when we consider the number of innings being covered by the groups above. We know that the reliever innings have shot up. Here’s the breakdown between low-leverage situations and medium- and high-leverage situations:
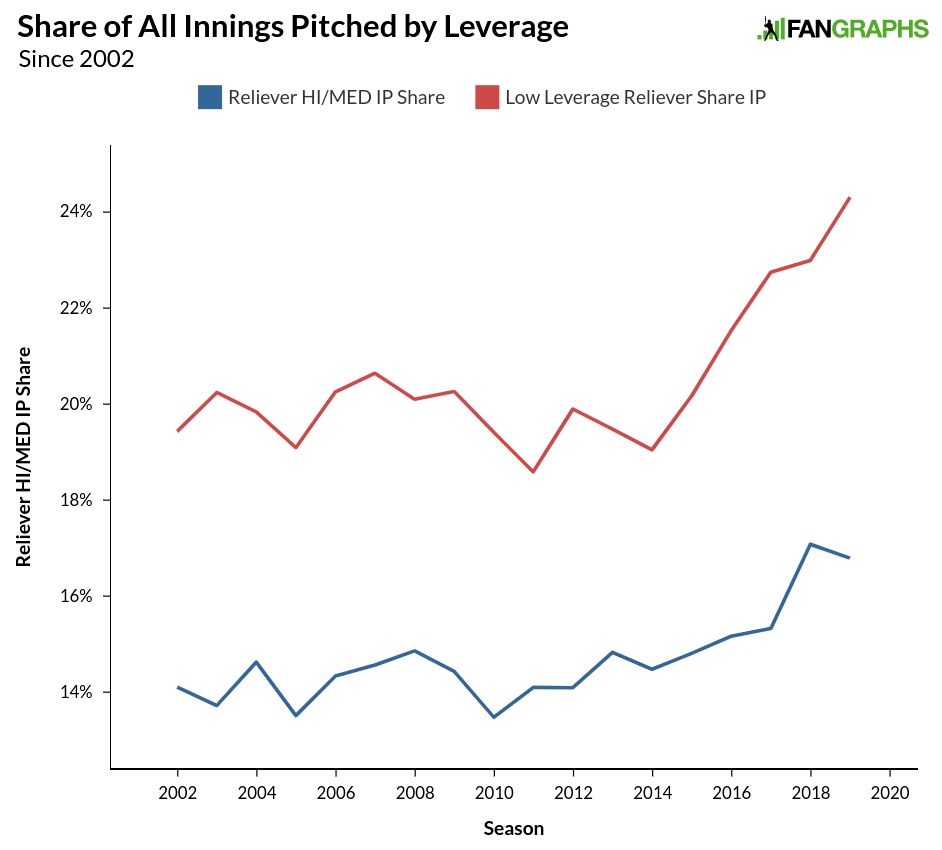
Over the past five seasons, medium- and high-leverage situations have gone up by about two percentage points. Low-leverage situations have shot up at twice that level, increasing by about four percentage points. Not only are the worst relievers performing at a lower level than their peers compared to past seasons, they are also pitching a lot more.
When we consider the issue of reliever usage and performance, we generally aren’t talking about taking out the starting pitcher who used to finish a game, but now only goes seven innings. Those relievers are still getting the job done, at least relative to starter performance. We aren’t even talking about a starter being removed after five innings in a close game and asking the bullpen to get the last 12-15 outs. When those situations occur, relievers are still performing better than starters, just as they have in year’s past.
Where baseball might have a reliever problem is when the game is 6-1 in the fourth inning. Managers are no longer asking their starters to soak up innings, and they aren’t going to use one of their better relievers when the team doesn’t have a great chance of winning. There are some positive aspects to this strategy, as it is possible teams are doing a better job — or at least trying to do a better job — at preserving the arms of young pitchers, and that goes for close games and blowouts. The incidence of Tommy John surgery is down the last couple of years from where it was five years ago, and it has been down considerably so far this season. That might be a blip, but it could be a sign teams are collectively turning a corner when it comes to pitching injuries.
As for the bad, we are seeing a lot more non-competitive innings. The graphs above aren’t too concerning, but this next one should be. Below is the overall percentage of innings pitched with a high- and medium-leverage index compared to a low-leverage index:
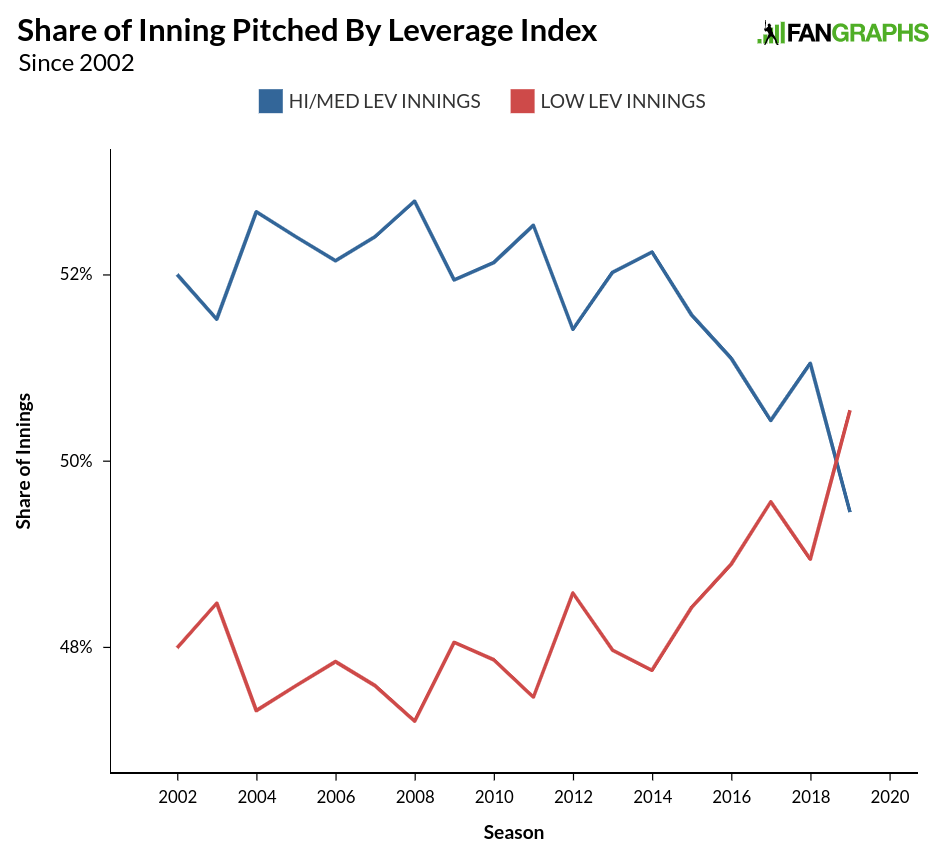
For the first time since at least 2002, there have been more low-leverage innings pitched than any other type. The two percent drop over the last few seasons is the innings equivalent of 50 full games in a season going from interesting to dull. Some of this might come from managers more optimally using their bullpen, thus failing to make a contest of all nine innings so they can preserve their team’s players for when the club has a better chance at winning. Some of it probably has to do with the all of those home runs, which result in blowouts and would be happening regardless of bullpen usage. The biggest culprit, though, is likely competition, or lack thereof. The less parity (and higher scoring) there is in the sport, the more non-competitive games result. This season, the top-to-almost-bottom competitive National League still has a majority of innings pitched in medium and high leverage situations, but in the American League, with less competition and a more top-and bottom-heavy setup, nearly two percentage points lower in terms of leverage.
We might be reaching an equilibrium in terms of reliever and starter performances, but in closer games, we still see a normal disparity between starters and relievers even as relievers have taken on more innings. The low-leverage reliever innings are bringing overall reliever performance way down. While a dilution of talent might be somewhat responsible for this change, the real issue is a lack of competition. Competitive teams (or a lower run-scoring environment) lead to competitive games, and putting a better product on the field for all 30 teams would mean more exciting play for everyone.
Craig Edwards can be found on twitter @craigjedwards.
Really interesting stuff, Craig. Thanks!
Was there any effort to isolate opener/first man from the data?
Great question as you’d think this could be a big contributor to the increasing share of IP going to relievers.
What stadium is in your profile picture?
The stadium in the profile pic looks like Ft Wayne, Indiana
So, we can blame Detroit, Baltimore & KC! I would love if they could be isolated from the study & see how much difference it makes.
As someone who follows Detroit, this makes sense anecdotally. They are pitching so many replacement level guys & it does seem like every 4th-5th game (The ones not started by Boyd, Turnbull, Norris), they are down 6-0 early & here comes whoever rode the Toledo Express to Detroit most recently. The other issue is as a fan, it is impossible to follow the team, literally seems like every week or so they have some new pitcher that people who don’t follow the farm system have never heard of.
You’d have to also remove the 3 worst teams from every other year to do a real comparison
The author just seems to assert this without bothering to show it. Is that the subject of a future post?
Not a fan of the last couple of paragraphs that have high scoring/low scoring in parenthesis. When I create his last graph with just NL teams, I get basically the same thing except low leverage still hasn’t quite passed high leverage there. Looks like scoring environment plays a bigger role than parity. When I look at the low leverage line in the last graph, it looks like the HR per inning line over that time period.
Though I should say, article is fantastic up to that point. I do get a R2 of 0.83 for percent low leverage innings as a function of homers per inning. Going to be tough for lack of parity to beat that.
I was also skeptical at this point. I’ve watched mostly the NL East this year and “bad teams are REALLY bad” just doesn’t seem to be an adequate explanation for the really weird NL bullpens this year. Thanks for taking a deeper dive.
I should add, I looked at low leverage innings vs. homers and not low leverage innings versus scoring. High/low scoring may not matter as much as the homers. My hypothesis is homers tend to create blowouts and/or higher variance in scoring (i.e., low leverage situations) as runs score in bunches.
Also, the scoring environment should play into our definition of low/high leverage but probably does not.
For example, a two run lead at the 8th inning feels much more high leverage now with juiced balls compared to several years ago.
Fascinating article, thank you sir.
So teams have chosen to deploy the relievers (and position players, see yesterday’s article) in such a way that it makes blowouts worse than ever. I don’t know if this is a bad choice for an individual team, but it’s another case of a terrible result for a league. Same goes for teams treating entire seasons like a lost cause – rational for individual teams, not great for an entertainment product as a whole.
Do other sports have this problem? In the NBA “garbage time” is a real thing, but with infinite subs, the best players on both teams can always get back in, and at least you get scrubs vs scrubs which can be a bit entertaining. In the NHL this might happen a little, but the entire roster plays every game anyway aside from the backup goalie, who is typically only slightly worse than the starter. Bad players do get a bit more ice time during blowouts, but not much. In the NFL, subs are also infinite, but I think it’s most common for the team leading by a ton to take out the QB and other starters rather than the defense. I think?
Soccer is the closest baseball similarity, with limited subs that can’t return to games. I assume soccer teams would give a little playing time to the lesser players in a blowout, but they certainly don’t do the nonsense baseball is getting accustomed to and put a forward in goal or a goalie in to play centre.
Potential Gambling issues loom over all of this. If it becomes accepted that trailing teams sometimes throw the rest of the game, on purpose, that’s a dark path. Gambling happens closer to real-time now, so even if game results are barely affected, it could still get sketchy pretty quick.
The “nonsense” of baseball managers putting a position player on the mound makes more sense than a soccer manager putting a forward in goalie. The baseball manager wants to preserve his pitchers’ arms, which is a real issue. The soccer manager isn’t nearly as concerned with having a fatigued goalie.
As a Pirates fan, I believe I speak for most of the fanbase when I say we’d rather see Jose Osuna and his four-pitch aresenal and 92 mph heater take the mound over half of the bullpen who actually have a “P” on their baseball card.
“So teams have chosen to deploy the relievers (and position players, see yesterday’s article) in such a way that it makes blowouts worse than ever.”
There are some qualifiers that make me question the second part of that statement, though maybe there’s some truth to it:
(1) I’d hesitate to assume that these relievers on the losing end of blowouts are performing worse than the starters who would otherwise soak up those innings. Those starters are (and would have been historically) a skewed sample who we’d logically expect to perform worse than the average starter. Better quality starters are less likely to be in that situation. The sample that we end up with is skewed – and I think most likely heavily skewed – toward lower talent starters as well as starters having a really bad day.
(2) Part of it could also be teams with big leads late in games better understanding those are also low-leverage situations (defined as leverage index < 0.85 based on what I see at the Fangraphs glossary, which certainly also picks up having a big lead late) and using lesser quality relievers to soak up innings. That doesn't make blow-outs worse, though it would tend to prolong non-competitive games because those relievers allow more baserunners and runs.
Great article, interesting points. One question: are you excluding position players pitching? Given that they almost always pitch in game-states with near-zero leverage, and are so soooooo bad at pitching, I’m wondering how much they drag down overall low-LI pitcher performance. It would be interesting to compare population splits with that exclusion (slight chance I missed you discuss this in the article, but a quick control+F for position players didn’t show that).
Good point – some crossover analysis between this article and yesterday’s on position players pitching would great
https://blogs.fangraphs.com/weve-reached-peak-position-players-pitching/
“Via the Baseball-Reference Play Index, 55 of this year’s appearances have come with an aLI of .000 — too small to show up. For another 21, the aLI has ranged from .002 to .04, barely noticeable… For the other two, which came in extra-inning games, the aLI was well above 1.0.”
My methodology is a bit approximate, but the impact of position players is small. I calculate it to be about 0.04 points of FIP (4.61 without position players compared to 4.65 with them).
I’ll list the back-up information and assumptions.
A graph in this article shows approximately 25% of total 2019 MLB innings (to date) pitched by relievers in low leverage situations. That equates to approximately 8,400 innings (per the Fangraphs innings total using league stats for pitching).
Jay’s post gives a total of 80 pitching appearances so far this season for position players. He notes that the total FIP across these appearances is 8.36. I don’t see an innings total from Jay. I’ll assume 80 innings.
Eyeballing a graph in the post, it looks to me like 2019 reliever FIP in low leverage situations is 4.65.
I don’t see this brought up a ton on Fangraphs, but I think the expansion of the playoff format would have a drastic impact on the lack of parity and abundance of tanking teams. There are just too few teams making the playoffs and so it deters teams from fighting to get in and being left looking, If they expanded the playoff format we’d have less tanking teams, and more buyers on the FA market.
1. Expanding the playoffs to more teams cheapens the regular season. Why watch it, like the NBA or NHL, why not just wait for the playoffs?
2. The reason teams seem to be shifting away from the FA market is that FA’s are primarily good players who are 30+ and will very soon no longer be good players. Meanwhile, as Craig posted recently, teams have developed global pipelines of young talent and would rather play those 20+ players who are actually getting better.
3. Joe Joe above found that he couldn’t validate Craig’s hypothesis about parity when he looked only at the NL.
Parity is cyclical. The AL currently has a parity problem, but the bad teams are taking the right steps in trying to fix it, namely a multi-year re-development of their minor league talent pipelines instead of trying to short-cut it with 30+ yo FA’s, which wouldn’t work anyway.
1. Baseball already has the “cheapest” regular season based purely on the number of games and how many teams are out of a playoff race within a couple months of play.
2. That is a reason teams are shifting away from FA’s but the smaller amount of “buyers” in the market also affects this. Wins aren’t all worth the same. The wins that take you from fringe playoff contender to solid playoff bet are worth a lot. Right now teams are either all in or all out. Which is rational. The circumstances need to change to stop this behaviour from fucking up the game.
3. “This season, the top-to-almost-bottom competitive National League still has a majority of innings pitched in medium and high leverage situations, but in the American League, with less competition and a more top-and bottom-heavy setup, nearly two percentage points lower in terms of leverage.”
4. Parity is cyclical but baseball strategy and team building has drastically changed in the last 10 years. To ignore the trend is foolish. Baseball is a lot worse off when 40% of the teams in a league are biding their time.
Who are these 40% of MLB teams “biding their time”, which would mean 12 teams?
Thinking about this past off-season, I can list 7 teams that clearly fall into this category: Blue Jays, Mariners, Marlins, Orioles, Royals, Tigers, and White Sox.
I would add the Rangers, Pirates, and Mariners. I know the Rangers have a decent record, but that is primarily a result of getting lucky with reclamation projects rather than actually going for it.
I now see the comment you were referring in 3, disregard that point.
It seems like in baseball, the “smart moves” are often the least entertaining moves.
A) hitters going for walks and homers, while not minding high strikeout totals. Probably the right approach, but boring for fans.
B) base runners not wanting to risk steals. Probably smart, but boring for fans.
C) Teams going through lengthy rebuilds. Probably smart, but boring for fans.
This sentiment is correct but with more playoff spots more teams would be incentivized to try to win because you wouldnt need as high of a bar to clear. I’m not arguing against baseball teams acting rationally or being an old man yelling at a cloud because things are different. Baseball has the fewest playoff teams in major sports and now that teams are acting rationally that’s causing problems.
Nothing cheapens the regular season like a 5 game opening round series
I think increasing the number of play off teams might decrease the number of buyers – for a few reasons.
You’d be creating more “locks” for the play offs – because there are more teams who would qualify, you lower the win threshold to make it so teams who currently might be probable play off contenders become certain play off contenders. So you don’t need to upgrade to make it.
But also getting to the playoffs is now less valuable – because you have more teams standing in your way. So why would teams like the Dodgers, Astros, Yankees want to improve their teams further – moving future wins into pointless current wins – when it will have a much smaller effect on their World Series odds. Also, trading future wins becomes damaging – as you need fewer of those future wins to compete in the future, you don’t need to build a 90, 95+ win team when maybe even 80 will do.
I don’t think it will lead to more interest as well, as you’ll increase the number of teams who are certain to make it – I don’t think there are many Dodger, Astro or Yankee fans who are sweating on their team playing in October – and move the bubble teams from good/above average teams to above average/average/below average teams.
Phil raises good points about unintended consequences, and I think there are more general problems with Yaro’s thesis that expanded playoffs would take away from so-called “tanking” of teams deciding to undertake extreme teardown / rebuilds.
The teams that decide to follow that route are in bad enough situations that they don’t see a realistic path from their current situation to being even around a .500 true talent team over the next year or two. I therefore don’t see that expanding the playoffs by a couple of teams changes the decision-making by those teams expected to be really bad (e.g., the Royals or Tigers prior to this season) by all that much. And, we already see a fair number of examples where fringe-ish playoff contenders who are the next tier up do try to make some moves to improve their teams and aren’t just tearing down to try to contend years out in the future: think the Padres, Rangers, and Reds during the last off-season.
Said a bit differently, unless a playoff expansion is so big that it dilutes the post-season all the way to something like 75-win teams routinely making the playoffs, I don’t think that it moves the needle that much from how teams make decisions now, particularly if the concern is trying to get 100+ loss teams to make decisions with more focus on winning now.
Underlying this point is the reality is that it’s inherently very difficult to improve a baseball team from “really bad” to “decent” in a short period of 1 or 2 seasons. A big part of that is due to the reality that any individual baseball player only has so much value. (Looking at NBA win shares values, for example, LeBron James at his best was worth about 4 times the WAR of Mike Trout, taking into account that the NBA season is approximately half the length of the baseball season.) The other difficult part is that drafted players don’t contribute at the MLB-level until several years down the road (with very rare exceptions): a couple of really good drafts don’t mean that an MLB team gets better over a couple seasons, but rather that a team is much better 4 or 5 years from now.
whoa… this took an interesting turn. Great work!
This is really terrific. It’s gotta be incredibly satisfying as a writer to find such a clean explanation in your research.
Interesting. The data led in a different direction than I expected, especially at the end where it seems the main issue with bullpens is pitching bad relievers in greater frequency, which we’re seeing most in the AL due to the lack of competitiveness. The weird thing is that some of the worst bullpens are in the NL on contenders. The Nats for most of the season had literally one guy who didn’t suck. Aside from Lugo having a stellar month, the Mets bullpen has been almost as bad. Yet somehow the Braves, Marlins, and Phillies have made it a race to the bottom as well.
I guess what doesn’t make sense to me is that the worst of the really bad bullpens have been in the NL, many of them on contenders (Chicago I didn’t mention, St Louis has been kind of the best while somehow not fully convincing me they are actually good). Yet the article seems to suggest the bad teams in the AL are the real signal. I’m not sure how convinced I am yet.
I’m not seeing a solution here. Are you suggesting a return to using better relievers in lower leverage innings, such that there are more 6-3 games and fewer 15-3 games? Are you suggesting putting relievers on a rotation similar to starters rather than discriminating by leverage? It’s possible a more regular schedule would improve reliever performance generally, but it’s not the decision teams have made.
Maybe there’s no solution offered because it’s not a problem to begin with? Just a trend that bears analyzing.
The solution is already discussed in the article: ask starters to soak up more low leverage innings.
Great article and analysis! I’m sure there are many contributing factors causing this. However, I have to agree with Joe Joe that the scoring environment is playing a bigger role than the lack of parity. There have been a lot of blowout games between even the best teams this season.
Just since the All-Star break:
BOS def NYY 19-3
LAD def BOS 11-2
CLE def NYY 19-5
MIL def ATL 13-1
Cubs def MIL 11-4
WAS def ATL 13-4
OAK def Cubs 11-4
Cubs def OAK 11-1
PHIL def Cubs 11-1
HOU def OAK 11-1
AZ def TX 19-4
AZ def WAS 18-7
MIN def NYM 14-4
NYM def SF 11-4
The list could be much longer, but I just stopped looking after a while.
But is that different than other years?
From a cursory glance at 2018, it appears to be a significant difference.
Here’s what I found for 2018 playoff teams playing each other in the 2nd half of last season:
ATL def MIL 10-1
COL def ATL 11-5
BOS def CLE 10-4
NYY def COL 11-5
HOU def COL 12-1
HOU def LAD 14-0
HOU def OAK 11-4
LAD def MIL 11-2
LAD def MIL 21-5 (ouch!)
I believe that’s everything (notice the dominance of Houston, yet they lost in the post-season). My 2019 list was not all inclusive, but I’m not going through it again.
Listening to an Effectively Wild episode this morning, a 10-run Mercy rule after 7 would be enacted a greater percent of the time than ever before in 2019 (6% something).
I am quite surprised about the disparity between reliever IP% and reliever WAR% – this year is even more extreme with relievers at over 40% of the IP but under 20% of the WAR.
I know the standard for replacement relief pitcher is higher (so a lower FIP is required) but I’d have thought that the higher leverage innings would balance that out a bit. (Obviously there will be a lot of low leverage innings for relievers too).
On second thoughts, maybe this isn’t a surprise – given how anonymous and (with the shuttling between AAA and the majors for a lot of relievers) literally replaceable a lot of RPs are, it is quite fitting to see that reflected in the WAR.
I wonder how the WPA breakdown compares? If teams are being smart (though unfun to watch) about leverage, then relievers should be steady or even increasing on WPA.
just speaking for the Pirates, teams are not being smart about leverage. Since the break ongoing debacle of 8W-28L, Vazquez has appeared 11 times (3 of which were of the needs to get work variety in blowout defeats), so really 8 times in 36 games. All the while the bullpen has imploded repeatedly. They have consistently refused to use him in close games in the 7th or 8th, or even 9th at home to keep games within a run only to see the opponent expand the lead. Hurdle’s insistence on saving him for a save that never comes or might come tomorrow has been awful. As a season tix holder, it has been really frustrating to sit there and watch Chris Stratton pitch the 9th down by a run at home only to see 2 ore tacked on, then the Bucs score 2 in the 9th and still lose. Seems to have happened a handful of times in this stretch.
If you believe the math of leverage index, down a run late is a low leverage situation, at least at the start of an inning.
For context recall that the concept of LI is that 1 is average. FanGraphs defines low leverage as LI less than 0.85, high leverage as LI greater > 2.0, and medium leverage as in-between those two values.
From looking at the play logs of some recent games:
– Visiting team leading off the top of the 9th up 1 run is a PA with LI of 0.74 (i.e., low leverage). A key point for this one, which goes against a lot of people’s intuition, is that the home team’s win expectancy is only 22.0% going into the bottom of the 9th down 1 run. LI in this particular half-inning (Philadelphia and Boston on Tuesday) did reach 1.38 – medium leverage – for one particular PA with 2 outs and runners on 1st and 2nd.
– Home team leading off the bottom of the 8th up 1 run is a PA with LI of 0.61.
* the second situation has a lower LI than I initially wrote: it’s 0.53, not 0.61.
But it is higher leverage than not having him pitch at all, which has become the default decision by Hurdle.
That’s a very reasonable point.
“but in closer games, we still see a normal disparity between starters and relievers even as relievers have taken on more innings.”
It’s a bit tough to eyeball the numerical disparity for each year from the graph, but I don’t think that’s what we see in the graph of starter FIP vs. High/Medium Leverage Reliever FIP. There is still a disparity – the relievers perform better – but it doesn’t look like a “normal disparity”.
It looks like H/M Leverage Relievers in 2019 have an FIP that’s about 0.15 to 0.20 lower than starters. That appears to be well below the average disparity for seasons from 2010 onward, and possibly the smallest disparity of any of the last 10 seasons. It also appears – again eyeballing it – that the FIP gap in favor of H/M Leverage Relievers has been as large as 0.35 to 0.40 in some recent seasons, such as 2017.
“While a dilution of talent might be somewhat responsible for this change, the real issue is a lack of competition. Competitive teams (or a lower run-scoring environment) lead to competitive games”
Based on the information presented in this post, I would say that there’s just as much evidence to turn that around and say that “while a lack of competition might be somewhat responsible for this change, the real issue is dilution of talent”. I’m not saying that *has to be* correct, but I am saying that I don’t see any evidence that proves Craig’s opposite formulation.
A key question – to which I don’t see an answer (despite a lot of good information in this post) and which in fairness is very difficult (and maybe impossible) to answer – is just how much more could better quality relievers pitch than they do now (at least without suffering deterioration in performance and greater injury risk).
If the answer to that question is “not all that much”, then closer games would largely just mean that some of the same lower-performing relievers who now pitch low leverage innings would instead pitch high or medium leverage innings. If reliever share of total innings stayed constant, then we’d expect to see the overall FIP rise for H/M leverage innings pitched by relievers and also see the total FIP rise for low leverage innings pitched by relievers. That’s because, in the aggregate, the better performing relievers who currently pitch low leverage innings will instead pitch at least some – and I’d argue most likely the bulk – of the increased number of H/M leverage innings pitched by relievers.
A counter to my point above would be to say that, contra my claim, relievers currently pitching H/M Leverage Innings would instead handle the bulk of any sizable increase in the number of such innings. That is tough to analyze, but I’ll use the 2018 San Diego Padres as an example of why I don’t think that’s the case.
Last year’s Padres went 66-96 with a run differential of -150, which gave them a nearly identical 65-97 Pythag record (per Baseball Reference). They had 25 blowout losses per the Baseball Reference definition of losing by 5+ runs. And yet, despite those woes, it seems like they managed to max out (or at least close to max out) use of 3 good relievers while appropriately using them in medium and high leverage situations:
– Craig Stammen pitched 79 innings with a 2.19 FIP, totaling 2.2 fWAR. His average LI was 1.57.
– Kirby Yates pitched 63 innings with a 2.54 FIP, totaling 1.8 fWAR. His average LI was 1.68. Yates also spent 10 days on the IL during 2018.
– Brad Hand was traded to the Indians on July 19, just over 60% of the way through the season (99 games). He pitched 44.1 innings with the Padres (71 inning pace) and, while with the Padres, had a 3.18 FIP. He totaled 0.7 fWAR, a full season pace of 1.1 fWAR. His average LI while with the Padres was 2.24.
It’s only one data point, but it does demonstrate even a bad team, such as the 2018 Padres, maxing out (or at least getting very close to maxing out) usage of the good relievers that they did have on the roster.
They also had a fourth reliever, Adam Cimber, who demonstrates the point that a more competitive Padres team would most likely just have shifted innings from the “low leverage bucket” to the “high/medium leverage bucket” without having its better relievers pitch many (if any) additional innings. Cimber was traded to Cleveland with Hand and had been excellent with the Padres (2.33 FIP) and also heavily used (48.1 innings pitched, a 79 inning pace for the full season). His average LI with the Padres was only 0.79. With his innings pitched pace, however, it’s nearly impossible to think how a better Padres team would have increased his usage by any meaningful amount. Cimber simply would have pitched innings with a higher leverage index.
In short, I think that Craig has confounded *subsets of innings pitched (by leverage)* with *subsets of relievers (by quality)*. The two are of course correlated – at least if a manager makes reasonable decisions – but Craig’s argument ignores a “waterfall effect” that effective relievers are generally used more, even on teams that don’t win a lot of games. One issue is conflating low leverage index – which is defined as LI less than 0.85 per the Fangraphs glossary – with “blowout”. Looking at a game from yesterday, home team up by 1 run leading off the bottom of the 8th is a PA with LI of only 0.53. That’s low leverage, but clearly not a blowout, and it’s certainly not a situation where MLB managers think of using the worst guy in the bullpen to soak up an inning.
Ultimately, the argument against dilution assumes that relatively high quality relievers are sitting, well-rested, ready to pitch a substantially greater share of innings if only games were more competitive. I doubt that’s the case.
TLDR for the above:
This argument that dilution of talent isn’t the issue needs to – but doesn’t – address the key point that the share of innings pitched by relievers has gone from 35% to 41% since 2015. That’s an average of about 90 innings per team.
It’s a related point that that the quality of relief pitcher who pitches High/Medium Leverage Innings is most likely not independent of how many of those innings are pitched by relief pitchers. That share has increased by about 2% over the past five seasons, an average of about 30 innings per team. It’s not likely that means a closer and top set-up man pitching that many more innings. It most likely means that 3rd through 5th option bullpen types are more often pitching in situations that qualify as high/medium leverage. That doesn’t necessarily mean more innings for them either – just that those innings have moved between classifications on these graphs of “High/Medium Leverage” vs. “Low Leverage”.
The argument in the post’s final paragraph is a sophisticated form of question begging (I think without intending to be). It assumes that quality of relievers pitching high/medium leverage innings vs. low leverage innings is static. It’s tough to think that’s the case when there’s a change in total innings pitched by relievers, however.
The article is good try to get a handle on something that I think the dedicated fan who spends his time here at Fangraphs recognizes. It is clear that there appears to be an unprecedented number of complete breakdowns by many bullpens, but why should anybody be surprised. When worn out retreads like Brad Brach, now with his fourth team in two years, are pitching important innings for contending teams it is virtually certain to happen. Just last night the Nationals used Wander Suero (4.97ERA) in the 8th inning of a game they led 1-0. He should never, ever be pitching in a high leverage situation, but who else was there, and, needless to say, the Nats lost a game they needed to win and to the Pirates of all teams. But what is the right solution? Pure dumb luck seems like as good an answer as any. The Rockies spent heavily in 2018 to bring in Davis, McGee and Shaw and have gotten absolutely no return. All three have a negative WAR in at least one of their years with the Rockies. I accept the fact that it is early enough for things to get better, but the results from the Braves reconfiguring their pen are less than stellar. I write this as I watch Brad Hand blow a crucial game. This after watching both Tampa Bay and Seattle each blow 9th inning save situations earlier today. Any honest assessment would look at 8 man bullpens on 30 teams and come to the conclusion that there aren’t that many quality pitchers to fill those spots and some teams, the Nationals, who do not have a relief pitcher that has pitched only for them who has an ERA under 3.98, can’t find even a couple who are dependable.
I do think reliever volatility is an underrated aspect here. There are only a handful of relievers who are fully effective for more than 2-3 seasons in a row (Kimbrel, Jansen, Andrew Miller just barely).
I think you are right that teams mostly don’t really know how to get a collection of good relievers. There should probably be even more trading for relievers having good seasons in bad teams than there already is.
Listening to talking heads second guess the off-season decisions made by front offices in regards to bullpens is enough to make a fan regurgitate. These phony baloneys, that’s right, the same talk show mouths who were screaming that the Red Sox had to sign Cody Allen to replace Kimbrel, or that Edwin Diaz was the next reincarnation of Mariano are now babbling incoherently about Greene,Martin and Melancon in Atlanta. There are no answers, just guesses followed by a few prayers by the GM’s when they try to formulate the bullpen. The Red Sox didn’t recognize that Brandon Workman would suddenly become unhittable until it was too late, while the Rangers signed Jose LeClerc to a long-term deal to close, a position which he lost by mid April, but, who knows, the situations are just as likely to be exactly reversed by this time next year. Egads, as I write this Callaway is trying to say that Diaz is “trending in the right direction”, but wouldn’t commit to him being the closer tonight, only that he will be ready to pitch when his name is called. That says an awful lot about the plight of almost every major league bullpen. The manager sends somebody out there, then goes into a terror stricken, catatonic, trance while the game plays out.