Tim Lincecum Needs to Learn How to Pitch, Not Throw
Tim Lincecum’s resume contains the following items: 2 time Cy Young award winner, 4 time All-Star and twice World Series Champion. With all the achievements over the last 5 seasons, he was relegated to a long relief once the Giants made the playoffs because he was no longer effective as a starter. Lincecum’s problem is he can no longer just throw the ball across the plate and hope a batter just swings and misses. If he wants any hope of returning to be the starter he once was, he now needs to learn how to pitch.
In the past, Lincecum could use his fastball to blow away hitters. The problem with Timmy is he has aged and his velocity is down. His strikeouts followed his velocity on the downward spiral
Season: Average Fastball Speed, K%
2007: 94.2, 24%
2008: 94.1, 29%
2009: 92.4, 29%
2010: 91.3, 26%
2011: 92.3, 24%
2012: 90.4, 23%
As he lost velocity, his confidence for throwing strikes deminished.
Season: Zone% (Pitchf/x)
2007: 49%
2008: 50%
2009: 49%
2010: 48%
2011: 45%
2012: 45%
Pitchers can be productive with a Zone% (formula here) around 45%. The key is to limit the amount of pitches right down the middle of the plate. A pitcher needs to throw at the inside and outside edges of the strike zone. Pitches near the edge of the plate are hard to hit solidly. By comparing Lincecum to three other pitchers, Yovani Gallardo, Hiroki Kuroda and Jeremy Hellickson, the differences in their approach at throwing pitches in the strike zone and their results can be seen.
The quartet had similar Zone% in 2012, but the other three had better results than Lincecum.
| Name | Team | Zone% | K/9 | BB/9 | HR/9 | BABIP | LOB% | ERA | FIP |
| Hiroki Kuroda | Yankees | 46.6% | 6.8 | 2.1 | 1.0 | 0.281 | 77.7% | 3.32 | 3.86 |
| Tim Lincecum | Giants | 45.2% | 9.2 | 4.4 | 1.1 | 0.309 | 67.8% | 5.18 | 4.18 |
| Yovani Gallardo | Brewers | 45.2% | 9.0 | 3.6 | 1.2 | 0.290 | 78.4% | 3.66 | 3.94 |
| Jeremy Hellickson | Rays | 43.4% | 6.3 | 3.0 | 1.3 | 0.261 | 82.7% | 3.10 | 4.60 |
All the players, besides Lincecum, had a low BABIP leading to a good LOB% and therefore an ERA lower than there FIP. The key difference between these pitchers, was that everyone, but Lincecum, threw a higher of percentage of pitches at the inside and outside part of the strike zone (I will call it Edge%, more on it in the Appendix)
Pitcher: Edge %
Tim Lincecum: 12.7%
Yovani Gallardo: 15.9%
Jeremy Hellickson: 16.0%
Hiroki Kuroda: 17.5%
Lincecum’s Edge% was the lowest among all pitchers who threw over 1400 pitches last season. He was not able to pitch to the edges of the plate. Instead he was just trying to throw it across the plate and hope no one hit it. The problem is batters did hit it. The difference may not seem like much, but his Edge% is 5% points lower compared to Kuroda’s Edge%. If BABIP was a percentage (.309 BABIP = 30.9%), they would have an almost 4% point difference. A few less meat balls a game can lead to significant improvements over the course of a season.
Besides looking at the difference numerically, here are each of the pitcher’s location heat maps vs. right-handed hitters.
It can be seen from the images how each pitcher works the zone against RHH. Kuroda pounds the inside part of the plate. Gallardo lives on the outside part. Hellickson goes both in and out. And Lincecum just throws in right down the middle. It is easy to guess who had the worst results.
Lincecum didn’t aways have as much of a problem throwing to the edge:
Season: Edge%
2012: 12.7%
2011: 12.9%
2010: 13.7%
2009: 14.7%
2008: 14.1%
He has gotten worse at putting the ball on the edges as he has aged, but he was never good at it. He has never been near the league average value which hovers around 16%.
If Lincecum is going to make it as a pitcher, he is going to have to figure out a way to pitch to the edges instead of just throwing across the plate. He no longer has the velocity to throw it past players. Besides helping his balled ball data, the new command could help him lower his high walk rate. It may be tough for him change the way he has pitched his whole life, but right now the old method is not working. If he is going to want to be a productive pitcher again, he is going to have to learn to pitch to the edges of the plate instead of throwing right down the middle.
.
.
.
Appendix
The Edge% values are taken from two areas of the called strike zone, one on each side of the plate. To get the area, it is from the edge of the called strike zone (Zone%) and to the center of the plate 0.4 feet.
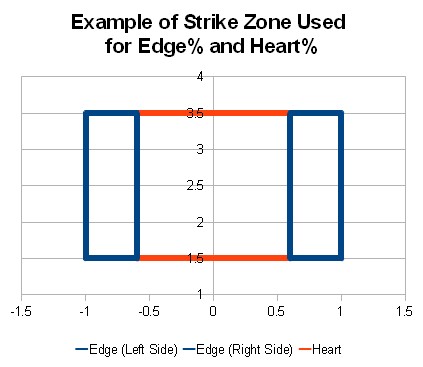
I looked at other measurements and found the .4 worked the best. Bill Petti (who has been working with me on this project) and/or I will come up with a more detailed analysis of what amount should the zone be moved in to find the Edge%, but this value will work for now. The rest of the strike zone I called the Heart(%). The pitch results in the heart are almost always strikes (94% of the time called strike) vice the edges where a pitch is called a strike 2/3 of the time. Pitches in the heart though are more like to go for hits.
Here are some details on the values.
League Averages
| Season | Edge % | Heart% | Outside % |
| 2007 | 16.6% | 33.7% | 52.8% |
| 2008 | 16.1% | 33.6% | 50.7% |
| 2009 | 15.9% | 33.9% | 50.6% |
| 2010 | 15.9% | 33.8% | 50.7% |
| 2011 | 15.8% | 33.6% | 51.0% |
| 2012 | 15.6% | 33.2% | 51.6% |
Pitch Result Data
| Stat | Heart% | Edge% | Outside% |
| BABIP | 0.310 | 0.289 | 0.273 |
| HR/FB | 14.0% | 10.5% | 8.1% |
| % Called Strikes vice Balls | 93.6% | 68.3% | 7.9% |
Leaderboards for Zone%
2012 Data
2011 Data
2010 Data
2009 Data
2008 Data
Jeff, one of the authors of the fantasy baseball guide,The Process, writes for RotoGraphs, The Hardball Times, Rotowire, Baseball America, and BaseballHQ. He has been nominated for two SABR Analytics Research Award for Contemporary Analysis and won it in 2013 in tandem with Bill Petti. He has won four FSWA Awards including on for his Mining the News series. He's won Tout Wars three times, LABR twice, and got his first NFBC Main Event win in 2021. Follow him on Twitter @jeffwzimmerman.
“The pitch results in the heart are almost always strikes (94% of the time called strike) vice the edges where a pitch is called a strike 2/3 of the time. Pitches in the heart though are more like to go for hits.”
Is this another concrete and measurable thing to refine BABIP with? I hope so — because it would reconcile a lot of what those who hate BABIP complain about.
Maybe, Maybe so. A little more work needs to be done, mainly nailing down the exact Edge Zone. Bill Petti will also be looking at this subject in the next couple days.
Could this explain why Zack Grenike have consistently had BABIP higher than league average? Before he’s traded to Angels I thought that is because his teams simply bad in defense. But then he sill had a terrible BABIP last year. If his Edge% is lower than league average, it might help in explaining something.
Right. A pitcher who throws the ball down the middle is going to get a high percentage of his outs via K and walk very few guys.
When he does get hit, hes going to get crushed.
You’ll see high BABIP, high K, low BB, and assume its bad luck, when its not.