Yu Darvish’s 2019 Has Been Wild
Take one look at the numbers, and Yu Darvish is having a pretty rough 2019. A 5.40 ERA is bad enough, but he’s actually outperforming his FIP, which sits at a grisly 6.49. While it’s only eight starts, a small enough sample that I’d normally counsel patience, Cubs fans surely don’t feel that way — 16 games into his Cubs career after an injury-shortened 2018, Darvish has compiled a 5.16 ERA (5.64 FIP) and been worth -0.1 fWAR. A closer look at Darvish, however, makes the picture far more muddled. Despite his undeniably rough start, silver linings abound in his underlying statistics.
The story with Darvish has to start with walks. No one would ever call him a control pitcher (he’s had a walk rate higher than league average in five of his seven seasons), but he’s veered from effectively wild to caricature this year. His 19.3% walk rate is not only first in baseball, it’s first in baseball by a comical margin — among pitchers with 30 IP, he’s as far ahead of second-place Brad Keller as Keller is ahead of 54th-place James Paxton. It’s early in the season to start considering Darvish’s place in history, but full-season walk rates like these haven’t been seen since young Randy Johnson.
Let’s leave aside the walks for a moment, though. Take those out of the picture, and you might struggle to differentiate Darvish’s 2019 from the rest of his spectacular career. Here are Darvish’s groundball/fly ball ratio and hard-hit rate for every year of his career.
| Year | GB/FB | Hard Hit % |
|---|---|---|
| 2012 | 1.46 | 25.6 |
| 2013 | 1.08 | 30.5 |
| 2014 | 0.89 | 32.5 |
| 2016 | 1.01 | 30.0 |
| 2017 | 1.11 | 33.1 |
| 2018 | 0.95 | 27.4 |
| 2019 | 1.74 | 28.6 |
Darvish has not only amassed an average-ish hard-hit rate, he’s getting grounders like he never has in his career. Those are hardly the numbers of a pitcher with a 5-handle ERA. What gives?
Well, one way to get your ERA up despite decent batted ball numbers is to walk everyone, and we know Darvish is doing that. Another way to run results worse than your top-level batted ball stats is to allow a ton of home runs, and he’s doing that as well; his 29.6% HR/FB is second only to Dakota Hudson’s 31%. Darvish has had homer-prone seasons before (Cubs fans surely remember last year’s 17.5% HR/FB rate as an unwelcome harbinger of 2019), but nothing like this.
In a small sample, it’s generally correct to assume outliers will regress to the mean, but with the advent of Statcast, we can do better. If some new aspect of Darvish’s pitching is leading him to be extremely homer-prone, we’d expect to see it in his xwOBA allowed on contact — the expected value of balls opponents put in play based on their exit velocity and launch angle. Here are Darvish’s wOBA and xwOBA allowed on contact every year since Statcast began tracking batted balls:
| Year | wOBA | xwOBA |
|---|---|---|
| 2016 | .366 | .344 |
| 2017 | .371 | .375 |
| 2018 | .406 | .385 |
| 2019 | .425 | .386 |
Now, Darvish is allowing better quality of contact than he did in his return from Tommy John surgery in 2016, but he’s barely worse, in terms of expected damage done, than his cromulent 2017, when he ran a far more palatable 15.1% HR/FB. Even accounting for all the home run luck, Darvish’s results on contact haven’t been completely unplayable — Noah Syndergaard, Carlos Carrasco, and Corey Kluber have allowed higher wOBA’s on contact this year.
If you’d prefer to look at his xwOBA on contact, Darvish does even better: Trevor Bauer, Patrick Corbin, Max Scherzer, Clayton Kershaw, Justin Verlander, and Gerrit Cole all have worse expected results on contact than Darvish. In 2019, of course, “expected” is a complicated term when it comes to batted balls, what with the seemingly livelier baseball and the all-time high HR/FB rate, but for all that, leaguewide xWOBA on contact is higher than wOBA on contact this year. While more fly balls are becoming home runs than ever, it appears that Darvish is getting disproportionately unlucky on that account.
Think of it that way, and Darvish’s 2019 looks very different. The narrative of a pitcher who loses it isn’t complex, and doesn’t require a deep dive. Darvish was good, and then later he wasn’t. His strikeout rate fell and his walk rate rose, and he started giving up home runs like a washed Rockies pitcher. Even his average fastball velocity is down, you might say — clearly he’s just lost it. There are problems with all of those narratives, though, and not just the home run spike.
Let’s look at the fastball point for a second, because it illustrates one of the dangers of early-season analysis. Take a look at Darvish’s average fastball velocity each May of his career, as well as his full-season tallies:
| Year | May (mph) | Full Season (mph) |
|---|---|---|
| 2012 | 94.0 | 93.7 |
| 2013 | 94.5 | 93.6 |
| 2014 | 93.5 | 93.4 |
| 2016 | 96.7 | 94.9 |
| 2017 | 95.2 | 94.6 |
| 2018 | 95.2 | 94.8 |
| 2019 | 94.7 | 93.7 |
Now, maybe Darvish has lost a tick. His May velocity is as low as it’s been since Tommy John surgery. It doesn’t seem like an alarming drop, though, and his full-season numbers are dragged down by low velocities in March and April. It’s too early to say much of anything about whether his fastball has changed.
When you strip out the batted ball results (unlucky noise) and the fastball decline (nonexistent), the Darvish story changes tone. It’s not a story of a pitcher simultaneously getting worse at everything. Rather, what’s happened here is that a top-line starter suddenly started walking the whole world with little decline in the rest of his observable results. Let’s take a deep dive into his control, because it appears that that’s the only thing to meaningfully change since Darvish’s triumphant return in 2016 and effective 2017.
Look at most pitchers who suddenly start walking everyone while losing strikeouts, and you’ll see poor swinging strike rates. The easiest way to walk more batters is to stop being able to throw a pitch by them for a strikeout — if the batter fouls enough balls off, you’ll eventually miss out of the zone or let him put it in play, trading strikeouts for walks and hits. That isn’t the case with Darvish, whose 12.3% swinging strike rate in 2019 is comfortably better than league average.
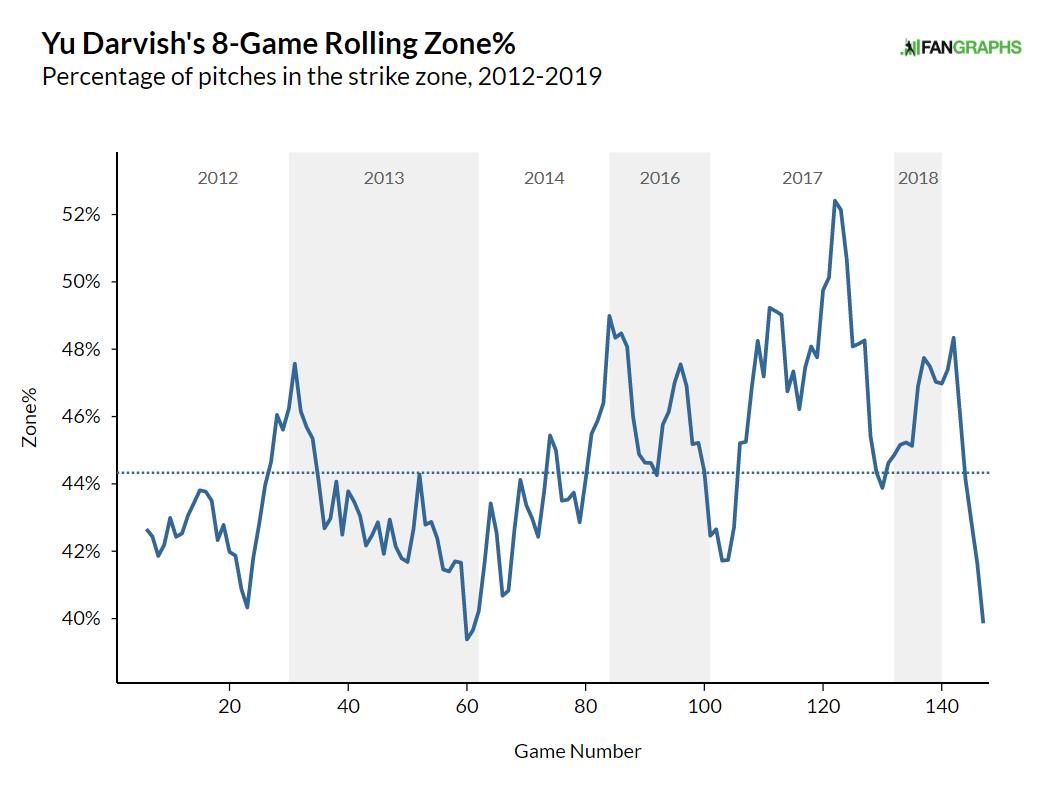
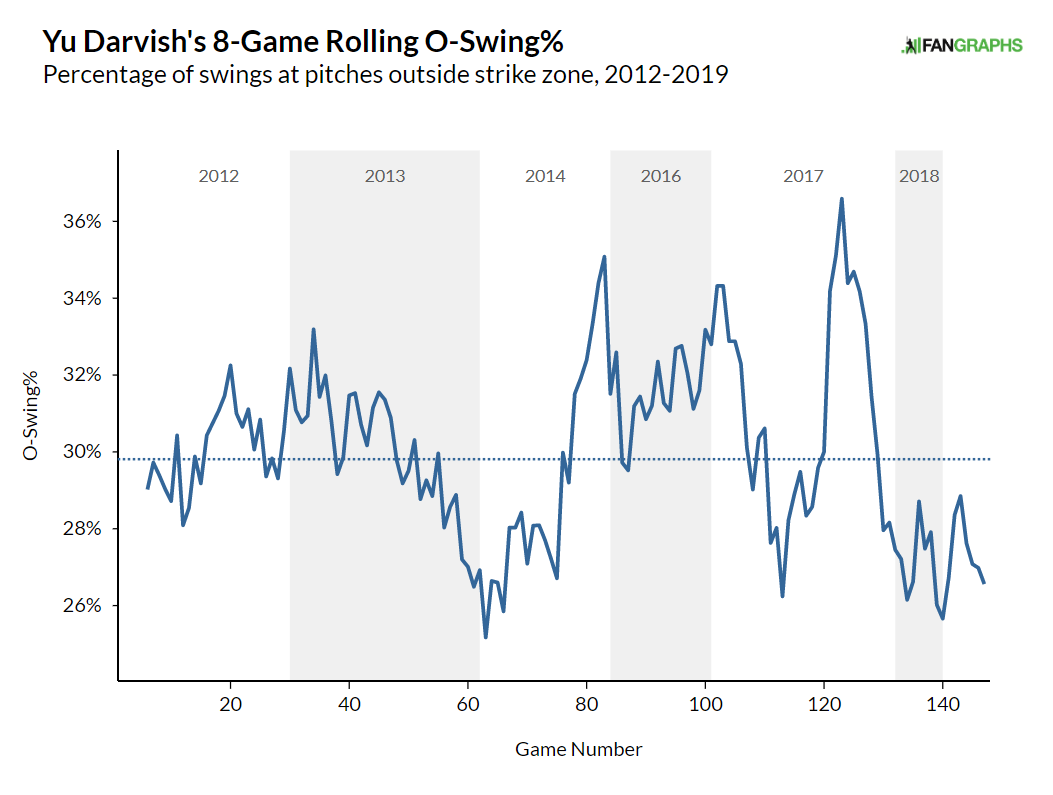
Indeed, when batters swing at pitches out of the strike zone, they’re making contact at the lowest rate in Darvish’s career. When he induces a bad swing, in other words, he finishes the job. What’s causing the walks, then? Well, it’s not rocket science, but Darvish has started throwing fewer pitches in the strike zone, and batters aren’t playing along. Eight games into the 2019 season, he’s almost never had such a zone-light stretch in his career.
Even then, he might have gotten away with it, if it weren’t for those meddling kids — err, batters — who have cut back on their out-of-zone swings in response to Darvish’s wildness. He’s not quite having a career-worst stretch when it comes to out-of-zone swing rate, but it’s not far off.
That wildness, and batters’ increasing ability to lay off pitches outside the zone, starts from the first pitch of each at-bat. Darvish’s first-strike percentage is as low as it’s ever been, and his zone rate on 0-0 pitches isn’t far off.
| Year | Zone% | Strike% |
|---|---|---|
| 2012 | 55.6% | 58.5% |
| 2013 | 47.3% | 57.3% |
| 2014 | 54.5% | 61.8% |
| 2016 | 51.9% | 58.2% |
| 2017 | 53.1% | 58.9% |
| 2018 | 52.5% | 55.6% |
| 2019 | 48.0% | 52.6% |
Now, many times the analysis would reach a satisfactory conclusion at about this point. The pitcher’s stuff is every bit as good, he just started nibbling too much on 0-0 and that was that. Trim a few breaking balls and throw some fastballs in there on the first pitch, et voila, old Darvish. Just one problem, though — it doesn’t appear to be a fastball problem.
| Year | FB% | FB% (ex-cutters) |
|---|---|---|
| 2012 | 71.7% | 54.6% |
| 2013 | 69.4% | 46.6% |
| 2014 | 79.3% | 65.8% |
| 2016 | 71.6% | 60.6% |
| 2017 | 76.2% | 60.9% |
| 2018 | 78.5% | 62.4% |
| 2019 | 78.4% | 57.9% |
Throughout his career, Darvish has thrown a blend of two-seam, four-seam, and cut fastballs on the first pitch. He hasn’t tinkered with the pitch mix all that much in the past two years. With the exception of trading a handful of sinkers for cutters, he’s throwing the same pitches. He’s just missing a little more than usual.
So, where does this all leave us? Darvish is throwing fewer strikes for some reason, and batters are swinging at his pitches less often, also for some reason. Despite all that, though, his stuff is getting as many swings and misses as ever. What should we expect for the balance of the year?
This isn’t a satisfying conclusion, but I think there’s no reason to panic with Darvish. Has his 2019 been terrible so far? Absolutely. It’s come without a clear decline in skill, though — his pitches mostly all move the same, he’s inducing whiffs as well as he ever has, and he’s even getting grounders at a high rate for once. If he could just stop walking the world, the rest of his stats would fall into place.
Even when it comes to his command, there’s reason to think that Darvish is getting unlucky. He doesn’t throw strikes at an unfathomably low rate — 27 pitchers who have thrown at least 30 innings this year have a lower zone percentage, and 17 of those pitchers are getting fewer swinging strikes than Darvish. Twenty pitchers induce fewer swings on pitches out of the strike zone. If it weren’t for the gaudy walk rate, you might never notice Darvish’s underlying numbers.
Just as a quick mental check, I regressed swing rates, zone rate, and contact rate against 2018 K-BB rates. Darvish’s numbers equate, per the regression, to a 17% K-BB rate. That’s not quite his career 20% gap, but it’s miles better than 2019’s 6.4% and pretty close to Depth Charts’ rest-of-season projection. A 17% K-BB, league-average results on contact, a fastball around 95 mph with an array of secondary pitches — that sounds like the Yu Darvish I’ve known for years.
Sometimes statistics are frustrating. I look at Yu Darvish’s 2019 and I expect to find a signal buried there. He’s been spectacularly bad! He’s walked four or more batters in six of his eight starts. He’s giving up home runs on a third of his fly balls. Something must have changed! Something must be new and predictive! In short, though, it hasn’t. Yu Darvish, right now, doesn’t look all that different from Yu Darvish before 2019, minus the eight starts of awful results. The world doesn’t always cooperate with the brain’s desire for an overarching conclusion. Sometimes a bad start is just a bad start.
Ben is a writer at FanGraphs. He can be found on Bluesky @benclemens.
“It’s early in the season to start considering Darvish’s place in history, but full-season walk rates like these haven’t been seen since young Randy Johnson.”
See Tyler Chatwood’s 19.6 BB% over 24 appearances (20 starts) in 2018. Cubs fans certainly remember.
He had some stat last year that broke the calculations Fangraphs uses for it. K-BB%, I think. Couldn’t go negative.
Besides, most pitchers that put up such horrendous walk rates are removed from the rotation before they can make enough starts to qualify for full season rate stats.
“Spectacular” career?
He’s the all time K/9 leader among starters (min. 500 IP) and 2nd in K%. I would say that that alone is spectacular. We also shouldn’t forget his 5 straight seasons with a sub-2 ERA in Japan before he was posted.
His Japan career is irrelevant here, since the author’s not including any of those stats in his argument.
And K stats by themselves don’t create value.
Darvish’s best season ranks in fWAR are 8th, 11th and 16th. His high is 4.7 fWAR, which is the 59th-best season from 2012-17.
He’s never been a CYA contender. His postseason stats are bad, and even if you ignore the 2 disasters in the 2017 WS, the rest is merely decent.
And even in the “spectacle” sense of the word … He hasn’t thrown a no-hitter; 18 others did from 2012-17. His high in Ks is 15, one of 24 such games in that span, and tied for 10th-most. His best Game Scores rank 20th and 90th, with 2 others in the top 420. He has 1 of the 301 shutouts from 2012-17; 68 guys had more.
I’m not demeaning him. I’m just opposing grade inflation. Before joining the Cubs, he was consistently good, sometimes very good. But it’s not a spectacular career, by any measure that makes sense to me. And puffery in an intro is off-putting, at best.
Would you settle for “sometimes spectacular”? I did have the same thought for an instant…and then moved on
I would have just moved on, too, but I feel this column lacks objectivity in other ways.
Why is it mentioned that Darvish’s wOBA is lower than those of Syndergaard, Carrasco and Kluber? They happen to be big names, but having bad years so far — ERAs of 5.14, 4.91 and 5.80, collectively right around Darvish’s 5.40. What’s the point of referencing them? It seems fishy — distracting at best, misleading at worst.
“He’s never been a CYA contender”
Darvish finished 2nd in the Cy Young in 2013
He had zero 1st-place votes. Scherzer had 28 of 30, and the others went to Anibal Sanchez and Chris Sale.
If a “contender” can be someone whom nobody thought deserved the award, I guess I’ve misunderstood the term.
I’m not usually one to speculate about mental issues, but Darvish is a guy I’m convinced has become a bit of a head case after the big contract and the disastrous 2018.
Wild as in lacking control but also exhibiting unusual characteristics. Ah,
Ain’t English just grand?
I think it’s worth noting that xFIP is above 5. Saying that it’s just a problem with him walking too many batters is fine and dandy, but it’s a really big problem!
Oh yeah totally agree. At his current walk rate, the whole package doesn’t work. I just don’t really believe the walk rate, and if that snaps back at least somewhat, the rest of his skills still play.
There have been pitchers to lose control, Rick Ankiel, Steve Blass, Joe Cowley and Mark Wohlers. However, they really lost control and were pretty much done. Others that had serious control issues would later be diagnosed with injuries. There is Oliver Perez who was able to salvage his career. So yeah, I wouldn’t rule out a comeback from Darvish given the total package.
Whenever these kinds of numbers show up the first thing that pops into my mind is Steve Blass disease but a look at the log of this year’s starts doesn’t appear to be that catastrophic. WP’s(4) and HBP’s (3) often give us a clue but these numbers are not extreme. It doesn’t seem like Darvish has the “word that may never be spoken”.
You can expect some positive regression to the mean, sure, but walking almost one guy per inning is so bad it’s hard to imagine he just snaps out of it “enough” to get back to his old self, or anything like it.
If the BB rate goes back to a bad (but not obscene) 4 per 9 the rest of the way and everything else sticks, he’s probably a low to mid 3 ERA pitcher
I think you’re overestimating the regression’s results. Even if that does happen (which is a notable “if”), you’re still probably looking at an ERA over 4.00 the rest of the way.
xFIP and FIP numbers are gonna be highly influenced by his BB rate though.
Even if you are mowing down batters like Hader, if your BB rate is 8 per 9, you’re going to have a high FIP/xFIP
It’s worth mentioning that Willson Contreras is absolutely terrible at framing pitches, and (this is just me, watching baseball on TV) it seems like it bothers Darvish more than it does most pitchers. Taylor Davis appears to be his new personal catcher, with mixed (but somewhat encouraging) results so far.
Rangers fans: did Darvish have a caddy in Texas? Is this a thing with him?
I don’t think you can separate Darvish’s control problem from any other part of the analysis.
Firstly, show me a guy walking one in five batters … with extremely low strike rate, and the highest % of 2-0 counts, by far … yeah, I’ll bet his ERA is over 5, regardless of ANY other data.
But more specifically … He’s getting absolutely murdered on first pitches — 2.220 OPS, by far the worst of anyone with 15+ such PAs. Maybe he’s grooved a lot of those, desperate not to fall behind.
If you just take out those 20 PAs, the rest of his batted results are wonderful — .165 BA, .287 SLG. Of course, the .360 OBP is still a problem.
But these things aren’t independent. A pitcher struggling badly with control is often liable to “lay one in there,” hoping to steal a strike from a batter not expecting one. I don’t know that’s happening with Darvish, but I like it better than “bad luck.” When you don’t throw strikes, bad luck follows.
Yes, he did briefly mention that part, which is why he concluded that a walk rate correction would result in Yarvish looking more like himself, since it would theoretically also somewhat decrease his rate of home runs and other hard contact.
Although, it remains to be seen whether or not he can regain his control, and if he does will it be by enough to drop those contact rates to a satisfactory level.
Have you compared gaps between wOBA and xwOBA on the basis of control, and/or pull rate?
I wouldn’t be surprised if pitchers struggling with location tend to fare worse than control masters with the same average EV and LA. They probably get pulled more than others.
Darvish is getting pulled a LOT more now than in 2017 — 38.5% vs. 27.6%. All the movement has come from his up-the-middle rate.
I assume that pulled “barrels” produce more hits and HRs than others with the same EV/LA.
Re: “the easiest way to walk more batters is to stop being able to throw a pitch past them for a strikeout.” — is this a known fact that doesn’t need to be supported?
BB% generally has a positive correlation with K%, among *different* pitchers in this era.
But do data show that same-pitcher BB% rise from year to year correlates with lower K or swing-and-miss rate? I just checked a handful of recent high rise in BB% by the same pitcher, and there was no clear trend in K rates. Some K% went down, mostly older guys. Some went up or held steady.
Seems to me the easiest way to walk more batters is to throw fewer strikes. Darvish is doing that. Even in his prime, he had only average rates of strikes and swings. This year he’s way below average. Maybe he’s crossed a tipping point.
Maybe his breaking pitches are not as good or hitters have learned to recognize them and lay off? Something is amiss he’s not nearly as good as he was when with Texas.
He hasn’t been as good as he was before TJ generally
Ben, you have covered many of the bases attempting to explain the fact that most of the metrics would argue for a better performance. One very simple explanation could be that he is once again tipping his pitches. He did this with Texas and again did it in the 2017 World Series (so much so that it became a Sports Ill. article (link below if your messages allow links.) Somebody should get out the video and carefully look. This would explain both the HRs AND the lack of out of zone swings!
https://www.si.com/mlb/2017/12/11/dodgers-yu-darvish-tipped-pitches-world-series-astros
I’m wondering if we will eventually hear that the early season blister issue continues to bother him.
He walked the most batters other than this year in 2018 when he was injured. He is likely not back to full health and I can see no reason he will walk better than what he did last year which will not help enough to make him even decent. I came here to find persuasive evidence that he’ll get his control back to pre-2018 numbers and I’m not finding it.
But he wasn’t injured yet when he put up those terrible 2018 numbers. He then didn’t pitch for the rest of the season after he did get hurt.
Still, your point that this season is a continuation of 2018 is valid, just for the wrong reason.
He generally has no idea where his fastball is going. You don’t need any stats – just watch him pitch.
It’s been two bad starts (to the season) in a row, though. Darvish was also terrible before he got hurt last year. Plus, those (x)wOBA numbers do show that he has gotten somewhat worse in the amount of hard contact (both actual and expected results) he’s given up in 2018 and 2019.