
Yuli Gurriel May Be Trying to Do a Little Too Much
Because his name is right there in the title of the piece, I won’t ask you to play that little game where I give you two anonymized batting lines and ask you to guess who they are, only to reveal that one is Yuli Gurriel and the other is the re-animated corpse of Ike Van Zandt or something like that. I’ll just give you two batting lines, both from Gurriel, and ask you to note the difference in quality between the two:
| Seasons | PA | BB% | K% | wOBA |
|---|---|---|---|---|
| 2016-18 | 1,274 | 3.9% | 10.8% | .329 |
| 2019 | 254 | 4.7% | 10.2% | .282 |
That 47-point drop in wOBA doesn’t really give you a sense of relative performance, so let me put this another way: Gurriel’s wOBA from 2016-18 fell into the 38th percentile among players with as many plate appearances over that span. Fine but hardly exceptional. His wOBA this year — again only among those players with as many trips to the plate — falls into the third percentile. Only José Ramírez (with a .262 wOBA) and Starlin Castro (.249) have done worse.
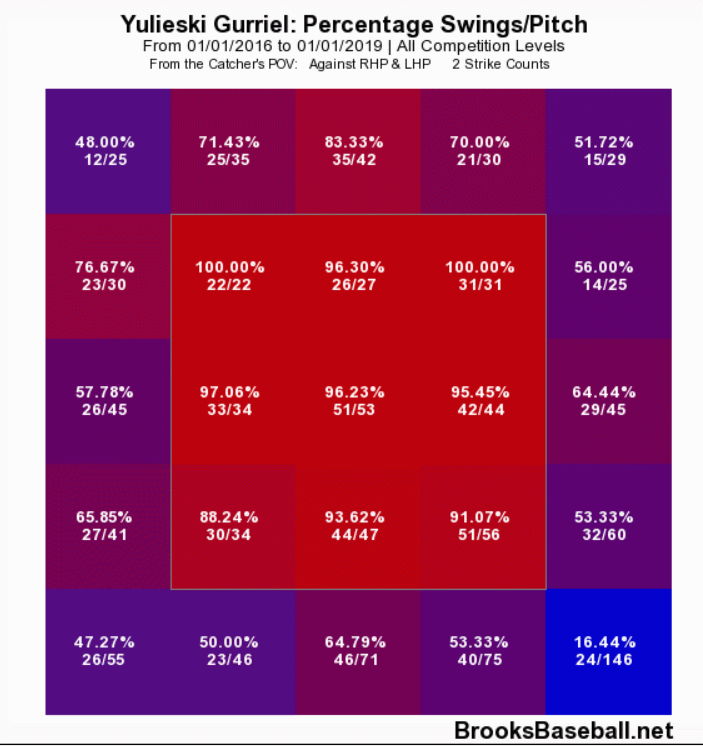
Curiously, though, Gurriel’s walk rate and strikeout rate have both improved — albeit modestly — even as his overall performance has suffered. Little else about his plate discipline numbers seems much different this year than last, either. Gurriel’s swing rate last year was 50.3%, and this year it’s 49.1%. Last year, he made contact 85.9% of the time. This year, he’s improved to 87.1%. The numbers don’t change much when you look inside or outside of the strike zone, either, and where they do change it’s often for the better. So what’s going on? I think a clue is in the kinds of strikeouts he’s getting. Here’s a chart that shows Gurriel’s swing rates on all the pitches he saw with two strikes from 2016-2018:
And here is that same chart, but from this season:
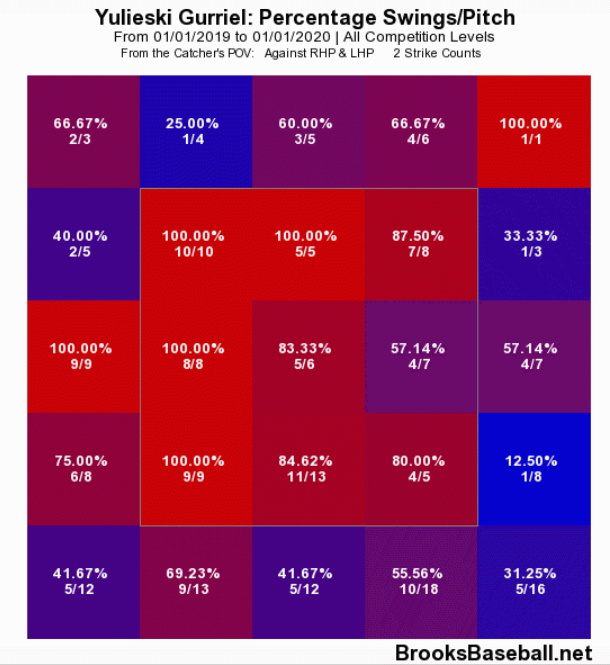
I’ll save you the effort of adding up the swing rates on all the pitches inside the strike zone and tell you that from 2016-18, Gurriel saw 348 pitches in the zone with two strikes and swung at almost all of them: 330, or 95%. Most of those were fastballs. Some of the time, he struck out. Other times, he made hard contact. This year, by contrast, Gurriel has swung at 63 of 71 such pitches, or 89%. That six-point drop might not seem like a huge deal, but it’s meant that a whopping 39% of Gurriel’s strikeouts this year have been looking, which is by far the highest figure of his four-year career (his career mark is 23.2%, and last year’s 29% figure was by 11 points a career high). It’s also meant that Gurriel has made less contact when behind in the count this year than ever before.
I’m not sure what to ascribe these changes to. One possibility could be a general discomfort at being called upon to play around the diamond more often due to injuries to George Springer, Carlos Correa, and José Altuve. On its face, that argument doesn’t make much sense: Gurriel played 46 games away from first base even last season, and put up perfectly acceptable offensive numbers, and he’s moved around the infield since his Cuban playing days. Perhaps, though, this season’s situation is different. This year, Gurriel is fielding different positions not because it’s the best matchup given the Astros’ opponents but because A.J. Hinch has to play him there due to injury. That could mean Gurriel is being put into game situations in which he’s not comfortable and to which he hasn’t been exposed before. And he’s perhaps thinking just a little bit too hard about what he has to produce there while his talented teammates recover from injury.
If that’s true, it could explain other changes to Gurriel’s game as well. Prior to 2019, Gurriels’ average launch angle sat right around 10 degrees, but that average masked a distribution that showed that about a quarter of his hits went straight forward on a line (a zero degree launch angle) while another quarter left the bat at about 20 degrees — just enough to get over the heads of the infielders and drop in for hits. This year, his average launch angle has increased — to 15.4 degrees — while the range of angles at which he hits the ball has narrowed. Almost gone are the balls hit straight on a line, and significantly diminished are the 20 degree knocks. More and more of Gurriel’s hits, as a percentage, are coming in that dangerous middle zone where balls in play are somewhat more likely to turn into outs. As a consequence, Gurriel’s .264 BABIP this season is the lowest of his career, even as his hard-hit and contact rates have stayed level.
Whatever the cause, things can really only go up from here: Gurriel’s -0.4 WAR is among the 10 worst in the league among qualified players. And there are, despite the poor results, a lot of things going right for Gurriel. His hard-hit rate, contact rate, strikeout rate, and walk rate suggest that his eye at the plate and his ability to do damage to the ball when he makes contact are all working just fine. Perhaps he is trying to lift the ball a little more than is necessary to do damage at the plate, and perhaps that approach — combined with a newfound passivity possibly born of a little bit of overthinking — has turned Gurriel’s performance this year on its head. If that’s the case, it can be remedied: Gurriel’s wOBA has been as low as this before and still rebounded:
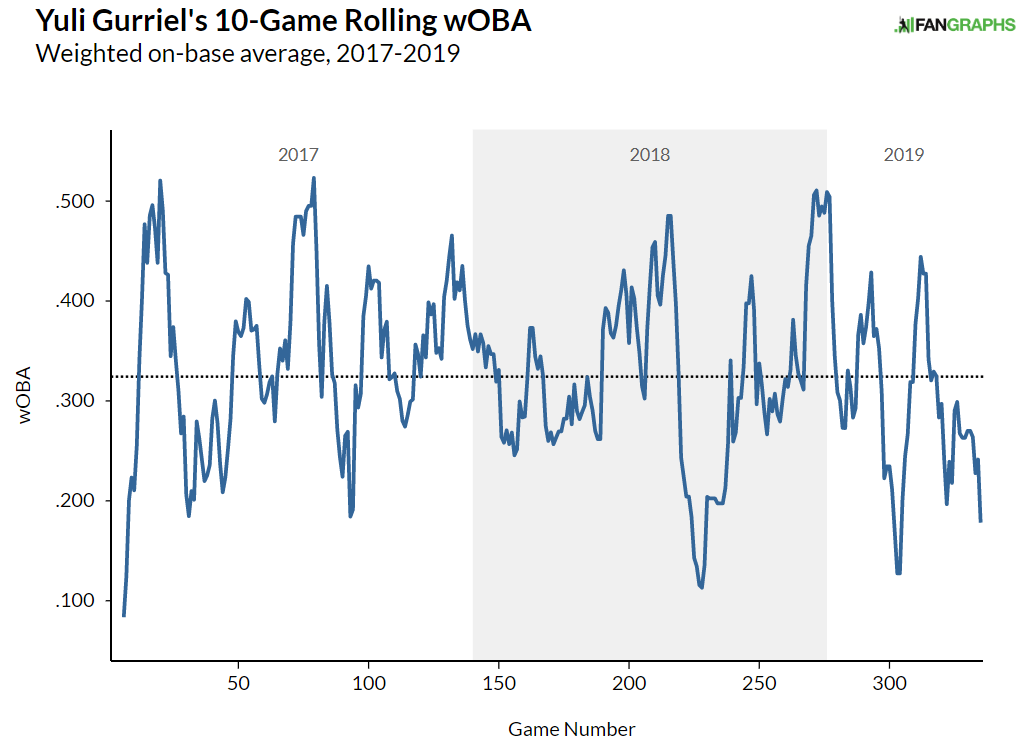
With a little perseverance, then — and perhaps a few more swings on strikes in the zone — he could be back to normal for the stretch run. And if this run of poor performance is the result of Gurriel trying to do a little too much at the plate? Well, maybe it’s all right to relax a little bit. All the evidence suggests that he and the Astros are going to be just fine.
Rian Watt is a contributor to FanGraphs based in Seattle. His work has appeared at Vice, Baseball Prospectus, The Athletic, FiveThirtyEight, and some other places too. By day, he works with communities around the world to end homelessness.
If his wOBA falls into the third percentile, and only JRam and Starlin are worse, does that mean we’re only dealing with 100 qualified batters? Or between 86 and 120, where the third percentile can fall?
If so, why so few?
It’s just the percentile returned by the (very basic) PERCENTRANK.INC function in Excel. Details here:
https://support.office.com/en-us/article/percentrank-inc-function-149592c9-00c0-49ba-86c1-c1f45b80463a
There were 67 players with at least 254 PAs through 6/8/19 (when the data for this piece was pulled). So Excel calculates the percentile as 2 / (2 + 64) = 0.0303 where two represents the number of values smaller than Gurriel’s and 64 the values larger. It’s blunt but shows the relative drop perfectly well, I think.
Copy that, super helpful for context, thank you!
Should’ve been suspended during the WS and half the season in 2018
Unleash your inner Elsa and just let it go.
Rian, did you mention Ike Van Zandt because no other article appears on his page? Are you hunting FanGraphs virgins?
Yuli’s launch angle distribution suggests he is not controlling launch angle as well as he has as there is much more variance. The ball is basically going all over the place away from the sweet spot. In easier to understand terms, he’s popping ball up or hitting grounders more often, and hitting smoking liners/low flies less often. The article gets it right that “average” LA is not always a good measure. In Yuli’s case, his average launch angle is great, but his distribution basically says his average is misleading as it is averaging a lot of grounders and pop ups.
Definitely the case if you watch Stros games on a regular basis. Lots of infield pop ups and GIDPs. Even when he gets a hit, a large number of the low velocity doubles and Texas leaguers than the average hitter.
Have to think Yuli’s days as a regular starter (even on the roster?) are numbered when everyone gets back. Springer, Brantley and Reddick are all superior hitters anyways. Yordan likely is unless something goes horribly wrong. Kyle Tucker is laying waste to the PCL. Oh, and Derek Fisher is #3 on the average exit velocity leaderboard trailing on Judge and Gallo.
That’s 7 guys for 5 spots in the lineup (OFx3, DH, 1B) where Yuli is the #7 guy on the list by a wide margin.
When I saw that his swinging rate on 2-strike pitches in the zone went from 95% to 89%, I thought “Just a few extra pitches over half a season? How can that be significant?”
Lo and behold, it’s statistically significant at 5%, with a p value of 0.025 if using the binomial distribution with inputs of A) a true success rate of 95%, B) 71 trials, C) 63 successes.
Just thought it might be useful context (not a criticism of the author), if you are like me and had the same distracting aside. Whether it’s of practical significance is addressed throughout the article. I happen to think that his plate discipline is not the reason he’s doing worse this year. After all, his walk rate has increased and his K-rate has decreased from last year. It’s all about the batted ball outcomes, which is partially addressed in the article.
That said, but I just don’t feel like I completely understand why Yuli is so terrible this year. What’s missing , and probably something that probably the Astros FO is looking at, is how the outcomes by pitch type (and changes in pitch selection against him) are affecting his batted ball outcomes/locations.
> I just don’t feel like I completely understand why Yuli is so terrible this year
He should probably open his own eyes
I watched a game at Fenway where Hinch had Yuli playing second base. He managed to botch every play near him, and still remained in the game. Bit of a tangent, but I wonder if we have been seeing more corner infielders playing second base (Muncy, Shaw, Moustakas, Chavis come to mind) and how their defense and offense is when playing out of position. I imagine the premise is true, with better positioning and fewer groundalls theoretically limiting the damage these guys could do defensively, but I wonder if the benefit from having 3 corner infield bats is significant