Archive for February, 2006

Research – Dissecting Plate Discipline: Part 1

If you’ve been reading the recent Daily Graphing columns, you’ll notice that I’ve been talking about some not so common stats such as, the percent a player swings at pitches outside the strike zone and actual contact rate. These oddball stats are derived from Baseball Info Solution’s “pitch data” which contains the location and result of each and every pitch, among other things. I’ve decided it’s probably a good idea to go over a bunch of these stats and examine why I think they’re meaningful.

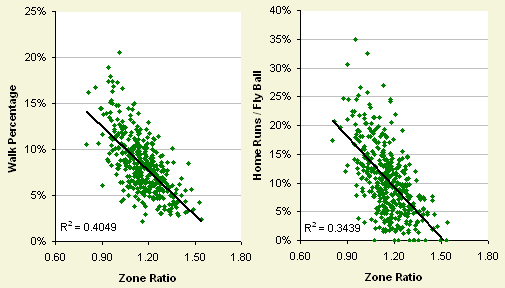
When a pitcher throws the ball, it can land either in or out of the strike zone. Not all batters receive the same amount of pitches in and out of the strike zone and this does make a difference. Batters will see anywhere from 45% to as high as 60% of pitches inside the strike zone. I’ve found it most useful to express this as a ratio. Let’s call this Zone Ratio.

Zone Ratio (ZRatio) – the ratio of pitches inside the strike zone to pitches outside the strike zone
ZRatio

ZRatio correlates quite well with two stats that are frequently used: walks and home runs. It makes a lot of sense that batters who see more pitches outside the strike zone would walk more. Finding it correlated well with home runs was slightly surprising, but also made sense because pitchers would want to be more cautious with batters that can generate more power.

Top 5 ZRatio			Bottom 5 ZRatio
Aaron Miles	1.54		Ryan Klesko	0.89
W. Bloomquist	1.53		Carlos Pena	0.88
Tony Womack	1.49		Chipper Jones	0.86
Tike Redman	1.48		Russell Branyan	0.81
David Eckstein	1.46		V. Guerrero	0.80

If you look at the top and bottom 5 batters in ZRatio, it’s probably no surprise to see Vladimir Guerrero receives the least amount of balls in the strike zone. On the high end, you don’t just have guys like Willie Bloomquist (0 HRs) and Tony Womack (0 HRs), but also David Eckstein (8 HRs). I wonder if David Eckstein will remain in the top 5 in 2006. Quickly shifting back to players that have a low ZRatio you’ll notice Russell Branyan who strikes out more than pretty much anyone in baseball. Unlike Vladimir Guerrero, it’s more likely pitchers are exploiting a weakness instead of respecting his power.

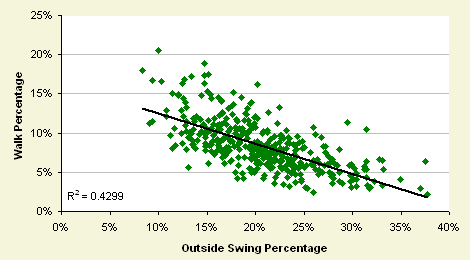
Moving along, after the pitch is thrown, there are two things a batter can do: take the pitch or swing at it. I’ve found that it doesn’t seem to matter how often a batter will swing at pitches inside the strike zone, but how often they’ll swing at pitches outside the strike zone. I’m going to call this stat Outside Swing Percentage.

Outside Swing Percentage (OSwing) – The percentage of pitches outside the strike zone a batter swings at.
OSwing

Probably to no one’s surprise, OSwing correlates quite well with walks. Batters will swing at pitches outside the strike zone as low as 8% of the time to as high as 37% of the time. Looking at the top and bottom 5 lists, you’ll see that batters that you typically consider having great discipline such as Chipper Jones and Jason Giambi round out the bottom of the list. At the top of the list you have batters that really like to swing the bat such as Ivan Rodriguez and Jeff Francouer.

Top 5 OSwing			Bottom 5 OSwing
Ivan Rodriguez	37.69%		Jason Giambi	10.03
Bradley Eldred	37.50%		Dave Roberts	9.39
Angel Berroa	37.01%		Chipper Jones	9.33
Jeff Francoeur	34.91%		Eric Young	9.09
Johnny Estrada	33.22%		Brian Giles	8.33%

Finally, if you do decide to swing the bat, one of two things can happen: you either hit the ball or miss the ball. Batters made contact with the ball anywhere between 54% and 94% of the time. Let’s call this stat simply Contact Percentage.

Contact Percentage (Contact) – The percentage of times a batter hits the ball when he swings the bat.
Contact

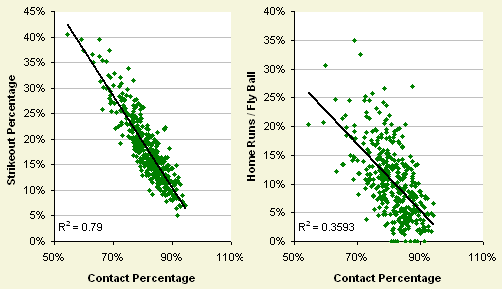
There are two things that Contact correlates well with: strikeouts and home runs. The correlation with Strikeouts isn’t a shock. If you can’t lay wood on the baseball, you’re going to be striking out a lot. The correlation with home runs, just like with ZRatio was a little surprising, but once again this also made sense. Typically players who are swinging for the fences are going to swing and miss more often.

Top 5 Contact			Bottom 5 Contact	
David Eckstein	94.26%		Craig Wilson	63.23%
Luis Castillo	94.01%		Carlos Pena	63.02%
Oscar Robles	93.51%		Wily Mo Pena	59.83%
Chris Gomez	93.43%		Russell Branyan	59.21%
Kenny Lofton	92.66%		Bradley Eldred	54.57%

Once again, if we look at the top and bottom 5 players in Contact, you’ll see players like David Eckstein and Kenny Lofton at the top of the list. Just outside the top 5 are players you’d expect to see because they’re considered great contact hitters such as Juan Pierre and Placido Polanco. Remember how Russell Branyan had a very low ZRatio? Being one of the worst contact hitters in baseball, this pretty much confirms that pitchers are indeed exploiting his deficiencies.

So for each of these three stats, I talked about how they correlate well with other more mainstream stats. Based on that, we should be able to come up with the expected number of strikeouts, walks, and home runs for each player based on the components of their actual plate discipline. Later this week in Part 2, I’ll be exploring the discrepancies between what a batter is expected to do based on his plate discipline and what he actually does.
Daily Graphing – Carl Crawford

After batting .296 with 59 stolen bases and 11 home runs in 2004, it was looking like Carl Crawford was well on his way to becoming one of the best offensive players in baseball. During the first two months of the 2005 season he bat only .266, but for the remaining four months of the season he bat .320 with 32 stolen bases and 12 home runs giving him his best major league season to date. Now that the cat’s totally out of the bag, let’s see if there’s any reason doubt him.

BBK

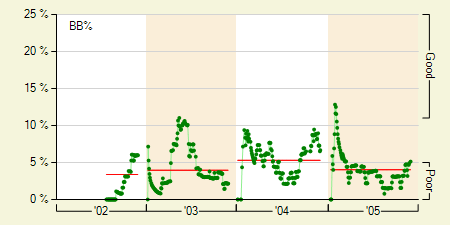
If it isn’t the old walks per 9 innings (BB/9) graph. With only 27 walks in just under 700 plate appearances, it’s safe to say that he really likes to swing the bat. He swings at about 30% out of the strike zone, which is really getting up there. This is where I’d usually go into a rant about how he needs to walk more to continue his success, but not today.

It’s tough to take a walk when you don’t see many pitches outside the strike zone. About 58% of the pitches Crawford saw were strikes, which ranks him in the top 10% in percentage of strikes seen. In games where he saw less than 50% strikes he walked a healthy 10% of the time and bat .293. When he saw more than 50% strikes, he only walked 2% of the time and bat .310. He can clearly make adjustments if necessary.

KP

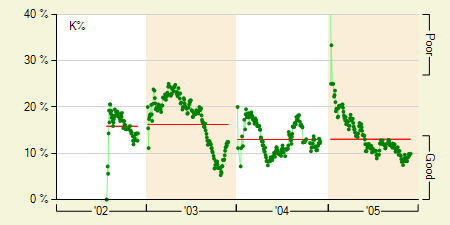
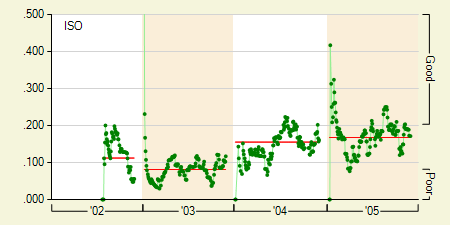
With that sorted out, it’s also worth mentioning he rarely strikes out, but doesn’t make great contact with the ball either. It’d really be a mistake to call him a contact hitter. Combine that with his two year rise in isolated power (ISO) and you’re looking at player that could definitely hit an additional 5 or so home runs.

ISO

It will be interesting to see if pitchers decided to keep the ball out of the strike zone a little more with Carl Crawford. He certainly poses a dilemma for most pitchers since you don’t want to walk him because of his speed, but it’s clear that if you hang around the strike zone, he’s going to get on base anyway. If pitchers do become a little more cautious with him, he should see a rise in walks, with a slight decrease in batting average. Either way, I wouldn’t doubt him.


Daily Graphing – Mike Mussina

Does anyone remember when Mike Mussina went 3-1 with a 2.14 ERA in his final 6 starts of the 2004 season after posting a 5.42 ERA in his previous 21 starts? He had just come back from an elbow injury requiring he spend over a month on the disabled list and it looked like the old Mussina, who had a career 3.54 ERA (instead of an ERA over 5) had returned!

There were high hopes going into the 2005 season, but they quickly faded as he went 1-2 with an ERA just under 5 in the first month of the season. In May, June and July he pulled things together, posting a 9-4 record with a 3.49 ERA, but was plagued with elbow tendonitis the final two months of the season. Let’s see if Mussina’s roller coaster ride will continue in 2006.

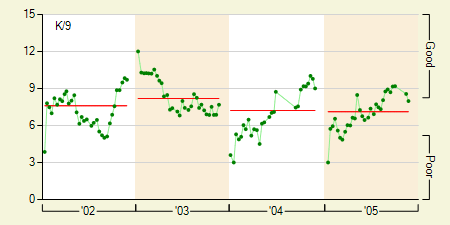
K9

For the second year in a row his strikeouts per 9 innings (K/9) slowly climbed out of the gutter to finish the year at a respectable 7.1. While this is certainly adequate for most starting pitchers, it’s worth noting that this is an 11 year low for Mussina. In his poor first month of the 2005 season, his K/9 was a mere 5.5 which was mainly due to a lack of velocity on his fastball.

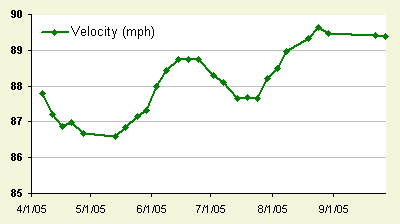
Velocity

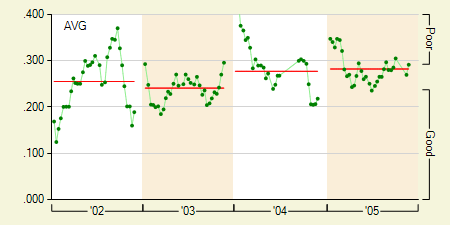
He could barely get his fastball up to 90 mph, often throwing it below 85 mph during the first month of the season. During his good stretch in the middle of the season he was throwing it consistently just under 90 with it topping out around 92. Needless to say, his decreased velocity early on made him much more hittable.

AVG

Even while not at his best, Mussina is still a lot better than many starters out there, but it looks as though these past two seasons were the beginning of the end. At 37 years old and with his recent injury history, I doubt he’ll be able to pitch a consistent season. He’ll have his moments, maybe even a great month or two, but I suspect the roller coaster ride we’ve become accustom to the past two years will continue.


Daily Graphing – Jorge Cantu

Last season Devil Ray’s prospect Jorge Cantu broke through in a big way by batting .286 with 28 home runs in just under 600 at-bats. That’s a considerable amount of power for a second-baseman as only Alfonso Soriano and Jeff Kent bested him in 2005. Let’s see if he’ll be able to repeat his breakout season and solidify himself as one of the top second-basemen.

BBP

Starting off with his walk percentage (BB%), he pretty much never walks. He actually had the 6th worst walk percentage of any player in baseball for the 2005 season. He swings at over 30% of the pitches out of the strike zone and 57% of all pitches which makes him one of the most prolific swingers in all of baseball. Fortunately he doesn’t strike out all that much.

KP

Most of his home runs came after the first two months of the season. In April and May he hit 6 home runs and in the following 4 months of the season he hit his other 22 home runs. His home runs per fly ball (HR/FB) stayed pretty steady the entire season which means his new found power was the result of hitting more fly balls.

LDGBFB

It looks like Cantu’s power is for real, but it’s not all good news. When he started hitting more fly balls he became a more aggressive hitter. By the end of the season he was swinging at a whopping 37% of all balls out of the strike zone, a totally unacceptable number. If he wants to keep his batting average anywhere near the .286 it was last year, he must learn to lay off pitches he shouldn’t be swinging at. If he doesn’t, not only will his batting average dip, but I suspect his power will also take a hit as pitchers key in on his inability or unwillingness to differentiate strikes from balls.


Daily Graphing – Chris Ray

With B.J. Ryan and Jorge Julio’s departure from the Orioles, it looks like Chris Ray will get a shot at closing games. Ryan saved 36 games last year, blowing only 5 saves with an 2.43 ERA. Those are some pretty big shoes for Ray to fill in his sophomore season. After being called up from AA in mid-June, he had an excellent rookie season, throwing just over 40 innings with a 2.66 ERA. Let’s see if he has the stuff to handle full time closer duties.

K9

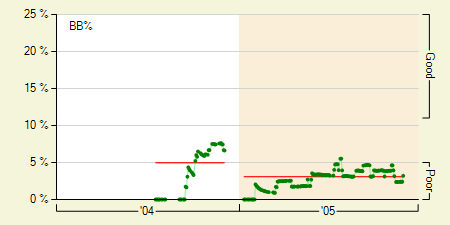
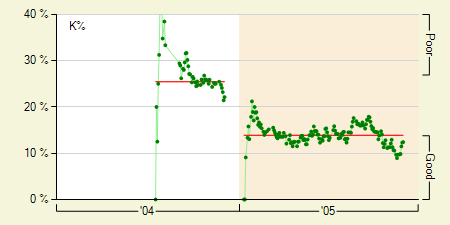
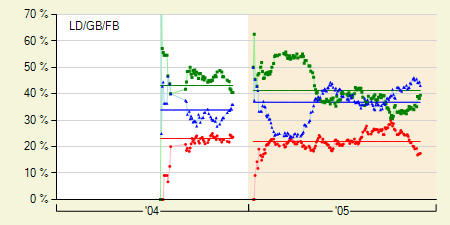
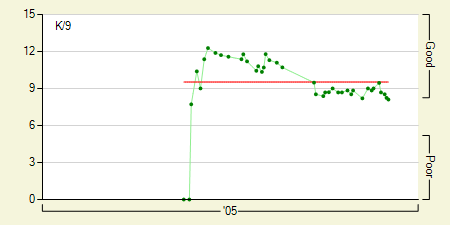
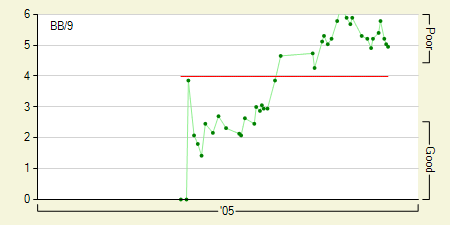
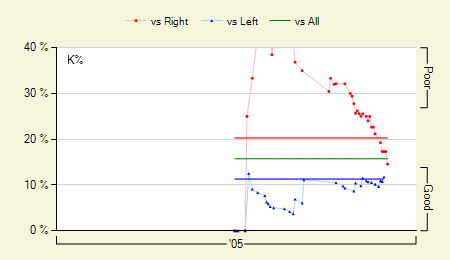
He has an excellent strikeouts per 9 innings (K/9) of 9.52 which is certainly closer worthy. He relies heavily on his mid-90’s fastball which tops out at 99 mph. Occasionally he’ll mix in his slider and he also has an 85 mph changeup which he doesn’t throw all that often. He started off the year with some excellent control, but as the season wore on, his walks per 9 innings (BB/9) crept up to unacceptable levels.

K9

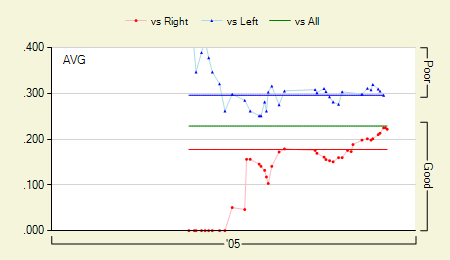
In his brief minor league career, his highest BB/9 was 3.06 which is quite good and with his K/9 as high as it is, he can afford to have a slightly higher walk rate. He did experience a bit of trouble with left-handed batters as they batted .298 against him opposed to .177 of right-handed batters.

Split AVG

In all honestly, it probably wouldn’t hurt if he waited another season before taking over as a full time closer, but it looks like he’s the Orioles best option at this point. He certainly appears to have the right stuff to close out games and if he can recapture his minor league walk rate he should be primed for a good season. I’m sure there will be a few bumps in the road, but with a little leeway, he should be able to hang onto the job all year long. I can certainly think of a few higher profile closers who will probably be out of a job before Chris Ray.


New Graphs: RC/G & LOB%

I decided to add two additional graphs today. The first is Bill James’ Runs Created per Game (RC/G) and the next is Dave Studeman’s Left on Base Percentage (LOB%).

LOB% – From the Hardball Times: Is the percentage of baserunners allowed that didn’t score a run. LOB% is used to track pitcher’s luck or effectiveness (depending on your point of view). The exact formula is (H+BB+HBP-R)/(H+BB+HBP-(1.4*HR)). Note: I’m currently excluding HBP in the formula for FanGraphs, but it will eventually be in there. The difference should be minimal.

RC/G – Is how many runs a team would score if its lineup was comprised of entirely the same batter. I’m using the stolen base version of runs created which looks something like this: (((H + BB – CS) * ((1B + (2 * 2B) + (3 * 3B) + (4 * HR)) + (0.55 * SB)) / (AB + BB)) / (AB – SO + CS) * 27). There are many more complicated versions out there, which I may explore using in the future.


Daily Graphing – Brian Roberts

When Brian Roberts was on pace for 73 home runs just 11 games into the 2005 season, I made a bet with one of my buddies that he wouldn’t hit more than 10 home runs on the year. When I saw him drive Jose Lima’s very first pitch just over the right field wall on May 5th for home run #9, I thought to myself, “Should have made it 15 home runs.” Yes, 15 home runs was more like it, as he finished up the season with a career high 18 home runs and a career high .312 batting average. That’s 6 more home runs than his career total before the 2005 season and 40 points higher than he ever batted. Let’s see what’s in store for 2006 and if he has any chance of hitting 18 home runs again.

BBK

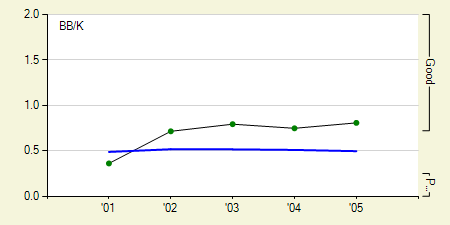
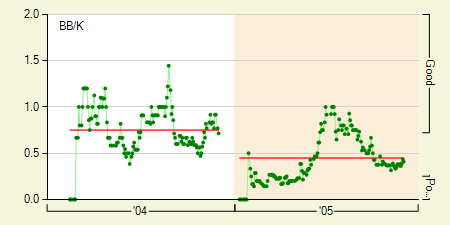
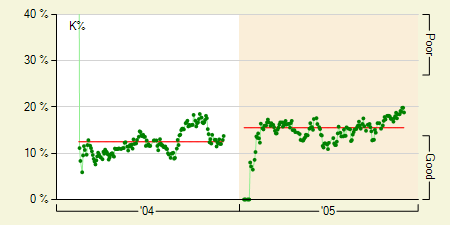
One thing Roberts has going for him is pretty good place discipline as evident by his good walk to strikeout ratio (BB/K). In 2005 he swung at 19% of the pitches outside the strike zone which is just slightly better than average. Fortunately, he did a good job getting his bat on anything he really shouldn’t be swinging at, typically fouling off bad pitches. Overall, he’s one of the top 50 contact hitters in baseball which isn’t too shabby.

ISO

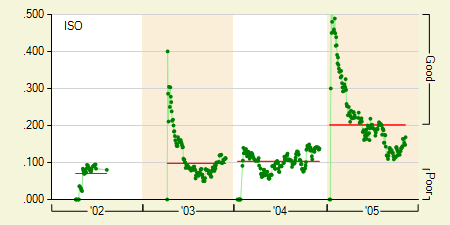
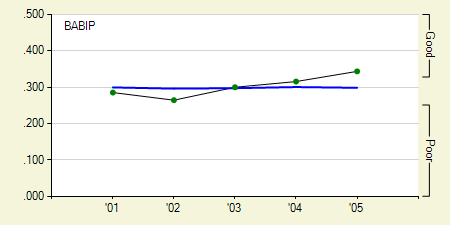
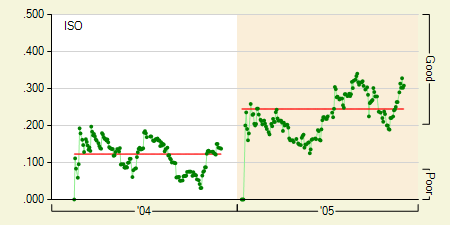
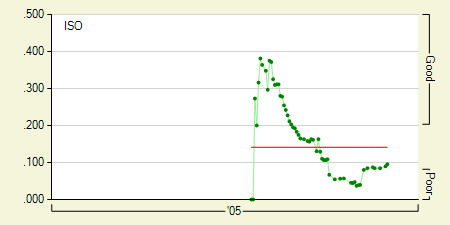
Taking a look at his isolated power (ISO), he experienced an extreme spike during the start of the season, which almost returned to previous levels as the season went on. Excluding the spike, it does look like he made some slight advances in the power department over his 2004 season. As for his career high .312 average, it was mostly due to a high .342 batting average on balls in play (BABIP), along with a high 27% line drive percentage.

BABIP

The truth is, Roberts looks like he really did improve in 2005, but not as much as his home run totals or batting average would suggest. I think if he could hit 12 home runs while batting .290 he could call it a successful year. He should definitely do better than his 2004 totals, and remember that he’ll continue to be a threat on the bases.


Daily Graphing – Chad Tracy

After batting .285 with 8 home runs in his first year in the majors, Chad Tracy had a breakout season in 2005 by batting .308 with 27 home runs. Now that Troy Glaus is out of the picture in Arizona, let’s see if Tracy can continue to improve and become one of the premiere third-basemen in baseball.

BBK

Taking a look at his walk to strikeout ratio (BB/K), it looks as though he has average plate discipline. He swings at pitches outside the strike zone 20% of time; basically the league average. I’d be more concerned, but he doesn’t strike out all that much and actually makes excellent contact for a power hitter. Of all the players in baseball with 20 or more home runs, he made the third best contact, right behind Todd Helton and Hideki Matsui.

KP

His isolated power (ISO) was elevated from previous levels the entire season, but he really started to mash the ball in the second half. He hit 17 of his 27 home runs after the All-Star break.

ISO

Chad Tracy’s 2005 season wasn’t a fluke. His exceptional contact ability coupled with his power is actually quite a rare combination only found in the very best hitters in baseball. If he can improve his strike zone recognition just a little he could be primed for an even bigger year. Either way, I expect him to match, if not exceed his 2005 home run total and hit for a similar average.


Daily Graphing – Matt Murton & John Rodriguez

Typically when you think of the best sluggers in baseball, names like David Ortiz and Vladimir Guerrero come to mind. How about the Cubs' Matt Murton or the Cardinals' John Rodriguez? Probably not, but will they someday? Murton played in his first major league game on July 8th and just ten days later Rodriguez got his first major league at bat. From that point on, the two left fielders had remarkably similar seasons. Murton batting .321 with 7 home runs in 160 plate appearances and Rodriguez batted .295 with 5 home runs in 176 plate appearances. I believe one of these batters may one day be ranked amongst the best batters in baseball while the other will most likely not.

           PA	H	HR	BB	SO	BA
Murton		160	45	7	16	22	.321
Rodriguez	176	44	5	19	45	.295

Matt Murton was drafted in the 1st round of the 2003 draft by the Red Sox and a year later was sent over to Cubs in the four-team trade that sent Nomar Garciaparra to the Cubs and Orlando Cabrera to the Red Sox. He did quite well in the minors hitting above .300 in both AA and AAA before being called up.

Matt Murton ISO

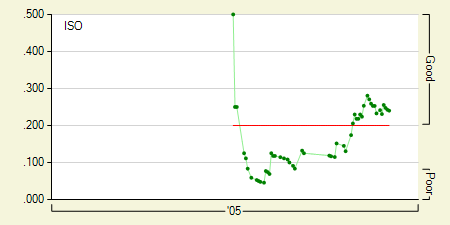
In his short time in the majors he's shown good power, which as you can see in the isolated power (ISO) graph above, really started trend upwards at the end of the season. Additionally he has above average plate discipline; only swinging at around 17% of the pitches out of the strike zone. Early in the season he couldn't seem to make contact against right-handed pitchers but it appears he quickly fixed the problem which may lead to an overall decline in strikeouts next season.

Matt Murton KP

John Rodriguez was drafted in the 16th round by the Padres in 1995 and was later signed by the Yankees in 1996. It was looking like he might be a career minor leaguer, but managed to get his big break when Reggie Sanders had to go on the disabled list. After hitting .342 with 17 home runs in AAA that year, his bat stayed hot in the majors and by the end of July he was batting .333 with 3 home runs in 49 plate appearances.

John Rodriguez ISO

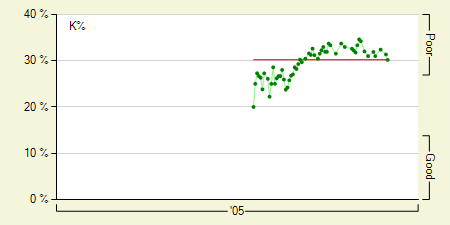
His power seemed to wane as the season went on. He continued to hit for good average as he finished off the season batting .280 but with just 2 additional home runs in his final 127 plate appearances. Furthermore, he struck out in 30% of his at-bats, only making contact when he swung the bat 66% of the time, making him one of the worst contact hitters in all of baseball.

John Rodriguez KP

Needless to say, Murton is the batter I'm predicting will have a breakout season. His plate discipline is actually quite similar to the best power hitters in baseball. He essentially makes below average contact with the ball, but doesn't swing at a whole of pitches either, all while batting for a high average. While Rodriguez has some of the qualities of a great hitter, he swings nearly 30% of the time at pitches outside the strike zone. Unless you think he's the next Vladimir Guerrero (think again) his high batting average will very likely drop next year as pitchers will continue to exploit his poor plate discipline. Funny how two batters with such similar seasons can have such different outlooks.


Daily Graphing – Tom Glavine

After finish up the second half of 2004 with a 4-7 record and an ERA over 5, many thought it might be nearing the end for Tom Glavine who had been pitching in the majors for 18 years. 2005 started off just as 2004 ended, with Glavine posting a 5-7 record with a 4.92 ERA in the first three months of the season. He managed to get through July going 2-2 with a 3.43 ERA; were things starting to turn around? Building on his July performance, August ended with a 3-2 record and 2.50 ERA. Saving his best for last, in the final month of the 2005 season he posted an incredible 1.71 ERA with two complete games wins. Now entering what will be the start of his third decade of major league baseball, let's see if he can continue to pitch like he did in the second half of 2005.

BB9

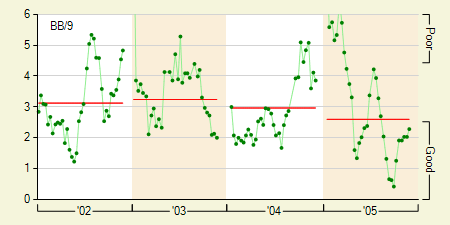
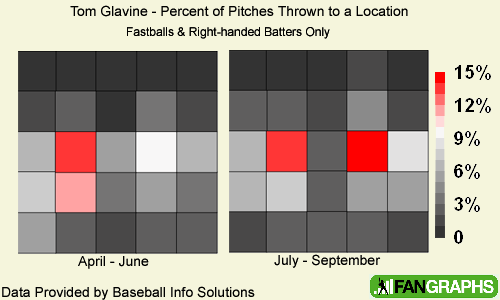
The thing which really separates his good moments from bad moments is his control. Looking at Glavine's walks per 9 innings (BB/9), you'll see that he ended 2004 and started off 2005 fairly wild while finished up the season quite in control. If you compare his first half and second half pitch location charts, you'll see that he was actually a much different pitcher during the second half of 2005.

Glavine Pitch Location

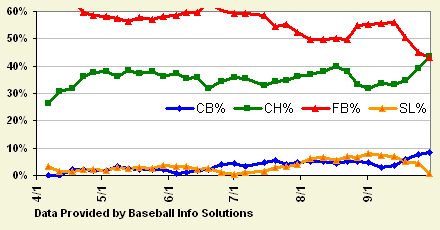
Not only did he locate his fastball better by throwing fewer pitches right down the center, but he really started to work the inside of the plate. Please note he didn't neglect the outside of the plate either. Furthermore, he changed his pitch selection by mixing in both his curveball and slider instead of his fastball. He only threw them about 5% of the time during first half of the season but managed to end the season throwing them both around 10% of the time.

Glavine Pitch Type

By the time the 2006 season starts, Tom Glavine will be 40 years old, but don't let that fool you. It's not like he's overpowering hitters with his fastball around 85 mph, so it's really going to be a matter of location and deception. With the changes he made in the second half, I'd expect him to have another season with an ERA under 4 and with the Mets being much improved, look for a few additional wins.