Archive for September, 2010

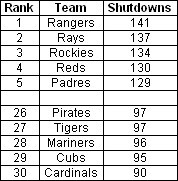
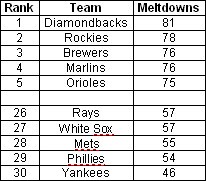
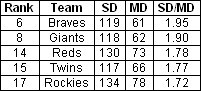
Matt Cain’s Pitch Selection by Count

Matt Cain effectively eliminated the Rockies from playoff contention yesterday afternon, pitching a no-hitter into the 8th inning and finishing all nine innings allowing two earned runs with eight strikeouts and one walk. Cain has been able to keep the HR/FB ratio down from 8.4% last season to 6.4% this season, reducing his HR/9 from 0.91 to 0.77. Dropping to 7.06 K/9 from 8.45 K/9 in his first full season (back in 2006) may be a concern, but overall, Matt Cain is enjoying the best season of his career in terms of FIP, with a career low mark of 3.54. Yesterday, Cain was able to induce 13 swinging strikes using all four of his pitches: four-seam fastball, slider, curveball, and changeup.

A pitcher with a variety of pitch types like Matt Cain will mix them based on the count and the batter’s handedness. What would be interesting to investigate is how Cain uses his fastball, silder, curveball, and changeup based on the count. First, let’s look at how many pitches Cain has thrown for each count this season:

All effective pitchers will avoid the three ball count as much as possible, and Cain has thrown 38 3-0 pitches all season in 210.1 IP. Next, let’s look at Cain’s pitch selection by count by first looking at how often he throws the four-seam fastball by count, while referring to the sample size from the above table to keep ourselves honest:

Obviously, Cain uses his fastball most frequently, but notice how he uses the fastball more when there are more balls in the count. In these situations, Cain would want to throw a strike, so using a pitch that he has more control over makes sense. On two strikes against both hitters, Cain throws the fastball about or over 50% of the time. Let’s look at Cain’s slider use by count:

Cain’s slider moves away from RHH and in on LHH. As a result, he rarely uses his slider against LHH in all counts, occasionally using it on two strikes. But against RHH, Cain utilizes the slider up to 20.5% of the time depending on the count. Let’s take a look at Cain’s curveball use:

Cain uses the curveball more often on the first pitch against LHH than against RHH, but uses the curveball as much as the slider on two strikes against RHH. It seems that, in addition to the fastball, Cain likes to use both the slider and curveball as his punch-out pitch against RHH. Finally, let’s look at Cain’s changeup use by count:

Whereas Matt Cain uses his slider against RHH often, he utilizes his changeup against LHH. This is because Cain’s changeup has different horizontal movement than his slider, moving toward RHH and away from LHH instead. Pitches that move away from the batter are harder to hit, so it makes sense that Cain distributes his slider and changeup in this way based on the batter’s handedness. It’s interesting to note that Cain rarely uses his changeup against LHH on the first pitch (12.5%), but uses it more frequently in every other count (up to 33.7% with a 1-1 count) except when there are three balls.

Cain is scheduled for one more start this season — this weekend against the San Diego Padres. The Padres and Giants are locked in a battle for first in the NL West, with the Braves battling for the NL Wild Card spot, as well. For the Padres’ lineup to be successful against Cain, the right-handed hitters could either sit on the fastball or anticipate the breaking ball with two strikes, while the left-handed hitters can expect a timely changeup deep in the at-bat.


2010 AL Playoff Rotations: Texas Rangers

This past weekend the Rangers clinched the AL West, their first division championship since 1999. Many things have gone well for the Rangers this season, and while a full look back will be worth doing after the playoffs, this post, like Friday’s on the Minnesota Twins, is a forward-looking post about their starting rotation going into the American League playoffs.

The simplistic take on past Rangers teams has been “good hitting, bad pitching.” This has always been at least a bit problematic in the past because the Rangers’ home park has tended to exaggerate both their hitters’ prowess and their pitchers’ futility, at least when looking at raw stats. This season, they’ve hit well, but their pitching has taken a step up. One season’s stats don’t tell the whole story, so while I’ll list each player’s 2010 statistics, I’ll also include numbers from the most recent update of CHONE’s pitcher projections (using CHONE’s context-neutral component nERA and also a FIP I derived from the stat line) to give a sense of each pitcher’s current “true talent.”

1) Cliff Lee, CHONE: 3.29 nERA , 3.16 FIP
2010: 6.6 WAR, 2.66 FIP, 3.28 xFIP, 2.75 tERA, 3.29 ERA

I’d call Lee the other forgotten AL Cy Young candidate, except I just remembered that what a player does in May and June doesn’t count for awards voting. But hasn’t Lee been a lot worse in Texas, anyway? Let’s see, his K/9 rate is slightly higher. His walk rate has doubled all the way up to over one per nine innings, and his HR/FB rate skyrocketed to almost league average. His xFIP in Seattle was 3.21; in Texas, it is 3.35. Whatever might be going on with Lee’s back, it looks to me like he’s basically the same pitcher as he was in Seattle, except he forgot not to let his HR/FB ratio regress to the mean when moving from one of the best pitcher’s parks in the league to one of the most hitter-friendly parks. Since 2008, Cliff Lee been one of the best pitchers in baseball. Of the likely AL playoff starters, only Francisco Liriano and CC Sabathia really match up with Lee.

2) C.J. Wilson, CHONE: 3.13 nERA,* 3.53 FIP*
2010: 4.2 WAR, 3.58 FIP, 4.23 xFIP, 3.78 tERA, 3.15 ERA

I include the asterisks because it looks like CHONE is still projecting him as a reliever. I’m not sure how CHONE or other projection systems handle reliever-starter switches, and obviously it needs to be accounted for. The (very) general rule is to add one to a reliever’s FIP/ERA to see what he would produce as a starter. That is a only a general guideline, though, and Wilson has outperformed all but the loftiest expectations of his transition into a starting role. Wilson walks a lot of batters, and his 4.23 xFIP reflects some good fortune on fly balls (5.1% HR/FB ratio, the league average this season is about twice that). However, Wilson strikes out a lot of hitters and keeps the ball on the ground enough to make it work.

3) Colby Lewis, CHONE: 3.47 nERA , 3.48 FIP
2010: 4.4 WAR, 3.52 FIP, 3.94 xFIP, 3.51 tERA, 3.72 ERA

Lewis has probably been better than Wilson; he has a better FIP, xFIP and tERA. Lewis hasn’t quite had Wilson’s good fortune on fly balls (although Lewis certainly hasn’t been unlucky) , and that’s a bit more of a problem because he’s a flyball pitcher. However, he has a very good walk rate and a higher 2010 K/9 rate than any of the other starters on Texas’ staff.

4) Tommy Hunter, CHONE: 4.83 nERA , 5.07 FIP
2010: 0.7 WAR, 5.02 FIP, 4.75 xFIP, 5.20 tERA, 3.83 ERA

…and then there’s Tommy Hunter. Yes, his ERA is good this season, and yes, xFIP indicates he’s has some bad luck. But he’s basically the Rangers’ version of Nick Blackburn. I guess Hunter strikes out a few more hitters than Blackburn, but he also walks more and gives up more fly balls. Basically, he’s an acceptable back-of-the-rotation starter during the regular season who a team really shouldn’t want to count on during the postseason.

The good news for Rangers fans is that Texas may not have to start Hunter in the Divisional Series, as the team is considering pitching Lee on short rest. As far as I can tell, the Rangers are the only team in the American League with three starters each over 4.0 WAR so far this season. Assuming Lee is healthy (and I doubt the Rangers would consider pitching him on short rest if they didn’t think so), the combination of Lee, Lewis and Wilson may be the best “top three” in the AL playoffs.


Shutdowns, Meltdowns and Making the Playoffs

Earlier this season, I brought up my dislike for the Saves statistic. Then, Tom Tango got the ball rolling (here and here) on creating a better way of measuring relief appearance success and, within a couple of days, the statistics Meltdowns and Shutdowns were available here at Fangraphs.

Shutdowns were supposed to mirror the total number of holds and saves in a season. As of yesterday, a total of 3403 number of shutdowns have occurred so far this season compared to a total of 3142 saves and holds. With only about 8% more shutdowns being recorded compared to saves and holds, the logic behind the values seem to be holding up fairly decent.

To see how teams stack up comparably, here is a look at the leaders and laggards in shutdowns across the league:

shutdowns

It seems the cream rises to the top as the top five teams have made the playoffs or are still in contention, while the bottom five teams are not going to make the postseason.

Along with shutdowns, meltdowns were created to measure the relief appearances that significantly hurt a team’s chances of winning. In comparision, here are leaders and laggards in the number of meltdowns:

meltdown

All the teams with the most meltdowns won’t make the playoffs, except maybe Colorado. Three of the five teams with the least number of meltdowns will make the playoffs with the Mets and While Sox being the exceptions.

Finally, the best way to see how the pen has done as a whole is to get the ratio of the number of shutdowns compared to the number of meltdowns. So far this season the league average is 1.73 shutdowns for every meltdown. Again here is a list of the top and bottom teams in the league:

ratio_leaders

No real surprise here with five playoff or likely playoff teams making the top list and five non-playoff teams at the bottom. Besides the top-five teams, here are how the rest of the possible playoff teams rank:

ratio_rest

Having a capable bullpen that keeps its team in games (compiling shutdowns) and doesn’t blowup (meltdowns) isn’t all that a team needs in order to make the playoffs, but all the teams making the playoffs have addressed it nicely during this season.


2010 NL Playoff Rotations: Philadelphia Phillies

Matt has already started looking at AL playoff rotations. Since the NL demands equal treatment, we’ll also look at the rotations for those six teams. The only sensible starting point is the team that has already clinched. As with Matt’s, we’ll go with each pitcher’s basic season numbers, plus the park- and defense-neutralized ERA (nERA) from the CHONE August projections and the FIP derived from that.

1) Roy Halladay CHONE: nERA 3.15, FIP 2.84
2010: 6.5 WAR, 3.07 FIP, 2.95 xFIP, 3.44 tERA, 2.53 ERA

Halladay has done exactly what everyone expected following his move to the National League. His ERA, 2.53, is his lowest since 2005, which is in some part due to his high strand rate, 82.5 percent. On one hand, that could change in the playoffs when he’s facing the better lineups in the league. On the other hand, the Phillies could face the Giants in the first round.

Even still, there’s little reason to doubt Halladay. He’ll be pitching more innings than in years past, but that doesn’t seem like much of a concern. The way Halladay has thrown the ball in the past five years it looks like he could keep going forever.

2) Cole Hamels CHONE: nERA 3.88, FIP 3.66
2010: 3.9 WAR, 3.09 FIP, 3.44 xFIP, 3.74 tERA, 3.70 ERA

In 2010, Hamels has established himself as a model DIPS pitcher. For the past three seasons now he has sported nearly identical FIP numbers while seeing fluctuating ERAs. Last year was a down year, a 4.32 ERA, but this year he’s back to the 3.09 mark he had in 2008. Chances are Charlie Manuel will name him the Game 2 starter, if for no reason other than his handedness. But that doesn’t take away from Hamels’ excellent season.

Like Halladay, Hamels has a higher strand rate than normal. That’s about the only bad thing about him. His groundball rate is higher than ever and he’s striking out a batter more per inning than he did in 2008 and 09. While the Phillies had questions about Hamels heading into the 2009 playoffs, there are none this year. It’s like 2008 all over again, only this time the Phils have a pitcher even better to take the ball in Game 1.

3) Roy Oswalt CHONE: nERA 3.86, FIP 3.58
2010: 4.7 WAR, 3.29 FIP, 3.44 xFIP, 3.42 tERA, 2.80 ERA

While the CHONE formula projects Oswalt to perform a bit worse than he has, it’s tough to watch his starts and come to a similar conclusion. Even with his rough first start for the Phillies, he has a 1.76 ERA and 3.07 FIP with his new, contending team. Even though he’s 32 he’s proven that he’s durable. He’s also worked through a long playoff run, pitching almost 270 innings in 2005.

In 2009, the Phillies acquired Cliff Lee at the trade deadline, and he led them through the regular season, into the playoffs, and eventually to the World Series. In 2010, Roy Oswalt doesn’t have to do that. Just as the Phillies have 2008 all over again with Hamels, they have 2009 all over again with Oswalt replacing Lee. Only, again, they have the best pitcher in the league taking the ball in Game 1, and another top of the rotation starter in Game 2.

4) Joe Blanton CHONE nERA 4.52, 4.26 FIP
2010: 1.9 WAR, 4.34 FIP, 4.04 xFIP, 4.58 tERA 4.94 ERA

As long as the Phillies hang onto the NL’s best record, they won’t even need Joe Blanton in the first round. They can simply skip him over and start Halladay, Hamels, and Oswalt on normal rest in all five games. He only becomes a factor in the ALCS and World Series, and even then it’s just one game. Even then it’s not all downside. His 4.94 ERA might look ugly, but as you can see nearly every component ERA rates him a bit better. This doesn’t make him a good pitcher; it simply means that having him start once a series shouldn’t kill the team. There’s a chance, too, that Blanton makes zero postseason starts.

Update: On the advice of commenter NEPP I checked the splits, and Blanton has seemingly gotten better every month this season. His overall numbers are certainly hurt by his first two months, which came after he missed April with an injury. He has also struck out 30 in 29 innings this month, which boggles the mind. I’d still advocate a three-man rotation, but with the way Blanton has been pitching and with the decisions Manuel made last year I’m fairly certain he’ll stick with having his guys on normal rest.

Question marks

The only question mark facing the Phillies rotation is of whether they’ll take the 2009 Yankees’ route and use only three starters. As David Murphy explained last week, Oswalt, Hamels, and Halladay can start 17 of 19 postseason games. But perhaps Charlie Manuel learned last year that going all-in is the right tactic.

Because the only off-days in the LCS occur between Games 2 and 3, and Games 5 and 6, the Phillies would have to throw each of their starters on short rest in order to avoid Blanton. That changes the situation somewhat; the Yankees were able to get through the 2009 playoffs with three pitchers largely because they got an extra day off in the LCS and had to throw only CC Sabathia on short rest in that round. But unless the Phillies find themselves up 3-0 heading into Game 4, it sounds like a good move for Manuel to go with Halladay.

It’s tough to pick against the Phillies in the NL as it is right now. Imagine if they throw out the inferior fourth starter and just go with their top three throughout the playoffs. They already have three of the top five or six playoff starters. If they throw only those three I don’t see how any other team stacks up.


Kenny Powers Hates Computers

The self-proclaimed greatest pitcher there ever was returned to HBO last night to try his hand in a Mexican League (not to be confused with THE Mexican League, as far as I know).

Clearly Kenny Powers doesn’t read FanGraphs because Kenny Powers “f**king hates computers, all kinds.”

But, if he did, besides calling the site something heinously profane, he might remember that for his career he averaged just above .5 wins above replacement per season — not to mention that, even in his best season, he would have only barely cracked the top 20 relief pitchers according to WAR.

Season Team   G    IP  W   L  SV   SO  BB  ER    ERA  WAR
2001   GWT*  15  23.0  4   0  12   28   0   1   0.39    ----
2002   ATL   62  66.1  7   3  49  106  30  21   2.85    1.75
2003   NYA   64  62.2  7   3  39   79  20  33   4.74    1.13
2004   SFG   52  54.2  3  10  30   44  27  40   6.59   -0.46
2005   BOS   15  12.2  0   6   3    6   9  12   8.57   -0.31

The good news is, that assuming Kenny Powers is between the age of 29-31 (based on being drafted in 1999), he still has plenty of time to make it back to the big leagues!


Saying Goodbye To A Prince

In the eighth inning of yesterday’s otherwise meaningless game between the Milwaukee Brewers and the Florida Marlins, Prince Fielder received a standing ovation after being removed for a pinch-runner. It very well could have been the last thing he ever did at home as a member of the Brewers, and everyone in attendance knew it.

Fielder is probably the most likely big name player to be traded this winter, as the Brewers have come to the conclusion that they’re not going to be able to sign their first baseman to a long term extension. Talks with Scott Boras earlier this spring apparently ended after the team’s offer – reportedly for 5 years and $100 million or so – was rebuffed, and it seems unlikely that either side will have a change of heart now. Fielder is looking for a market rate paycheck, while the Brewers are just not going to give him one.

So, the Brewers face a choice – they could keep their slugging first baseman, hope the 2011 team performs well in the first half of the season, and evaluate their potential playoff chances before deciding whether to move him at the deadline or collect two draft picks next winter, or they can trade him this winter and retool their roster. If they keep him, they run the risk of having to compete with San Diego next summer, who may be shopping Adrian Gonzalez if their season doesn’t work out so well. They also run the risk of Fielder getting hurt or having a down season, or potentially few contenders needing a 1B/DH type at the deadline, which would create diminished demand for his services.

The smart decision seems to be to move him. However, that might not be as easy as it sounds. Fielder is going to be a 5th year arbitration guy coming off a $10.5 million salary and with strong numbers in traditional categories, so he’s looking at a $15 million plus paycheck for 2011. And, while he’s a good player, that isn’t all that much of a bargain.

In five seasons as a big leaguer, Fielder has hit .281/.385/.538, good for a .389 wOBA. That’s very good, of course, but the only place he adds value is at the plate. UZR has consistently rated him as a below average defender, as he averages about -7 runs per season as a first baseman. While he moves pretty decently for a guy his size, he’s not any kind of asset on the bases. He’s a hitter, and a good one, but that’s all he is. And there are a lot of those available in free agency this winter.

For instance, most teams that would be interested in Fielder would probably also take a look at Adam Dunn, whose .251/.381/.522 career mark is very similar to Fielder’s. They have similar skillsets, and while Dunn is older, teams can sign him without surrendering prospects in their system or have to worry about the long term contract that Boras is seeking for his client. Even if you have to give up a draft pick to sign Dunn, he’ll look like a pretty attractive option at 4/40 compared to giving up premium talent to sign Fielder and then having Boras ask for six years and $150 million at the negotiating table.

While Fielder is a good player, he’s not a huge asset, because his annual salary is already pretty pricey and his lack of value beyond his bat is nonexistent. He’s a good player, but not a superstar, as his career +3.5 WAR per 600 PA shows. Even if we called him a +4 to +5 win player, he’s probably not worth $20 million per year, and Boras has already demonstrated that the expected price tag of keeping him is over that mark.

Realistically, the Brewers are probably better off finding a team who would see Fielder as a rental – a club that needs a big time slugger to put them over the top next year, and is willing to switch out prospects for present value and some long term draft picks. Rather than focusing on finding Fielder’s permanent home, it’s probably in everyone’s best interests if he’s a hired hand for one year, and then lets the market determine his landing place next winter.

How much is a one year rental 1B/DH with an expected salary of $15 million worth? Probably a lot less than Brewer fans are hoping for.


Prospects Chat – 9/27/10


Cain Buries Colorado

Things were looking interesting for the Rockies in the NL West entering the weekend. A series sweep over the Giants would move them to only half a game behind with seven to play and a good chance to move into the playoffs in the last two weeks of the season. But the Rockies couldn’t handle Tim Lincecum in game 1. Despite their game 2 victory, a loss in the third game of the series would knock them 4.5 games behind San Francisco and at least 3.5 behind Atlanta for the Wild Card. Thanks to a brilliant performance from Matt Cain, Colorado’s season is now effectively over.

Cain had some help, particularly from home runs by Freddy Sanchez and Cody Ross, but Cain’s fantastic performance stands tallest for the Giants. Over a complete game, Cain only allowed two runs – a Melvin Mora pinch hit home run in the 8th inning. The Rockies could only muster two more hits and a walk off Cain while striking out eight times.

Not only was Cain brilliant, but he was brilliant in the context of a close game. He took the 2-0 lead staked to him by the Sanchez home run and ran with it. The Rockies were within three until the 7th inning, and then after the Mora home run, Cain had to shut the door on a potent Rockies offense in the 8th and 9th. Overall, Cain earned a whopping +.469 win probability added in the start – as a total of +.500 is required for the team to win the game, you can almost say that Cain won the game by himself.

The loss doesn’t quite eliminate the Rockies, but with six games to go for San Francisco and seven for each of San Diego and Colorado, the Rockies are in dire straits. Any combination of three Colorado losses or San Francisco wins now ends the Rockies NL West hopes, and any combination of four San Diego wins or Rockies losses would end any Wild Card hopes. Not only did Matt Cain utterly dominate and shut down the Colorado Rockies offense on Sunday afternoon, but he also buried their season. The Giants can now turn their attention for the rest of the season on what should be a stupendous race against the Padres and Braves for the final two NL playoff spots – all three teams are within a game of each other, and surely all three are glad to have the Rockies securely in their rear-view mirrors.


One Night Only!

This edition of One Night Only is definitely speaking before it thinks.

Note: It appears as though the Braves organization is attempting to besmirch the good name of the author: they’ve bumped ahead Mike Minor by a day and, instead, will be starting Tommy Hanson tonight. It’s actually not much of a downgrade, so far as NERD goes. Hanson currently has an 8, which is where Minor himself would be were it not for the bad luck.

(NERD scores in parentheses.)

Florida (7) at Atlanta (5) | 7:10pm ET
Starting Pitchers
Marlins: Alex Sanabia (4)
65.1 IP, 5.79 K/9, 2.20 BB/9, .310 BABIP, 35.4% GB, 5.3% HR/FB, 4.67 xFIP, 1.1 WAR

Braves: Mike Minor (10)
39.1 IP, 9.38 K/9, 2.29 BB/9, .392 BABIP, 35.2% GB, 10.3% HR/FB, 3.86 xFIP, 0.6 WAR

Notes
• There are three teams whose respective playoff fates remain undecided: Atlanta, San Diego, and San Francisco. As of this morning, their respective postseason odds, per Cool Standings, are as follows: 59.7% (Braves), 83.0% (Giants), and 57.0% (Padres). Yeah, San Francisco has a higher chance of making the playoffs, but, speaking broadly, each of these three teams has an equal claim to the two remaining spots. Or, rephrased in Manglish: “Three go in. Only two come out.”
• Mike Minor is one of the 10-iest NERDs you’re ever gonna find. He has an above-average xFIP (3.86), has a way unlucky ERA (6.18), is posting an excellent 11.1% swinging-strike rate (while average for starters is around 7.7%, with a standard deviation of 1.9%), and is only 22 years old. Let’s give this guy a metaphorical high-five, huh?
Osvaldo Martinez is the young shortstop who’s taken over in the absence of Hanley Ramirez, currently suffering from a sore elbow. Martinez is actually an interesting player. First, here’s what he did as a 22-year-old at Double-A this season: .300/.370/.399 (.334 BABIP), .355 wOBA, 111 wOBA+*. Also, there’s this fact: Martinez was shot in a drive-by last September in his hometown of Carolina, Puerto Rico. In this year’s Prospect Handbook, Baseball America gives him high marks for his makeup, too.

*wOBA+, courtesy of StatCorner, is park-adjusted wOBA relative to league average.

Other Notes
Seattle (2) at Texas (7), 8:10pm ET
• If we’re lucky, Greg Halman will start in the outfield for Seattle tonight. Who’s Greg Halman? Well, here: imagine a player with unending athleticism but absolutely no clue at the plate. That’s Greg Halman. In 465 Triple-A PA this season, he hit 33 HR and was 15-for-19 on SB attempts. Here were his relevant batting stats: .243/.310/.545 (.315 BABIP), .364 wOBA, 111 wOBA+. That also includes a 37:169 BB:K, meaning that Halman struck out in 39.9% of his ABs.

Chicago Nationals (2) at San Diego (10), 10:05pm ET
• Have you ever read Jim Collins’ The Last Best League? If not, you should. Also, if not, here’s the thing you should know about it: it’s a “season with”-type book (a la Seven Seconds or Less or Rammer, Jammer, Yellow Hammer) about the Cape Cod League. Finally, if not, here’s the last thing you need to know: Tim Stauffer is, like, the star of the book. He was the fourth-overall pick in the 2003 draft. Then he had arm problems. Now he’s starting this super-important game.

If I Had My Druthers
• I’d write a “season with”-type book featuring Colby Lewis and Andres Torres and maybe Manny Parra.
• It’d mostly be about all of us playing volleyball together.
Just Some Guys Playing a Harmless Game of Volleyball, Is All would be the commendably succinct title.

Also Playing
These games are very likely playing at some kind of sporty channel near you.

Read the rest of this entry »


A Different World

The Rays will clinch a playoff berth over the next few days. Mathematical probability and countless simulation engines prepared me for the day a month ago. The appearance will be their second postseason berth and, with it, my second October with real rooting interests. The importance of this October to the franchise’s future cannot be understated and as such, I will not state it at all in this piece. Instead, I want to delve into the playoff atmosphere itself.

Every franchise in this tournament has playoff experience at some point or another. There are new fans who have never experienced it before and those are the ones I write to, and if I do my job correctly, veterans of the battles can sit back and nod their heads in agreement. How is this going to feel? What should I anticipate? Are the rumors about ballyhooed levels of tension about playoff games legitimate?

From my experiences, those rumors are correct. These games play by different rules. Rules that expressly state results as the king, prince, jester, and maybe the queen too. You can be the better team and play better baseball, but if the breaks go against you, then the series can too. Danger is always on a game’s breath. Ask me about playoff meltdowns, I will point to game five of the 2008 American League Championship Series. Ask me about believing that my team will break my heart and I can point you to the dark night following game six. Ask me about exuberant triumph and unshackling emotion and I will point to the celebration after game seven, in which Carl Crawford’s reaction will live on in my heart and soul well after he moves on to his next team.

It is the way of the stage, of the presentation, of everyone knowing that this could be the final series of the year — hell, knowing that this will be the final series of the season – and of knowing that many fans are watching. I have never felt more self-conscious about my favorite players than I did during the World Series run. Did folks think any less of Evan Longoria and Carlos Pena because of their ill-timed slumps? Is everyone convinced that B.J. Upton cares and can play this game? Will J.P. Howell get props or will he continue to live under the shadow of bullpen by committee scorn and distaste? Will the broadcast ever utter the name Andrew Friedman and attribute the success to him too, or are Chuck LaMar and Joe Maddon the only names known?

Some of that is admittedly petty and me being overly attentive, but that is what you can expect starting next week. All of the lights and adrenaline and emotions will flow through you and occasionally shock you like electricity. The buzz will stick to your veins throughout a game day and off-days are both, 1) a nice (if brief) reprieve from the pressures of enthrallment, and 2) a reminder that this is what death encompasses.

I will refrain from calling the playoff experience a drug, even if that means I cannot address Yankees fans as addicts or the Pirates fan base as straight edge. Instead, the best simile I have is this: it’s like placing a compression sleeve on your heart. It will feel tight and awkward for a while, but at its best  it will come as a revolution.