Archive for March, 2016

FanGraphs After Dark Chat – 3/29/16

9:00
Paul Swydan: HI EVERYBODY!!!!

9:00
Paul Swydan: Last week of the offseason. Who’s psyched?!?!?

9:01
Jeff Zimmerman: Woo Hoo

9:02
Paul Swydan: Hey, so you guys know I don’t usually pimp my stuff too hard, but if you’re so inclined to read a music article, I had the chance to write one for Pitchfork last week. http://pitchfork.com/thepitch/1068-why-a-tribe-called-quests-phife-dawg-was-sports-fans-favorite-rapper/

9:02
Charlie: After dark? I’m on the east coast, and it isn’t even dark yet.

9:02
Paul Swydan: It is now, sucka.

Read the rest of this entry »


Welcome Back, Alex Wood

I don’t normally like to re-visit post topics, especially within the same month, but I’m doing this for two reasons. For one, now we have some data. And for two, the Dodgers have been plagued by bad news for much of spring training, so it’s worth spreading a little optimism. Players have been slowed by injuries left and right, but Alex Wood looks like he could be poised for a major rebound season.

This is what I wrote on March 3. The talk back then was about how Wood spent the offseason trying to correct his mechanics, which started slipping from normalcy somewhere around the end of 2014. It didn’t help when Wood later hurt his foot, which caused further mechanical inconsistency as he worked through the ache, but mainly, Wood wanted to get his arm slot back to where it had been. He was never one to pitch over the top, but as his performance declined, Wood’s left arm dropped lower and lower.

About that! In early March, we had Wood’s words. Now that it’s later March, we have Wood on the mound.

Read the rest of this entry »


2015 Starting Pitcher Ball-in-Play Retrospective – NL West

The NCAA Final Four is set, and we’re inside a week until baseball games actually start to mean something. Today, we’ll reach the halfway point of our ball-in-play-based analysis of 2015 starting pitcher performance. Yesterday, it was the NL Central. Now, the NL West.

First, some ground rules. To come up with an overall player population roughly equal to one starting rotation per team, the minimum number of batted balls allowed with Statcast readings was set at 243. Pitchers are listed with their 2015 division mates; those who were traded during the season will appear in the division in which they compiled the most innings. Pitchers are listed in “tru” ERA order. For those who have not read my previous articles on the topic, “tru” ERA is the ERA pitchers “should” have compiled based on the actual BIP frequency and authority they allowed relative to the league. Here we go:

Starting Pitcher BIP Profiles – NL West
Name AVG MPH FB/LD MPH GB MPH POP % FLY % LD % GB % ADJ C K % BB % ERA – FIP – TRU –
Kershaw 84.91 89.47 83.07 2.7% 25.5% 21.8% 50.0% 88 33.8% 4.7% 55 51 56
Greinke 87.78 91.04 86.02 3.1% 29.8% 19.1% 48.0% 76 23.7% 4.7% 43 71 64
Bumgarner 87.46 90.80 85.46 4.3% 31.3% 22.7% 41.7% 92 26.9% 4.5% 75 74 70
T.Ross 87.79 90.13 86.55 2.0% 17.9% 18.6% 61.5% 79 25.8% 10.2% 84 76 73
Ch.Anderson 88.52 91.59 87.00 3.6% 30.8% 23.6% 42.0% 94 17.3% 6.3% 110 106 94
Bettis 88.06 92.09 85.67 1.4% 27.1% 22.2% 49.3% 95 19.5% 8.4% 108 99 95
R.Ray 90.50 91.77 90.24 2.2% 32.4% 22.2% 43.3% 105 21.8% 9.0% 90 91 99
Heston 89.25 92.84 86.64 2.5% 23.5% 21.0% 53.0% 99 18.9% 8.6% 101 103 100
Shields 89.69 93.14 86.52 3.5% 30.8% 20.8% 44.9% 117 25.1% 9.4% 100 114 101
Cashner 88.79 92.08 87.09 2.7% 27.2% 22.7% 47.4% 106 20.5% 8.2% 111 99 101
Kennedy 89.73 92.44 87.13 3.0% 35.7% 22.8% 38.5% 121 24.4% 7.3% 110 116 101
B.Anderson 88.98 93.65 86.70 0.4% 18.1% 15.2% 66.3% 98 15.5% 6.1% 95 101 102
Bolsinger 88.41 91.70 86.79 1.3% 27.8% 17.8% 53.1% 105 21.0% 9.7% 93 100 102
De La Rosa, J. 86.07 90.84 83.67 1.2% 26.1% 20.7% 52.0% 104 21.1% 10.2% 107 107 103
Despaigne 87.41 90.40 85.69 1.7% 25.4% 22.4% 50.5% 96 12.6% 5.9% 149 122 105
De La Rosa, R. 89.13 90.55 88.30 2.4% 30.4% 18.1% 49.1% 107 18.5% 7.8% 120 123 106
Hellickson 90.14 93.64 87.19 1.5% 35.0% 21.1% 42.4% 112 19.0% 6.8% 118 114 107
Vogelsong 88.34 92.78 85.48 2.1% 34.0% 19.2% 44.7% 104 18.1% 9.7% 120 116 109
Rusin 88.60 92.64 85.62 2.7% 24.5% 20.8% 52.1% 109 14.5% 6.9% 137 121 116
Collmenter 86.12 91.84 79.40 5.2% 34.8% 25.6% 34.5% 121 12.6% 4.8% 97 119 128
Kendrick 89.70 93.37 86.46 2.7% 36.5% 22.0% 38.8% 127 12.7% 7.2% 162 157 140
AVERAGE 88.35 91.85 86.03 2.5% 28.8% 21.0% 47.8% 103 20.2% 7.4% 104 104 99

Most of the column headers are self explanatory, including average BIP speed (overall and by BIP type), BIP type frequency, K and BB rates, and traditional ERA-, FIP-, and “tru” ERA-. Each pitchers’ Adjusted Contact Score (ADJ C) is also listed. Again, for those of you who have not read my articles on the topic, Unadjusted Contact Score is derived by removing Ks and BBs from opposing hitters’ batting lines, assigning run values to all other events, and comparing them to a league average of 100. Adjusted Contact Score applies league-average production to each pitchers’ individual actual BIP type and velocity mix, and compares it to league average of 100.

Read the rest of this entry »


Let’s Invent a New Pitch

It’s been a while since we’ve had a new pitch. Zack Greinke wasn’t sure if that new hard change he learned from Felix Hernandez was a completely new pitch, so we may have to wait and see on that one. Before that, you’ll just have to wade into arguments about the cutter, the palmball, and the splitter. Someone invented them, but there is no consensus about who it was, exactly.

So let’s invent a pitch. It’ll be all ours if it catches on. We’ll get to name it. Or we won’t, as will become abundantly clear by the end of this endeavor.

Read the rest of this entry »


KATOH Projects: Seattle Mariners Prospects

Previous editions: ArizonaBaltimore / Boston / Chicago AL / Chicago NL / Cincinnati  / Cleveland / Colorado / Detroit / Houston / Kansas City / Los Angeles (AL) / Los Angeles (NL)Miami / Milwaukee / Minnesota / New York (AL) / New York (NL) / Philadelphia / Pittsburgh / San Diego / San Francisco.

Yesterday, lead prospect analyst Dan Farnsworth published his excellently in-depth prospect list for the Seattle Mariners. In this companion piece, I look at that same Seattle farm system through the lens of my recently refined KATOH projection system. The Mariners have the 24th-best farm system in baseball according to KATOH.

Read the rest of this entry »


2016 Positional Power Rankings: Relief Pitchers (#1-15)


We’ve reached the end of the actual rankings portion of the Positional Power Rankings, having covered every single position on the field, designated hitter, starting rotations, and now bullpens. Tomorrow, Dave Cameron will wrap it all up. I encourage you to get caught up and ready for the season by reading every single post, starting with Cameron’s introduction. But as your journey has brought you here, please read on for a look at 15 of the best bullpens in the game. Below is a graph showing every bullpen and their projected WAR on the season.

RP_PPR

Last season, 375 pitchers recorded at least 10 innings as a reliever last season, an average of of more than 12 per team. As a result, there are a lot of names and projections listed below. Bullpens can change greatly from year to year and even during the season. The Toronto Blue Jays and Texas Rangers remade their bullpens on the fly last season on their way to the playoffs. The Royals have made significant changes since last summer when Wade Davis was not even the closer yet. It helps to have a great reliever at the back end of the pen, but if you want to be ranked first on this list, you need to have three.

#1 Yankees


Name IP K/9 BB/9 HR/9 BABIP LOB% ERA FIP WAR
Andrew Miller 65.0 13.7 3.0 0.8 .309 81.5 % 2.32 2.39 2.3
Dellin Betances 65.0 13.3 3.5 0.7 .301 81.7 % 2.33 2.49 2.0
Aroldis Chapman   55.0 14.3 4.0 0.7 .309 82.3 % 2.35 2.50 1.4
Chasen Shreve 55.0 9.5 3.7 1.1 .303 75.4 % 3.77 3.96 0.3
Branden Pinder 45.0 8.1 3.4 1.3 .301 72.3 % 4.36 4.46 0.0
James Pazos 40.0 8.9 3.9 1.0 .304 72.8 % 3.98 4.02 0.1
Nick Rumbelow 35.0 9.1 3.0 1.2 .306 72.9 % 4.03 3.96 0.0
Bryan Mitchell 30.0 7.3 4.4 1.1 .308 69.6 % 4.82 4.74 -0.1
Kirby Yates 25.0 9.4 3.8 1.4 .305 74.7 % 4.18 4.42 0.0
Nicholas Goody 20.0 9.7 3.7 1.0 .306 73.7 % 3.81 3.82 0.0
Tyler Olson 15.0 6.6 3.1 1.2 .297 71.7 % 4.29 4.54 0.0
Jacob Lindgren 10.0 10.4 4.4 1.1 .305 75.9 % 3.75 3.91 0.0
Johnny Barbato 10.0 8.4 3.8 1.2 .307 72.5 % 4.34 4.44 0.0
Evan Rutckyj 10.0 8.7 4.6 1.0 .296 73.2 % 4.04 4.28 0.0
The Others 19.0 8.2 4.0 1.2 .322 69.5 % 4.73 4.50 0.0
Total 499.0 10.6 3.6 1.0 .305 75.7 % 3.48 3.57 6.0

Within these projections, there are 10 relievers forecast to produce at least 11 strikeouts per nine innings and at least 50 innings pitched. There are five relievers with at least 12 strikeouts per nine innings and at least 50 innings pitched. There are three relievers with at least 13 strikeouts per nine innings and at least 50 innings pitched, and all three are members of the New York Yankees. Andrew Miller, Dellin Betances, and Aroldis Chapman were the only pitchers in Major League Baseball last season to exceed 14 K/9, striking out roughly 40% of all batters who stepped to the plate against them last year. Miller and Betances combined to lead the Yankees bullpen last season, and this season the team added Aroldis Chapman at a discounted price due to a offseason domestic-violence incident which eventually resulted in a 30-game suspension.

Last season’s Yankees bullpen pitched very well, posting the third-highest bullpen WAR, although with 530.2 innings, the pen was forced to carry a relatively large load due to fewer innings from the starting rotation. The fewer innings a bullpen has to pitch, the greater percentage go to the best pitchers. With three of the very best relievers in baseball, a healthier rotation could push the Yankees to the top spot this season.

The Yankees traded away another lefty in Justin Wilson to the Tigers during the winter. Wilson was perhaps a bit underrated, and limits the improvements the Yankees can make over last season’s very good pen. Chasen Shreve is the forgotten lefty in the Yankees pen with the potential to be this season’s Justin Wilson. He can prpoduce strikeouts, but last season, they came with walks and a few too many home runs.  After Shreve, we have a host of replacement-level pitchers the Yankees can cycle in and out as they see fit, but the top three alone vault the Yankees to the top of Power Rankings by a healthy margin.

Read the rest of this entry »


August Fagerstrom FanGraphs Chat — 3/29/16

11:49
august fagerstrom: Heyyo! Chat begins at noon. Soundtrack: Mogwai — Mogwai Young Team

12:02
august fagerstrom: Alright, let’s do this

12:03
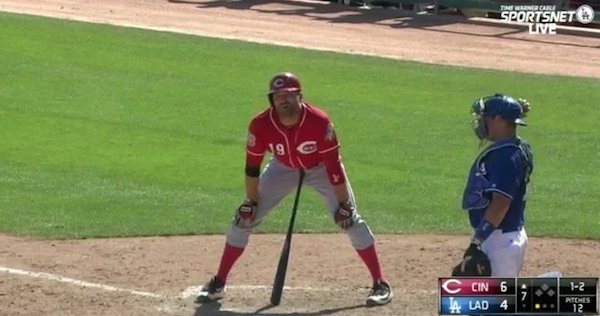
Bork: Is Joey Votto’s new uh…batting stance…the best thing ever?

12:03
august fagerstrom: Yes, yes it is.

12:04
august fagerstrom:

12:04
august fagerstrom: “I’m thinking.” is the greatest response he could’ve possibly given. I love the idea that he thinks so hard he has to bend over

Read the rest of this entry »


Let’s Find Rusney Castillo a New Home

Well, the Rusney Castillo era in Boston appears to be over before it ever really began. Signed to a six year, $72 million contract back in August of 2014, Castillo didn’t impress in his rookie season, and now, he appears to not have a job in Boston.

With Chris Young around as an obvious platoon partner for Holt, the decision to start Holt in left field leaves Castillo without a path to any real playing time, as Mookie Betts and Jackie Bradley are both very good defenders in their own right, and so the team won’t even be in need of a late-game defensive replacement. And with Andrew Benintendi looking like the team’s left fielder of the future, this was going to be Castillo’s shot at holding down a regular job; he’s unlikely to ever get another real crack at it in Boston now, barring an unforeseen injury.

So it’s probably time Castillo to get a change of scenery. The Red Sox don’t need a $10 million fifth outfielder, Castillo won’t benefit from sitting on the bench, and while he has minor league options remaining, sending him to Triple-A apparently isn’t in the plans.

That leaves a trade as the obvious solution, though Castillo’s contract — he’s due $56 million over the next five years — will be an obstacle for teams pushing up against their budgetary constraints. The Red Sox will likely have to eat some of the money or take back an overpriced contract to offset the money, but that should be doable. So with that said, let’s look at the best options to find Castillo a new home before Opening Day.

Read the rest of this entry »


The Crowd: Angels Have Riskiest Roster in Baseball

Last week, I ran a little crowdsourcing project in which I asked you all to assign some made-up risk points – between one and five of them — to each and every roster in the major leagues. It was inspired by a passing comment from my weekly Tuesday chat, and it got me thinking about overall team volatility.

And, perhaps volatility is the word I should’ve used, rather than risk. I asked people to consider factors like average age of the team, proven vs. unproven players, injury risks in key contributors, and organizational depth. But risk implies you’ve got something to lose, and so even though I included a disclaimer that read, “This isn’t about how good or bad a team is. The Braves shouldn’t automatically be more risky than the Cubs just because they’re a worse baseball team. Try and think of each team’s amount of risk in a vacuum, relative to its own general skill level,” I should’ve known that, since the Braves aren’t really risking anything this year, they’d show up with a low risk rating no matter what.

So I probably screwed up my own project with a poor word choice and skewed the results a little bit, but we can still talk about some pretty interesting nuggets of information that came out of the results, and if you’re interested in reading that, well, you’ve come to the right place.

Getting back to that projected performance vs. projected team risk topic, here’s a graph plotting the two against one another:

RiskGraph1

The average risk rating was exactly 3.0. Definitely, worse teams were given lower risk ratings, and better teams were given higher risk ratings. Only three teams projected for a record better than .500 had significantly below-average risk ratings. The six worst projected teams in baseball had risk ratings barely above 2.0.

You see that dot way out on the right, though, and that’s the dot that was at the heart of this whole project. The point was to find the team you all found most risky, and no matter what the results were, there was always going to be a team. That team was the Los Angeles Angels of Anaheim, with a weighted risk rating of 4.3.

Read the rest of this entry »


Joey Rickard Is Changing the Orioles’ Plans

I’m an optimistic player evaluator, and I recognize that. I try to see the good in what players can do, so I liked the Orioles’ idea of signing Hyun-soo Kim out of Korea. Now, Kim has not had a good spring training to this point, so he hasn’t made the best first impression. He also probably hasn’t made his last impression, but I certainly wasn’t expecting to see this headline from Ken Rosenthal:

kim-korea

This is something the Orioles have done before. A headline on Orioles.com says the team dismissed the report, but this post from Eduardo A. Encina makes it sound like Kim is indeed on the outside looking in. The Orioles might at least try to send Kim to the minors. In part, that’s because Kim hasn’t looked good, and he was hitless through his first 23 at-bats. Kim has to know he hasn’t yet been impressive. But there’s another factor — a surprising one — and that factor goes by the name of Joey Rickard. Rickard came to camp just hoping to make the roster, but based on the circumstances, he might become an outfield starter.

Read the rest of this entry »