2019 ZiPS Projections – Baltimore Orioles

After having typically appeared in the hallowed pages of Baseball Think Factory, Dan Szymborski’s ZiPS projections have now been released at FanGraphs for more than half a decade. The exercise continues this offseason. Below are the projections for the Baltimore Orioles.
Batters
Well, at least expectations have been tempered quite a bit. After all, this is a team that finished last in the American League in runs scored with Manny Machado for half a season, and even if Jonathan Schoop was disappointing and Adam Jones is in steep decline, they at least combined for an OPS above .700, which is … something.
The short-term outlook for the Orioles is bleak. Probably the most humorous/interesting/sad projection is Chris Davis‘, who is essentially projected for a massive, three-WAR rebound, which will get him to…zero or at least close enough to zero to borrow its lawn mower. Cedric Mullins at least looks like he has some promise and Renato Nunez is fascinating in that it still feels like he could have a weird 30 homer-but-below-average-overall season.
It was disappointing how many at-bats the Orioles gave Caleb Joseph last year given how up-and-down Chance Sisco’s been; if he’s ever going to succeed in the majors, he’s going to have to learn how to get through a slump, and that’s not going to happen against Triple-A pitchers.
My gut tells me that of the players in the graphic, only Mullins really has much of a chance to be a factor the next time the Orioles are good. Sadly, I think the list of non-factors includes Trey Mancini, who feels a lot closer to Jim Traber than a Randy Milligan-esque surprise.
Pitchers
It’s kind of depressing, but unlike the departed Kevin Gausman, who has a few more miles per hour on the fastball and a splitter that is just filthy at times, I don’t think Dylan Bundy post-injuries really has the stuff left to be a viable breakout candidate. It strikes me as unlikely that he’s ever even half the pitcher the O’s hoped he would be; his slider can still be very good, but too much of his repertoire is crushable.
The question at this point is whether Bundy and Alex Cobb can be league-average enough to be traded, and while I’m down on Bundy from a ceiling perspective, I’m more optimistic about being able to answer that question with a “yes.” I think there’s a good chance Cobb can beat this projection. Why? Before he was shut down with blisters, he was having a quietly solid second half, which coincided with increased usage of his splitter, his bread-and-butter pitch throughout his successes with the Rays.
One of the few 2019 bright spots in Baltimore’s ZiPS projection is the bullpen. The team has had a knack for finding relievers who end up pitching better than their stuff suggests they will, and ZiPS largely sees the front half of the relief corps being surprisingly solid, though this will probably matter more for deadline trades than for the immediate future of the Orioles, with the possible exception of the wild-but-fascinating Tanner Scott, who hits the high 90s and seems a lot more familiar with where home plate rests than the natural Orioles comparison, Brad Pennington, did.
Bench and Prospects
I wouldn’t get upset about the relatively tame projections for prospects like Ryan Mountcastle and Yusniel Diaz. The Orioles are in the very, very early stages of a rebuild that will likely need to be one of the longer and more painful ones in resent memory if it is to bear fruit. The team is a lot closer to the bleak wasteland the Astros occupied when Jeff Luhnow took over after the 2011 season than teams like the Brewers that required lighter resets. Too much of the basics of franchise-building were ignored in Baltimore for too long.
As such, the O’s don’t really care about mean projections right now. They’re at the point where they’ll just shrug and take the guys that exceed those average expectations. It doesn’t matter right now if 18 of the team’s top 20 prospects are busts as long as they get to keep the other two. And no, the minor leagues are not deep yet. It’s going to require years of good drafting, not to mention a sustained commitment to amateur signings in Latin America, a 180 degrees shift from the malpractice that became a joke around baseball.
It’s also worth noting that the O’s have quite a few vaguely intriguing pitching prospects in A-ball who just missed this list.
One pedantic note for 2019: for the WAR graphic, I’m using FanGraphs’ depth chart playing time, not the playing time ZiPS spits out, so there will be occasional differences in WAR totals.
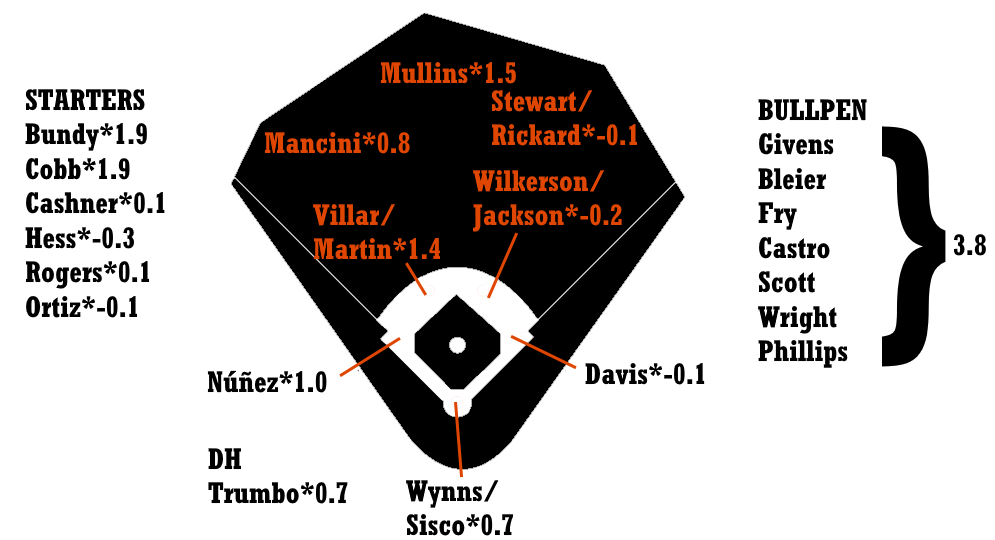
Ballpark graphic courtesy Eephus League. Depth charts constructed by way of those listed here at site.
| Player | B | Age | PO | G | AB | R | H | 2B | 3B | HR | RBI | BB | SO | SB | CS |
|---|---|---|---|---|---|---|---|---|---|---|---|---|---|---|---|
| Cedric Mullins | B | 24 | CF | 141 | 578 | 74 | 143 | 30 | 5 | 16 | 62 | 42 | 119 | 18 | 5 |
| Jonathan Villar | B | 28 | 2B | 145 | 494 | 62 | 121 | 20 | 2 | 15 | 50 | 46 | 151 | 39 | 10 |
| Renato Nunez | R | 25 | 3B | 133 | 491 | 63 | 116 | 24 | 1 | 23 | 66 | 36 | 136 | 2 | 0 |
| Ryan McKenna | R | 22 | CF | 130 | 499 | 61 | 116 | 23 | 2 | 10 | 46 | 46 | 141 | 9 | 6 |
| Trey Mancini | R | 27 | LF | 153 | 579 | 71 | 149 | 26 | 4 | 26 | 74 | 42 | 159 | 1 | 1 |
| Hanser Alberto | R | 26 | SS | 117 | 399 | 40 | 103 | 16 | 2 | 8 | 37 | 9 | 42 | 1 | 4 |
| Rio Ruiz | L | 25 | 3B | 146 | 512 | 61 | 117 | 24 | 3 | 13 | 58 | 48 | 134 | 2 | 2 |
| Mark Trumbo | R | 33 | DH | 121 | 453 | 58 | 108 | 18 | 1 | 24 | 63 | 33 | 124 | 1 | 0 |
| Adam Jones | R | 33 | CF | 140 | 565 | 63 | 149 | 26 | 1 | 19 | 66 | 26 | 98 | 4 | 1 |
| Colby Rasmus | L | 32 | RF | 78 | 252 | 32 | 54 | 10 | 1 | 13 | 39 | 25 | 90 | 1 | 0 |
| Martin Cervenka | R | 26 | C | 100 | 363 | 38 | 81 | 16 | 1 | 10 | 39 | 23 | 98 | 1 | 1 |
| Richie Martin | R | 24 | SS | 116 | 450 | 46 | 105 | 17 | 5 | 5 | 33 | 32 | 110 | 14 | 8 |
| Mike Yastrzemski | L | 28 | LF | 114 | 423 | 50 | 93 | 20 | 4 | 12 | 48 | 38 | 127 | 6 | 4 |
| Austin Hays | R | 23 | RF | 115 | 470 | 54 | 119 | 21 | 2 | 17 | 61 | 16 | 106 | 7 | 6 |
| Chance Sisco | L | 24 | C | 108 | 345 | 38 | 82 | 16 | 0 | 8 | 36 | 29 | 120 | 2 | 1 |
| Rylan Bannon | R | 23 | 3B | 116 | 440 | 58 | 92 | 15 | 3 | 18 | 52 | 55 | 147 | 3 | 4 |
| Jace Peterson | L | 29 | 3B | 117 | 329 | 35 | 73 | 14 | 3 | 5 | 35 | 45 | 83 | 12 | 5 |
| Corban Joseph | L | 30 | 2B | 122 | 440 | 48 | 110 | 18 | 1 | 10 | 45 | 30 | 56 | 5 | 4 |
| Austin Wynns | R | 28 | C | 89 | 299 | 34 | 70 | 11 | 0 | 7 | 29 | 20 | 75 | 1 | 0 |
| Drew Jackson | R | 25 | SS | 106 | 407 | 50 | 85 | 15 | 1 | 9 | 35 | 37 | 133 | 18 | 8 |
| Joey Rickard | R | 28 | RF | 117 | 350 | 43 | 84 | 18 | 2 | 8 | 33 | 32 | 85 | 7 | 2 |
| Audry Perez | R | 30 | C | 62 | 220 | 24 | 55 | 8 | 0 | 6 | 24 | 9 | 40 | 0 | 0 |
| Ryan Mountcastle | R | 22 | 3B | 121 | 484 | 55 | 120 | 26 | 3 | 13 | 55 | 19 | 110 | 3 | 1 |
| Caleb Joseph | R | 33 | C | 95 | 300 | 31 | 66 | 12 | 1 | 6 | 24 | 15 | 79 | 1 | 1 |
| Carlos Perez | R | 28 | C | 76 | 251 | 26 | 55 | 12 | 1 | 7 | 29 | 17 | 53 | 2 | 1 |
| Andrew Susac | R | 29 | C | 62 | 195 | 24 | 39 | 8 | 0 | 8 | 23 | 24 | 70 | 0 | 0 |
| Yusniel Diaz | R | 22 | RF | 112 | 431 | 52 | 110 | 16 | 4 | 10 | 40 | 48 | 107 | 10 | 14 |
| Danny Valencia | R | 34 | 1B | 104 | 356 | 45 | 91 | 15 | 1 | 13 | 47 | 30 | 86 | 1 | 1 |
| Chris Davis | L | 33 | 1B | 124 | 450 | 56 | 88 | 15 | 0 | 23 | 65 | 56 | 197 | 2 | 1 |
| Anthony Santander | B | 24 | RF | 119 | 444 | 49 | 112 | 24 | 2 | 13 | 48 | 24 | 99 | 6 | 2 |
| Zach Vincej | R | 28 | SS | 114 | 391 | 40 | 90 | 15 | 2 | 6 | 34 | 25 | 76 | 5 | 4 |
| Craig Gentry | R | 35 | RF | 80 | 218 | 22 | 48 | 6 | 1 | 2 | 14 | 16 | 54 | 10 | 4 |
| Luis Sardinas | B | 26 | SS | 103 | 348 | 37 | 86 | 11 | 2 | 5 | 29 | 16 | 64 | 6 | 4 |
| D.J. Stewart | L | 25 | RF | 127 | 461 | 60 | 102 | 21 | 2 | 15 | 56 | 52 | 134 | 13 | 6 |
| Brett Cumberland | B | 24 | C | 98 | 339 | 41 | 61 | 14 | 1 | 11 | 34 | 40 | 144 | 0 | 2 |
| Steve Wilkerson | B | 27 | 2B | 92 | 338 | 34 | 73 | 12 | 1 | 5 | 26 | 24 | 109 | 6 | 5 |
| Sharlon Schoop | R | 32 | 2B | 58 | 193 | 19 | 38 | 6 | 1 | 4 | 17 | 14 | 58 | 0 | 2 |
| Ruben Tejada | R | 29 | 2B | 100 | 326 | 34 | 75 | 16 | 0 | 3 | 26 | 22 | 63 | 3 | 1 |
| Chris Bostick | R | 26 | CF | 127 | 458 | 50 | 106 | 21 | 4 | 8 | 43 | 35 | 123 | 9 | 6 |
| Drew Dosch | L | 27 | 3B | 115 | 418 | 43 | 92 | 18 | 3 | 8 | 39 | 28 | 135 | 2 | 1 |
| Adrian Marin | R | 25 | SS | 113 | 405 | 37 | 87 | 14 | 2 | 2 | 25 | 21 | 103 | 8 | 4 |
| Jaycob Brugman | L | 27 | LF | 101 | 382 | 41 | 84 | 14 | 3 | 9 | 39 | 32 | 110 | 6 | 3 |
| Engelb Vielma | B | 25 | SS | 106 | 371 | 33 | 77 | 9 | 2 | 0 | 18 | 23 | 93 | 8 | 7 |
| Erick Salcedo | B | 26 | SS | 131 | 452 | 40 | 100 | 14 | 2 | 2 | 28 | 22 | 72 | 4 | 5 |
| Anderson Feliz | B | 27 | 3B | 115 | 402 | 41 | 81 | 15 | 3 | 8 | 37 | 30 | 135 | 10 | 3 |
| Garabez Rosa | R | 29 | 1B | 126 | 493 | 48 | 119 | 16 | 1 | 10 | 47 | 11 | 133 | 2 | 3 |
| Player | BA | OBP | SLG | OPS+ | ISO | BABIP | RC/27 | Def | WAR | No. 1 Comp |
|---|---|---|---|---|---|---|---|---|---|---|
| Cedric Mullins | .247 | .300 | .400 | 89 | .152 | .287 | 4.5 | 1 | 1.5 | Vernon Wells |
| Jonathan Villar | .245 | .312 | .385 | 89 | .140 | .323 | 4.7 | -2 | 1.4 | Julio Lugo |
| Renato Nunez | .236 | .292 | .430 | 94 | .193 | .280 | 4.5 | -4 | 1.0 | Andy Marte |
| Ryan McKenna | .232 | .307 | .347 | 79 | .114 | .305 | 3.7 | 5 | 0.9 | Marvin Garrison |
| Trey Mancini | .257 | .311 | .451 | 105 | .193 | .312 | 5.1 | -7 | 0.9 | George Scott |
| Hanser Alberto | .258 | .276 | .368 | 74 | .110 | .272 | 3.5 | 7 | 0.8 | Darryl Robinson |
| Rio Ruiz | .229 | .294 | .363 | 79 | .135 | .285 | 3.7 | 4 | 0.7 | Casey Webster |
| Mark Trumbo | .238 | .291 | .442 | 96 | .203 | .275 | 4.6 | 0 | 0.6 | Walt Dropo |
| Adam Jones | .264 | .301 | .414 | 93 | .150 | .290 | 4.6 | -9 | 0.6 | Jose Guillen |
| Colby Rasmus | .214 | .285 | .417 | 88 | .202 | .275 | 4.1 | 4 | 0.6 | Dann Howitt |
| Martin Cervenka | .223 | .269 | .355 | 69 | .132 | .278 | 3.3 | 5 | 0.6 | Craig Tatum |
| Richie Martin | .233 | .295 | .327 | 70 | .093 | .299 | 3.0 | 4 | 0.6 | Jesse Garcia |
| Mike Yastrzemski | .220 | .288 | .371 | 79 | .151 | .285 | 3.7 | 9 | 0.5 | Wynter Phoenix |
| Austin Hays | .253 | .280 | .415 | 87 | .162 | .294 | 4.1 | 5 | 0.5 | Mark Smith |
| Chance Sisco | .238 | .316 | .354 | 83 | .116 | .341 | 4.0 | -5 | 0.5 | Eric Helfand |
| Rylan Bannon | .209 | .299 | .380 | 84 | .170 | .269 | 3.8 | -1 | 0.5 | Tony Schrager |
| Jace Peterson | .222 | .317 | .328 | 78 | .106 | .282 | 3.7 | 1 | 0.4 | Stubby Clapp |
| Corban Joseph | .250 | .299 | .364 | 80 | .114 | .267 | 3.8 | 0 | 0.4 | Kevin Howard |
| Austin Wynns | .234 | .285 | .341 | 70 | .107 | .290 | 3.5 | 0 | 0.3 | Dave Parrish |
| Drew Jackson | .209 | .289 | .317 | 66 | .108 | .287 | 3.2 | 2 | 0.3 | Jimmy Alvarez |
| Joey Rickard | .240 | .309 | .371 | 85 | .131 | .296 | 4.2 | 0 | 0.2 | Jim Paciorek |
| Audry Perez | .250 | .281 | .368 | 76 | .118 | .282 | 3.7 | -1 | 0.2 | Jeff Smith |
| Ryan Mountcastle | .248 | .278 | .395 | 81 | .147 | .296 | 4.0 | -3 | 0.2 | Jeff Hamilton |
| Caleb Joseph | .220 | .263 | .327 | 60 | .107 | .279 | 2.9 | 4 | 0.1 | Frank Charles |
| Carlos Perez | .219 | .269 | .359 | 70 | .139 | .251 | 3.3 | 0 | 0.1 | Jim Horner |
| Andrew Susac | .200 | .288 | .364 | 77 | .164 | .265 | 3.5 | -3 | 0.1 | Danny Ardoin |
| Yusniel Diaz | .255 | .331 | .381 | 94 | .125 | .318 | 4.1 | -3 | 0.0 | Milton Bradley |
| Danny Valencia | .256 | .312 | .413 | 96 | .157 | .304 | 4.6 | -4 | 0.0 | Hector Lopez |
| Chris Davis | .196 | .291 | .382 | 82 | .187 | .283 | 3.7 | 1 | -0.1 | Kurt Airoso |
| Anthony Santander | .252 | .296 | .403 | 89 | .151 | .298 | 4.4 | -4 | -0.1 | Dave Engle |
| Zach Vincej | .230 | .284 | .325 | 66 | .095 | .272 | 3.2 | -1 | -0.2 | Ed Brinkman |
| Craig Gentry | .220 | .277 | .284 | 55 | .064 | .284 | 2.8 | 6 | -0.2 | Jose Cruz |
| Luis Sardinas | .247 | .283 | .333 | 68 | .086 | .290 | 3.3 | -2 | -0.2 | Tom Veryzer |
| D.J. Stewart | .221 | .309 | .373 | 85 | .152 | .279 | 4.0 | -4 | -0.2 | D.J. Boston |
| Brett Cumberland | .180 | .295 | .324 | 70 | .145 | .272 | 3.0 | -5 | -0.3 | Brian Deak |
| Steve Wilkerson | .216 | .274 | .302 | 58 | .086 | .304 | 2.7 | 4 | -0.3 | John Hotchkiss |
| Sharlon Schoop | .197 | .257 | .301 | 52 | .104 | .260 | 2.4 | 2 | -0.4 | Chris Petersen |
| Ruben Tejada | .230 | .289 | .307 | 63 | .077 | .277 | 3.1 | -2 | -0.5 | Tim Cullen |
| Chris Bostick | .231 | .293 | .347 | 74 | .116 | .300 | 3.5 | -7 | -0.6 | Lou Collier |
| Drew Dosch | .220 | .271 | .335 | 64 | .115 | .305 | 3.1 | -1 | -0.6 | John Hotchkiss |
| Adrian Marin | .215 | .258 | .274 | 46 | .059 | .283 | 2.4 | 3 | -0.8 | Jose Escobar |
| Jaycob Brugman | .220 | .282 | .343 | 70 | .123 | .285 | 3.3 | -2 | -0.9 | Johan Limonta |
| Engelb Vielma | .208 | .255 | .243 | 38 | .035 | .277 | 1.9 | 6 | -1.0 | Julius McDougal |
| Erick Salcedo | .221 | .259 | .274 | 46 | .053 | .259 | 2.3 | 3 | -1.2 | Mike Terhune |
| Anderson Feliz | .201 | .258 | .313 | 55 | .112 | .282 | 2.8 | -5 | -1.4 | Mike Jirschele |
| Garabez Rosa | .241 | .261 | .339 | 62 | .097 | .311 | 3.1 | -1 | -1.9 | Tommy Davis |
| Player | T | Age | W | L | ERA | G | GS | IP | H | ER | HR | BB | SO |
|---|---|---|---|---|---|---|---|---|---|---|---|---|---|
| Dylan Bundy | R | 26 | 11 | 11 | 4.55 | 29 | 29 | 164.0 | 163 | 83 | 29 | 50 | 158 |
| Mychal Givens | R | 29 | 5 | 3 | 3.19 | 66 | 0 | 73.3 | 61 | 26 | 5 | 28 | 79 |
| Alex Cobb | R | 31 | 9 | 9 | 4.50 | 24 | 24 | 136.0 | 149 | 68 | 19 | 36 | 89 |
| Paul Fry | L | 26 | 4 | 3 | 3.93 | 57 | 1 | 73.3 | 67 | 32 | 7 | 33 | 73 |
| Tanner Scott | L | 24 | 4 | 3 | 3.71 | 65 | 0 | 63.0 | 51 | 26 | 4 | 40 | 79 |
| Richard Bleier | L | 32 | 2 | 1 | 3.44 | 45 | 0 | 49.7 | 54 | 19 | 3 | 8 | 22 |
| Donnie Hart | L | 28 | 3 | 2 | 3.77 | 54 | 0 | 59.7 | 61 | 25 | 4 | 20 | 44 |
| Jimmy Yacabonis | R | 27 | 4 | 5 | 4.89 | 40 | 21 | 103.0 | 107 | 56 | 12 | 50 | 76 |
| Mike Wright | R | 29 | 4 | 5 | 4.99 | 39 | 11 | 101.0 | 110 | 56 | 16 | 36 | 79 |
| Miguel Castro | R | 24 | 5 | 5 | 4.57 | 63 | 0 | 90.7 | 90 | 46 | 8 | 47 | 56 |
| Cody Carroll | R | 26 | 3 | 3 | 4.43 | 51 | 0 | 63.0 | 58 | 31 | 6 | 39 | 64 |
| Gregory Infante | R | 31 | 3 | 3 | 4.47 | 53 | 0 | 54.3 | 55 | 27 | 6 | 23 | 44 |
| Zach Pop | R | 22 | 3 | 3 | 4.40 | 53 | 0 | 61.3 | 64 | 30 | 6 | 28 | 47 |
| Tanner Chleborad | R | 26 | 3 | 4 | 4.55 | 41 | 0 | 57.3 | 63 | 29 | 6 | 20 | 33 |
| Josh Lucas | R | 28 | 2 | 2 | 4.45 | 44 | 1 | 54.7 | 58 | 27 | 7 | 21 | 44 |
| Jhan Marinez | R | 30 | 2 | 2 | 4.66 | 48 | 1 | 58.0 | 62 | 30 | 8 | 26 | 46 |
| Chris Lee | L | 26 | 4 | 6 | 5.30 | 23 | 16 | 88.3 | 101 | 52 | 10 | 46 | 50 |
| Josh Rogers | L | 24 | 8 | 11 | 5.40 | 25 | 25 | 131.7 | 159 | 79 | 23 | 38 | 76 |
| John Means | L | 26 | 7 | 9 | 5.40 | 27 | 25 | 143.3 | 170 | 86 | 26 | 39 | 92 |
| Hunter Harvey | R | 24 | 1 | 2 | 5.12 | 10 | 10 | 31.7 | 34 | 18 | 5 | 11 | 24 |
| Branden Kline | R | 27 | 4 | 4 | 4.74 | 46 | 0 | 57.0 | 60 | 30 | 8 | 24 | 45 |
| Dean Kremer | R | 23 | 6 | 9 | 5.25 | 25 | 25 | 121.7 | 132 | 71 | 21 | 64 | 123 |
| Andrew Cashner | R | 32 | 7 | 10 | 5.28 | 25 | 25 | 136.3 | 155 | 80 | 21 | 56 | 83 |
| Bruce Zimmermann | L | 24 | 7 | 10 | 5.29 | 24 | 24 | 114.0 | 128 | 67 | 19 | 54 | 92 |
| D.J. Snelten | L | 27 | 3 | 3 | 4.83 | 41 | 0 | 54.0 | 57 | 29 | 5 | 31 | 40 |
| Matt Wotherspoon | R | 27 | 4 | 5 | 5.27 | 36 | 10 | 85.3 | 90 | 50 | 15 | 39 | 76 |
| Dillon Tate | R | 25 | 5 | 6 | 5.49 | 21 | 20 | 103.3 | 121 | 63 | 16 | 42 | 61 |
| Gabriel Ynoa | R | 26 | 7 | 10 | 5.31 | 28 | 23 | 135.7 | 164 | 80 | 23 | 33 | 78 |
| Zach Muckenhirn | L | 24 | 2 | 2 | 4.76 | 49 | 0 | 62.3 | 64 | 33 | 7 | 33 | 50 |
| Keegan Akin | L | 24 | 8 | 12 | 5.51 | 24 | 24 | 116.0 | 123 | 71 | 20 | 62 | 97 |
| Austin Brice | R | 27 | 3 | 4 | 4.85 | 53 | 0 | 59.3 | 62 | 32 | 9 | 23 | 49 |
| Luis H. Gonzalez | L | 27 | 3 | 3 | 5.00 | 42 | 0 | 63.0 | 65 | 35 | 10 | 31 | 56 |
| Pedro Araujo | R | 25 | 2 | 3 | 5.06 | 31 | 0 | 42.7 | 42 | 24 | 7 | 23 | 44 |
| Eddie Gamboa | R | 34 | 4 | 7 | 5.68 | 19 | 12 | 76.0 | 83 | 48 | 11 | 46 | 50 |
| Andrew Faulkner | L | 26 | 3 | 4 | 5.24 | 49 | 0 | 55.0 | 58 | 32 | 7 | 33 | 42 |
| Sean Gilmartin | L | 29 | 4 | 6 | 5.45 | 37 | 10 | 79.3 | 93 | 48 | 15 | 27 | 54 |
| Luis Ortiz | R | 23 | 4 | 7 | 5.72 | 24 | 19 | 94.3 | 113 | 60 | 19 | 36 | 64 |
| Joely Rodriguez | L | 27 | 3 | 4 | 5.27 | 42 | 1 | 54.7 | 60 | 32 | 8 | 27 | 41 |
| David Hess | R | 25 | 7 | 11 | 5.71 | 27 | 26 | 132.3 | 150 | 84 | 27 | 53 | 94 |
| Evan Phillips | R | 24 | 4 | 6 | 5.40 | 48 | 1 | 56.7 | 55 | 34 | 10 | 34 | 62 |
| Lucas Long | R | 26 | 6 | 9 | 5.77 | 30 | 16 | 107.7 | 131 | 69 | 21 | 31 | 62 |
| Yefry Ramirez | R | 25 | 6 | 10 | 5.65 | 28 | 24 | 121.0 | 130 | 76 | 24 | 56 | 102 |
| Brian Gonzalez | L | 23 | 6 | 10 | 5.91 | 23 | 22 | 115.7 | 135 | 76 | 19 | 63 | 72 |
| Jay Flaa | R | 27 | 2 | 3 | 6.02 | 39 | 0 | 52.3 | 54 | 35 | 10 | 36 | 48 |
| Jordan Kipper | R | 26 | 5 | 8 | 6.06 | 22 | 19 | 104.0 | 132 | 70 | 20 | 37 | 50 |
| Matthew Grimes | R | 27 | 3 | 5 | 6.10 | 29 | 14 | 90.0 | 109 | 61 | 17 | 39 | 52 |
| Tim Melville | R | 29 | 5 | 9 | 6.54 | 33 | 15 | 95.0 | 114 | 69 | 22 | 47 | 65 |
| Player | TBF | K/9 | BB/9 | HR/9 | BABIP | ERA+ | ERA- | FIP | WAR | No. 1 Comp |
|---|---|---|---|---|---|---|---|---|---|---|
| Dylan Bundy | 701 | 8.67 | 2.74 | 1.59 | .293 | 94 | 106 | 4.56 | 1.7 | Felipe Lira |
| Mychal Givens | 308 | 9.70 | 3.44 | 0.61 | .292 | 135 | 74 | 3.19 | 1.6 | Billy Koch |
| Alex Cobb | 587 | 5.89 | 2.38 | 1.26 | .297 | 96 | 105 | 4.56 | 1.5 | Al Fitzmorris |
| Paul Fry | 319 | 8.96 | 4.05 | 0.86 | .297 | 110 | 91 | 3.91 | 0.9 | Randy Choate |
| Tanner Scott | 278 | 11.29 | 5.71 | 0.57 | .307 | 116 | 86 | 3.47 | 0.8 | Felix Heredia |
| Richard Bleier | 210 | 3.99 | 1.45 | 0.54 | .293 | 121 | 83 | 3.71 | 0.8 | Pedro Borbon |
| Donnie Hart | 258 | 6.64 | 3.02 | 0.60 | .305 | 114 | 88 | 3.70 | 0.8 | Leo Kiely |
| Jimmy Yacabonis | 465 | 6.64 | 4.37 | 1.05 | .297 | 88 | 114 | 4.85 | 0.6 | Joaquin Andujar |
| Mike Wright | 449 | 7.04 | 3.21 | 1.43 | .303 | 86 | 116 | 4.95 | 0.3 | Bert Bradley |
| Miguel Castro | 406 | 5.56 | 4.67 | 0.79 | .282 | 94 | 106 | 4.75 | 0.3 | Hal Reniff |
| Cody Carroll | 285 | 9.14 | 5.57 | 0.86 | .301 | 97 | 103 | 4.36 | 0.3 | Clay Bryant |
| Gregory Infante | 240 | 7.29 | 3.81 | 0.99 | .299 | 96 | 104 | 4.40 | 0.3 | Tony Fiore |
| Zach Pop | 274 | 6.90 | 4.11 | 0.88 | .305 | 95 | 106 | 4.41 | 0.2 | Gary Ross |
| Tanner Chleborad | 253 | 5.18 | 3.14 | 0.94 | .298 | 94 | 106 | 4.56 | 0.2 | Casey Cox |
| Josh Lucas | 242 | 7.24 | 3.46 | 1.15 | .305 | 94 | 107 | 4.52 | 0.2 | Todd Williams |
| Jhan Marinez | 262 | 7.14 | 4.03 | 1.24 | .303 | 92 | 108 | 4.91 | 0.2 | Bruce Dal Canton |
| Chris Lee | 410 | 5.09 | 4.69 | 1.02 | .304 | 81 | 123 | 5.22 | 0.2 | Bill Wight |
| Josh Rogers | 587 | 5.19 | 2.60 | 1.57 | .306 | 80 | 126 | 5.27 | 0.1 | Bobby Livingston |
| John Means | 636 | 5.78 | 2.45 | 1.63 | .306 | 80 | 126 | 5.21 | 0.1 | Heath Phillips |
| Hunter Harvey | 139 | 6.82 | 3.13 | 1.42 | .296 | 84 | 119 | 4.82 | 0.1 | Tommy Boggs |
| Branden Kline | 254 | 7.11 | 3.79 | 1.26 | .299 | 91 | 110 | 4.82 | 0.1 | Scott Munter |
| Dean Kremer | 559 | 9.10 | 4.73 | 1.55 | .322 | 79 | 126 | 5.10 | 0.1 | Jim Converse |
| Andrew Cashner | 614 | 5.48 | 3.70 | 1.39 | .298 | 79 | 127 | 5.28 | 0.1 | Bill Singer |
| Bruce Zimmermann | 523 | 7.26 | 4.26 | 1.50 | .311 | 79 | 127 | 5.31 | 0.0 | Derek Thompson |
| D.J. Snelten | 249 | 6.67 | 5.17 | 0.83 | .306 | 89 | 112 | 4.76 | 0.0 | Brian Adams |
| Matt Wotherspoon | 384 | 8.02 | 4.11 | 1.58 | .301 | 82 | 123 | 5.20 | 0.0 | Mark Woodyard |
| Dillon Tate | 471 | 5.31 | 3.66 | 1.39 | .303 | 78 | 128 | 5.38 | 0.0 | Jake Joseph |
| Gabriel Ynoa | 599 | 5.17 | 2.19 | 1.53 | .307 | 79 | 127 | 5.07 | 0.0 | Nick Blackburn |
| Zach Muckenhirn | 283 | 7.22 | 4.76 | 1.01 | .302 | 87 | 114 | 4.79 | 0.0 | Philip Barzilla |
| Keegan Akin | 531 | 7.53 | 4.81 | 1.55 | .299 | 78 | 128 | 5.50 | 0.0 | Scott Forster |
| Austin Brice | 263 | 7.43 | 3.49 | 1.37 | .298 | 86 | 116 | 4.84 | -0.1 | Jimmy Myers |
| Luis H. Gonzalez | 284 | 8.00 | 4.43 | 1.43 | .301 | 86 | 116 | 5.10 | -0.1 | Philip Barzilla |
| Pedro Araujo | 193 | 9.28 | 4.85 | 1.48 | .302 | 82 | 121 | 5.05 | -0.1 | Josh Kinney |
| Eddie Gamboa | 355 | 5.92 | 5.45 | 1.30 | .295 | 76 | 132 | 5.69 | -0.2 | Lou Kretlow |
| Andrew Faulkner | 255 | 6.87 | 5.40 | 1.15 | .300 | 82 | 122 | 5.24 | -0.2 | Philip Barzilla |
| Sean Gilmartin | 356 | 6.13 | 3.06 | 1.70 | .305 | 77 | 131 | 5.42 | -0.3 | Clyde Wright |
| Luis Ortiz | 430 | 6.11 | 3.43 | 1.81 | .307 | 75 | 133 | 5.72 | -0.3 | Tim Dixon |
| Joely Rodriguez | 251 | 6.75 | 4.45 | 1.32 | .304 | 79 | 126 | 5.25 | -0.3 | Brian Adams |
| David Hess | 598 | 6.39 | 3.60 | 1.84 | .296 | 75 | 133 | 5.76 | -0.3 | Dana Kiecker |
| Evan Phillips | 258 | 9.85 | 5.40 | 1.59 | .302 | 77 | 130 | 5.21 | -0.4 | Kevin Rychel |
| Lucas Long | 482 | 5.18 | 2.59 | 1.76 | .304 | 75 | 134 | 5.56 | -0.4 | Eddie Bonine |
| Yefry Ramirez | 547 | 7.59 | 4.17 | 1.79 | .296 | 74 | 136 | 5.60 | -0.5 | Mark Carper |
| Brian Gonzalez | 543 | 5.60 | 4.90 | 1.48 | .304 | 73 | 137 | 5.86 | -0.5 | Matt Coenen |
| Jay Flaa | 246 | 8.25 | 6.19 | 1.72 | .295 | 71 | 140 | 6.04 | -0.7 | Scott Schoeneweis |
| Jordan Kipper | 478 | 4.33 | 3.20 | 1.73 | .307 | 71 | 141 | 5.93 | -0.7 | Pat Ahearne |
| Matthew Grimes | 416 | 5.20 | 3.90 | 1.70 | .304 | 71 | 142 | 5.92 | -0.7 | Wes Wilkerson |
| Tim Melville | 444 | 6.16 | 4.45 | 2.08 | .302 | 66 | 152 | 6.43 | -1.2 | John Kelly |
Disclaimer: ZiPS projections are computer-based projections of performance. Performances have not been allocated to predicted playing time in the majors — many of the players listed above are unlikely to play in the majors at all in 2019. ZiPS is projecting equivalent production — a .240 ZiPS projection may end up being .280 in AAA or .300 in AA, for example. Whether or not a player will play is one of many non-statistical factors one has to take into account when predicting the future.
Players are listed with their most recent teams, unless I have made a mistake. This is very possible, as a lot of minor-league signings go generally unreported in the offseason.
ZiPS’ projections are based on the American League having a 4.29 ERA and the National League having a 4.15 ERA.
Players who are expected to be out due to injury are still projected. More information is always better than less information, and a computer isn’t the tool that should project the injury status of, for example, a pitcher who has had Tommy John surgery.
Both hitters and pitchers are ranked by projected zWAR — which is to say, WAR values as calculated by me, Dan Szymborski, whose surname is spelled with a z. WAR values might differ slightly from those which appear in full release of ZiPS. Finally, I will advise anyone against — and might karate chop anyone guilty of — merely adding up WAR totals on a depth chart to produce projected team WAR.
Dan Szymborski is a senior writer for FanGraphs and the developer of the ZiPS projection system. He was a writer for ESPN.com from 2010-2018, a regular guest on a number of radio shows and podcasts, and a voting BBWAA member. He also maintains a terrible Twitter account at @DSzymborski.
Forget the random good player on a bad team that gives you someone fun to watch if you “luck” into tickets . There isn’t even a single player on the O’s who projects to a league average 2.0. Bundy and Cobb aspire to that if they manage to have good seasons.
ouch