A Look at the Defenses of the 2025 Postseason Teams
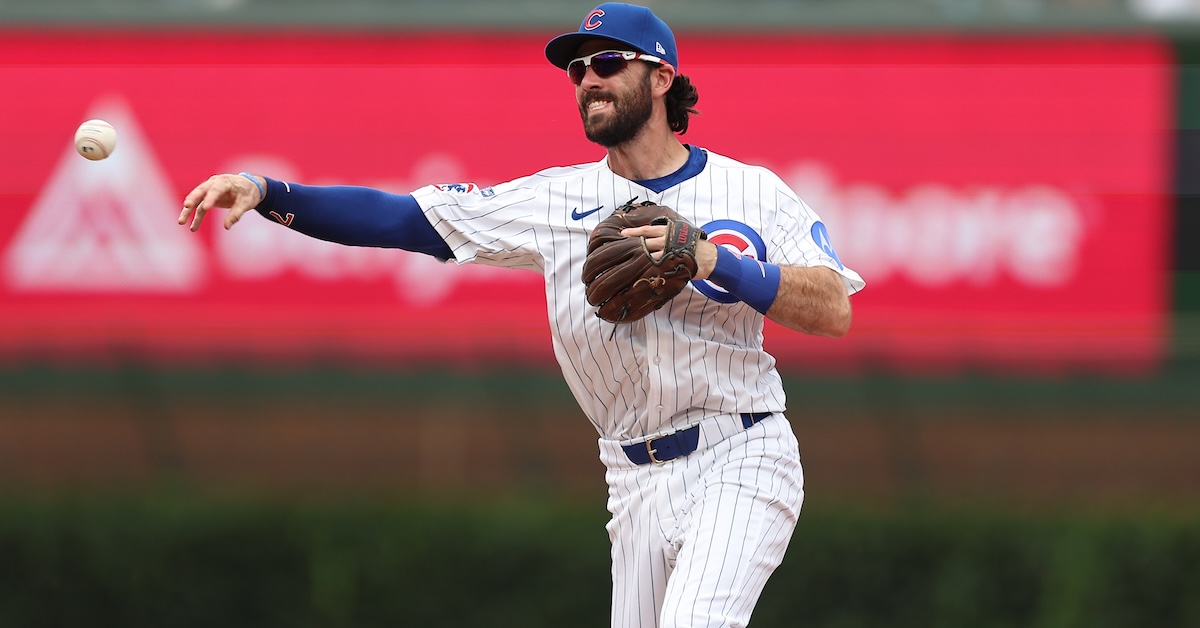
Dansby Swanson brought home back-to-back Gold Gloves in 2022 with the Braves and ’23 with the Cubs while leading the majors in Statcast’s Fielding Run Value in both seasons. Although he hasn’t added any hardware to his collection since then, and while his defensive metrics have slipped, he still grades out as comfortably above average in both FRV and Defensive Runs Saved. His defensive acumen was on display in Tuesday’s Wild Card Series opener between the Cubs and Padres, as he made a couple of pivotal, run-saving plays in Chicago’s 3-1 victory.
The Padres had taken the lead in the second inning, when Jackson Merrill and Xander Bogaerts opened the frame with back-to-back doubles off Matthew Boyd; Bogaerts took third when center fielder Pete Crow-Armstrong’s relay spurted away from Nico Hoerner at second base. Ryan O’Hearn then hit a sizzling 101-mph groundball, and Swanson, who was shaded up the middle, dove to his right to stop it. He looked Bogaerts back to third base, then threw to first for the out. The play loomed large as Bogaerts ended up stranded.
The Padres threatened again in the fourth, when Manny Machado drew a leadoff walk and took second on Merrill’s sacrifice bunt. Bogaerts legged out a chopper into the no-man’s land to the right of the mound for an infield single, and San Diego appeared poised to capitalize when O’Hearn hit a flare into shallow center field. Swanson had other ideas, making a great over-the-shoulder snag of the ball, then in one motion turning to fire home to keep Machado honest.
Crow-Armstrong then ran down Gavin Sheets’ towering fly ball in the right-center gap to end the threat. Aside from a Freddy Fermin single the next inning, the Padres didn’t produce another baserunner all day, while the Cubs scored three times, including back-to-back solo homers by Seiya Suzuki and Carson Kelly off Nick Pivetta in the fifth.
Swanson’s plays serve as shining examples of the importance of strong defense in the postseason, where baserunners and runs are harder to come by. And as it happens, the Cubs rate as having the best defense in all of baseball, with a unit that towers above all but one other playoff team. In addition to Swanson’s Gold Gloves, Hoerner won in 2023, and left fielder Ian Happ is riding a three-award streak.
This is the third year in a row I’ve evaluated team defenses in midseason and heading into October by dipping into the alphabet soup of defensive metrics, including FRV, DRS, and our own catcher framing metric (hereafter abbreviated as FRM, as it is on our stat pages). Longtime standby Ultimate Zone Rating (UZR) has been retired, which required me to adjust my methodology.
On an individual level, even a full season of data isn’t enough to provide a crystal-clear picture of a player’s defense, so it’s not surprising when the major metrics produce divergent values. After all, they’re based on differing methodologies that produce varying spreads in runs from top to bottom, spreads that owe something to what they don’t measure, as well as how much regression is built into their systems. Pitchers don’t have FRVs, and DRS tends to produce more extreme ratings (positive and negative) than Statcast; the latter also has a team positioning component. But within this aggregation, I believe we get enough signal to justify the effort, a good point of entry into a broad topic, if not a bulletproof methodology.
To account for the bits in the alphabet soup, I aggregated the aforementioned metrics, adjusting for the varying spreads in run values by using standard deviation scores (z-scores), which measure how many standard deviations each team is from the league average in each category. As with last year and back in July, I’ve broken out catcher values for both FRV and DRS from the rest of a team’s values in both metrics. Note that the version of DRS that we display on FanGraphs now includes a framing component (rSZ, for strike zone) that isn’t used in Baseball Reference’s WAR calculations. (You can find it on a player’s fielding page.) The three catcher measures (including FRV) are each weighted at one-half the value of the non-catcher scores, which improves the overall z-score formula’s correlation with run prevention. New for this year, I’m using Defensive Efficiency, the rate at which a team turns batted balls into outs, published at Baseball Reference. I originally weighted that equally with non-catcher DRS and FRV, but found that weighting it at 1.5 times improved the correlation with run prevention. Last year’s midseason z-score formula had a -.39 correlation with runs allowed per game (higher scores mean fewer runs allowed), but with this year’s reconfigured formula, that correlation improved to -.75 at midseason, and to -.76 at season’s end.
| Team | DRSnonC-z | DRSC-Z | FRM-z | FRVnonC-Z | FRVC-z | DefEff-z | Tot |
|---|---|---|---|---|---|---|---|
| Cubs | 2.14 | 0.36 | -0.29 | 1.78 | 0.57 | 1.46 | 6.43 |
| Blue Jays | 1.66 | 2.24 | 1.76 | 0.73 | 2.40 | 0.14 | 5.79 |
| Rangers | 2.30 | -0.11 | -0.02 | 1.41 | -0.30 | 1.53 | 5.79 |
| Brewers | 0.57 | -0.11 | -0.51 | 1.31 | 0.42 | 0.77 | 2.92 |
| Padres | -0.17 | 0.60 | -0.01 | 0.32 | -0.30 | 1.32 | 2.28 |
| Guardians | -0.01 | 1.07 | 0.80 | 0.79 | 1.13 | 0.00 | 2.27 |
| Royals | 0.89 | -0.93 | -0.74 | 1.36 | -0.46 | 0.70 | 2.23 |
| Yankees | 0.41 | -0.81 | 1.65 | -0.26 | 0.97 | 0.70 | 2.10 |
| Pirates | 0.41 | 0.01 | -0.08 | 0.63 | -0.22 | 0.63 | 1.83 |
| Red Sox | 0.54 | 1.18 | 0.15 | 0.68 | 0.49 | -0.49 | 1.40 |
| Astros | -0.20 | -0.57 | -0.65 | 1.36 | -0.46 | 0.70 | 1.36 |
| Giants | -0.04 | 2.00 | 2.76 | -0.88 | 2.40 | -0.98 | 1.20 |
| Braves | 0.50 | 0.95 | -0.07 | 0.00 | 0.49 | 0.00 | 1.19 |
| Cardinals | 0.02 | 0.95 | 0.87 | 0.89 | 0.42 | -0.63 | 1.09 |
| Marlins | 0.70 | -1.16 | 0.58 | 0.68 | -0.93 | 0.14 | 0.83 |
| Dodgers | 0.95 | -1.04 | -0.97 | 0.52 | -0.78 | 0.42 | 0.71 |
| Tigers | -0.46 | 0.48 | 0.87 | -0.52 | 1.05 | 0.28 | 0.65 |
| Diamondbacks | -0.36 | 0.36 | 0.09 | 0.37 | 0.49 | -0.21 | 0.17 |
| Reds | -0.62 | -0.69 | -0.18 | -0.05 | -0.54 | 0.91 | -0.01 |
| Mets | 0.15 | 1.30 | 0.11 | -0.78 | 0.73 | -0.70 | -0.60 |
| Rays | 0.34 | 0.60 | -0.27 | -1.20 | -1.33 | 0.49 | -0.62 |
| Mariners | -0.49 | -0.22 | 1.20 | -1.66 | 0.26 | 0.35 | -1.01 |
| Phillies | -0.39 | 0.01 | -0.91 | -0.36 | -0.46 | -0.49 | -2.16 |
| Athletics | -0.94 | -1.51 | -1.19 | -0.67 | -0.14 | 0.00 | -3.03 |
| Orioles | -0.97 | 0.01 | -0.06 | -1.04 | -0.06 | -0.98 | -3.53 |
| Twins | -1.38 | -0.69 | -0.01 | -0.57 | -0.93 | -0.98 | -4.24 |
| White Sox | -1.16 | -1.16 | -1.15 | -1.04 | -1.49 | -0.14 | -4.31 |
| Angels | -1.45 | -1.63 | -1.46 | -1.82 | -1.17 | -0.63 | -6.34 |
| Nationals | -1.10 | -0.81 | -1.83 | -1.46 | -1.73 | -1.32 | -6.72 |
| Rockies | -1.83 | -0.69 | -0.43 | -0.52 | -0.54 | -2.58 | -7.05 |
Mind the gaps! The distance in score between the third-ranked Rangers and fourth-ranked Brewers is greater than that between the Brewers and 17th-ranked Tigers, and the distance between the eighth-ranked Yankees and 19th-ranked Reds is greater than that between the Reds and 23rd-ranked Phillies. What follows is a closer look at all 12 postseason teams, pointing out the the measures that stand out the most for better or worse, as well some notable conflicts in the metrics. I’ll work from the top of the table to the bottom.
Cubs
The Cubs ranked second overall behind the Rangers in DRS (83), FRV (41), and Defensive Efficiency (.719) before I did the voodoo that I do to hammer the numbers into the form above; better catching than the home-for-October Rangers put the Cubs on top. Chicago is exceptionally strong up the middle, with Crow-Armstrong ranking second only to Ceddanne Rafaela in both FRV and DRS (21 and 16, respectively), Hoerner leading second basemen in both categories (17 DRS, 12 FRV), and Swanson sixth in DRS (7) with 3 FRV, as well. The Statcast ratings for starting catcher Carson Kelly’s throwing and backup Reese McGuire’s framing helped them score reasonably well in those categories, too. Third baseman Matt Shaw and left fielder Ian Happ both scored very well via DRS (12 for the former, 9 for the latter) but about average in FRV. Suzuki was the lowest-rated Cubs position player by DRS (-4, with -1 FRV), but he spent most of the season DHing, playing only 282 innings in right field.
Blue Jays
I highlighted the Blue Jays defense in the midsummer version of this exercise, and while they surrendered the top spot to the Cubs, their defense is just fine. Catcher Alejandro Kirk ranked second only to Patrick Bailey with 21 FRV and 11.3 FRM; backup Tyler Heineman (7 FRV, 2.8 FRM) helped the Jays further dominate those categories. Infielder Ernie Clement totaled 11 DRS and 4 FRV in 603 innings at third base, as well as 10 DRS and 4 FRV in 423 1/3 innings at second base, plus 1 FRV (and 0 DRS) in 170 innings at short, and 1 DRS (and 0 FRV) in 69 innings at first base.
Other defensive standouts include center fielders Myles Straw (15 DRS, 11 FRV) and Daulton Varsho (10 DRS, 6 FRV), and second baseman Andrés Giménez (9 DRS, 7 FRV). The AL Platinum Glove winner in 2023 (and a three-time Gold Glover), Giménez has been covering shortstop lately in the absence of Bo Bichette, who has been sidelined by a sprained ligament in his left knee traceable to a collision at home plate on September 6. Though just average by small-sample metrics, Giménez’s play at shortstop is a massive upgrade on Bichette, whose -13 DRS and -10 FRV both ranked dead last at the position. If Bichette returns for the Division Series, he could be limited to DH duty, which would force George Springer back to right field, where he was six runs below average by both metrics in just 283 2/3 innings.
Brewers
The aforementioned gap between third and fourth in the rankings helps to explain how Milwaukee can place so high despite having just one player who’s particularly strong by both metrics: right fielder Sal Frelick (9 DRS, 7 FRV), a 2024 Gold Glove winner. More common here are players with one good metric and one average-ish one, such as shortstop Joey Ortiz (10 FRV, -2 DRS), second baseman and reigning NL Platinum Glove winner Brice Turang (6 DRS, 0 FRV), third baseman Caleb Durbin (6 DRS, 1 FRV), and catcher William Contreras (3 FRV, -2.7 FRM). Center fielder Jackson Chourio is a mild surprise at the other end of the spectrum (-4 DRS, 2 FRV) following a strong rookie season split between the outfield corners.
Padres
The Padres ranked third in the majors in defensive efficiency (.717) behind only the Cubs (.719) and Rangers (.720). Former NL Platinum Glove winner Fernando Tatis Jr. is the star here; he led all right fielders in FRV (10) and ranked second in DRS (15). Most of the other notable Padres who are more than a few runs in either direction of average have one good (or bad) metric and one that’s pretty ordinary, such as Bogaerts (7 FRV, -4 DRS in his return to shortstop), Merrill (5 FRV, 0 DRS in center), Machado (-4 FRV, 2 DRS at third base), first baseman Luis Arraez (4 FRV, -4 DRS), and second baseman Jake Cronenworth (-2 FRV, -8 DRS). It’s worth noting this team is much improved relative to the midseason rankings, thanks in large part to the arrival of Fermin (6 DRS, 1 FRV with San Diego, 13 DRS, 2 FRV overall), who upgraded a dreadful catching situation by replacing Martín Maldonado.
Guardians
The Guardians have a few defensive stars. Left fielder Steven Kwan has already banked two Gold Gloves and appears well on his way to a third given that he led all left fielders by wide margins in both DRS and FRV (22 and 14, respectively). First baseman Carlos Santana, who won his first Gold Glove last year at age 38, ranked second among all first basemen in DRS (12, 11 with Cleveland) and tied for third in FRV (6, 5 with Cleveland) — but his third go-round with the team ended in late August when he was released. (The Cubs, who signed him, optioned Santana to the Arizona Complex League last week, and he is part of their taxi squad in case of injury for their Wild Card Series against the Padres.). The defense has taken a step down with Kyle Manzardo’s play there, as he put up -7 DRS and -2 FRV in 459 2/3 innings at first. Jhonkensy Noel, who started against lefty Tarik Skubal on Tuesday, was average-ish in just 50 innings there. Catcher Austin Hedges perennially lives up to Nichols’ Law of Catcher Defense, as he offset his 51 wRC+ by ranking among the top five in all three catcher metrics under consideration (11 FRV, 10.1 FRM, 10 DRS). José Ramírez ranked fourth among third basemen with 6 FRV but was just average by DRS. Shortstop Gabriel Arias and second baseman/center fielder Daniel Schneemann were a few runs above average by both metrics, the latter at both positions — much better than fellow center fielder Angel Martínez (-8 DRS, -3 FRV).
Yankees
Austin Wells drove the Yankees’ strong catching numbers, ranking fourth in the majors in FRM (10.0) and tying for fourth in Statcast’s more comprehensive FRV (11). Jazz Chisholm Jr. was much better at second base (5 FRV, 2 DRS) than third, where deadline acquisition Ryan McMahon provided a considerable upgrade (7 DRS, 2 FRV with the Yankees, 10 DRS, 6 FRV overall). In the outfield, Cody Bellinger spread his time across all three spots, with most of his time in left field, which in Yankee Stadium generally requires a center field-caliber fly chaser; overall he had 12 DRS and 9 FRV. Aaron Judge’s 822 1/3 innings in right field were his most since 2021, but while he was very good overall (5 FRV, 3 DRS), his throwing hasn’t been the same since he strained his right flexor tendon in late July, which confined him to DH-only duty in his first month back; he played 15 games in right in September. In the Wild Card Series opener on Tuesday night, Red Sox second baseman Nick Sogard challenged Judge’s arm by hustling for a double on a ball hit into right-center. That set up Masataka Yoshida’s go-ahead two-run single, and afterwards Red Sox manager Alex Cora diplomatically hinted at an awareness of Judge’s current limitations, saying of Sogard’s aggressiveness, “That’s preparation. We talk about their outfielders and what can we do or what we cannot do, and he saw it right away and took advantage of it.”
Judge isn’t the only concern in the outfield, as Trent Grisham may be a bit stretched in center these days (-12 DRS, -3 FRV), though his bat has been essential to the Yankees. Shortstop Anthony Volpe, whose defense was previously his calling card, was a mixed bag metrically (-5 FRV, 1 DRS), with throwing issues, some uncharacteristic hesitancy on grounders, and some glaring mental lapses; colleague Esteban Rivera took a deep dive into Volpe’s troubles on Tuesday. Between Tampa Bay and New York, deadline acquisition José Caballero was very good at shortstop in a 336-inning sample (4 FRV, 4 DRS), offering manager Aaron Boone an alternative. With the lefty Garrett Crochet on the mound for Boston in Game 1, the righty-hitting Caballero started at third base, where he was about average in 117 innings between the two teams (1 DRS, 1 FRV).
Red Sox
The aforementioned Rafaela is an elite defender who led all major league center fielders in both DRS (22) and FRV (21). Likewise, Wilyer Abreu captured at least a share of second in both metrics (15 DRS, 8 FRV) despite playing just 847 innings in right field, over 400 fewer than Tatis. Carlos Narváez ranked seventh among all catchers in FRV (9), with strong showings in both framing and throwing. Left fielder Jarren Duran had mixed metrics (11 DRS, -1 FRV), but the team’s most glaring defensive weakness is Trevor Story, who ranked among the bottom five shortstop regulars in both (-7 DRS, -8 FRV).
Dodgers
Mookie Betts’ conversion to shortstop in his early 30s is pretty much without precedent, and it’s backed by exceptional metrics. In his first full season at the position, the six-time Gold Glover in right field tied for the major league lead among shortstops with 17 DRS, and cracked the top 10 with 4 FRV. Andy Pages, who saved the Dodgers’ bacon with his bat time and again this season, was a godsend on defense as well, totaling 12 FRV and 8 DRS across the three positions, with the lion’s share of his playing time in center. Utilitymen Enrique Hernández, Miguel Rojas, and Tommy Edman were average or better by at least one metric at just about every position they played, making them invaluable moving parts for a team that had to overcome numerous injuries. In small samples, Hyeseong Kim was solid in center field and exceptional at second (9 DRS and 3 FRV in just 278 innings).
On the other side of the spectrum, Michael Conforto was not just a disaster at the plate, but also in left field (-8 DRS, -5 FRV); mercifully, he was left off the Wild Card Series roster. Max Muncy had mixed metrics at third (-4 FRV, 3 DRS) and Freddie Freeman took a step back after last fall’s ankle troubles (-7 DRS, -1 FRV). For as strong as his offense was, catcher Will Smith’s defense basically collapsed (-8 DRS, -8 FRV, -6.8 FRM). Though he is on the Wild Card Series roster, he may not do much catching this October due to a hairline fracture in his right hand, leaving manager Dave Roberts with a choice between high-upside rookie Dalton Rushing (who was slightly below average across the board) and light-hitting journeyman Ben Rortvedt.
Tigers
The wonderfully alliterative Dillon Dingler is the Tigers’ defensive star, at least by the numbers. He ranked fourth among all catchers with 12 FRV, seventh with 5.5 FRM, and tied for 12th with 6 DRS. The Tiger that’s impossible to take your eyes off is Javier Báez, who couldn’t maintain his hot start offensively but added center field to his repertoire when the team’s depth chart was decimated early this year. He was average or better there, at third base, and at shortstop, where he’s gotten most of his playing time lately. The case for playing him at short is amplified by Trey Sweeney’s struggles there (-5 DRS, -5 FRV); meanwhile, Parker Meadows is finally healthy and about average in center.
Left fielder Riley Greene and second baseman Gleyber Torres were a few runs below average by both metrics. Zach McKinstry was average or better in small slices of playing time at shortstop and left field but struggled notably at third base (-8 DRS, -1 FRV), where he played 578 1/3 innings. Wenceel Pérez was a plus in right field (5 FRV, 3 DRS) but was stretched in center (-1 FRV, -4 DRS in just 183 innings).
Reds
Aside from making a strong showing driven by the majors’ fourth-highest Defensive Efficiency (.711), the Reds graded as slightly below average everywhere else. Catcher Tyler Stephenson made just 65 starts to Jose Trevino’s 84, but he was subpar across the board (-5.1 FRM, -5 FRV, -4 DRS), while Trevino was about average save for his 3.9 FRM. On the positive side, Spencer Steer was very good at first base (8 DRS, 4 FRV), and the deadline acquisition of Ke’Bryan Hayes shored up both third base and right field, since Noelvi Marte took to the move to the outfield. Including his time in Pittsburgh, Hayes led all third basemen in both DRS (19) and FRV (17), while Marte had 5 DRS (and 0 FRV) in 437 1/3 innings in right. Elsewhere, several Reds were all over the map, with one average-or-better metric and one bad one, including second baseman Matt McLain (5 FRV, -6 DRS), shortstop Elly De La Cruz (0 FRV, -5 DRS), and center fielder TJ Friedl (-10 DRS, 0 FRV).
Mariners
Seattle was legitimately subpar defensively, with a few standouts surrounded some players who… stood out… for the wrong reasons. Reigning Gold Glove winner Cal Raleigh enhanced his MVP case with strong work behind the plate (11.1 FRM, 7 FRV, 2 DRS), though backup Mitch Garver was a liability (-4 FRV, -4 DRS, -1.2 FRM) when the Big Dumper got a breather as the DH. Julio Rodríguez was exceptional in center (10 FRV, 9 DRS) but Dominic Canzone and Victor Robles were both a few runs below average by both metrics in limited duty in right, and Randy Arozarena was rough in left (-8 FRV, -1 DRS). In the infield, deadline acquisitions Josh Naylor and Eugenio Suárez were both better with Seattle than Arizona, albeit in smaller samples; Naylor in particular was a major upgrade on the departed Rowdy Tellez at first. Cole Young and Jorge Polanco combined for -10 FRV at second base, and J.P. Crawford tied for second-to-last among shortstops with -9 FRV.
Phillies
Few things are more certain in life than death, taxes, and the Phillies making the playoffs despite dreadful defense. As I wrote in this space two years ago, “We’ve been talking about the Phillies’ wretched defense since they signed Kyle Schwarber and Nick Castellanos in March 2022, and neither of them is getting better.” At least this time around, the team limited Schwarber to 66 innings in the field, but Castellanos was within one run of last place among right fielders in both FRV and DRS (-12 and -11, respectively); technically, that was better than last year (-14 FRV, -11 DRS). The team’s left fielders — mainly Max Kepler and Brandon Marsh — combined for -5 FRV and -2 DRS. The center fielders were better, thanks in part to deadline acquisition Harrison Bader.
Catcher J.T. Realmuto, a two-time Gold Glove winner, has slipped considerably (-7.0 FRM, 6 FRV, -2 DRS). In the infield, shortstop Trea Turner was good-to-exceptional (2 DRS, 11 FRV) and second baseman Bryson Stott about average, but first baseman Bryce Harper receded (-3 DRS, -1 FRV) after strong work there last year. If third baseman Alec Bohm was a bit rough (-3 DRS, -3 FRV), he was still much, much better than Otto Kemp, who filled in when Bohm was either playing first or on the injured list.
Brooklyn-based Jay Jaffe is a senior writer for FanGraphs, the author of The Cooperstown Casebook (Thomas Dunne Books, 2017) and the creator of the JAWS (Jaffe WAR Score) metric for Hall of Fame analysis. He founded the Futility Infielder website (2001), was a columnist for Baseball Prospectus (2005-2012) and a contributing writer for Sports Illustrated (2012-2018). He has been a recurring guest on MLB Network and a member of the BBWAA since 2011, and a Hall of Fame voter since 2021. Follow him on BlueSky @jayjaffe.bsky.social.
Love the article / series.
Observation: in the context of “team defense” catcher framing feels like it should be considered separately, as part of the “pitching” side of the equation.
My paradigm is “run prevention = pitching + framing + team defense”, where team defense is what happens when the ball is put in play. And “pitching + framing” is what happens when the ball isn’t put in play. I’d put stolen bases / caught stealing in the team defense side of things.
Now, if I’m comparing catchers’ defense, how much value did Posey or Molina add, I’d be crediting framing to their ledger. But “team defense” conversations feel like they should exclude framing and stick to positioning, jumps, range, arm, expected catch values, etc – did they turn the batted balls into outs like they were supposed to.