
A Lukewarm Take on Ice-Cold Bats
Batters swing slower in the cold, but I’m not sure that it matters.
Bat speed goes down when it’s cold, and it goes up when it’s hot. This is something that’s both literally true and curiously linear. We can see in the plot below that bat speed climbs bit by bit as temperature rises from chilly to toasty:
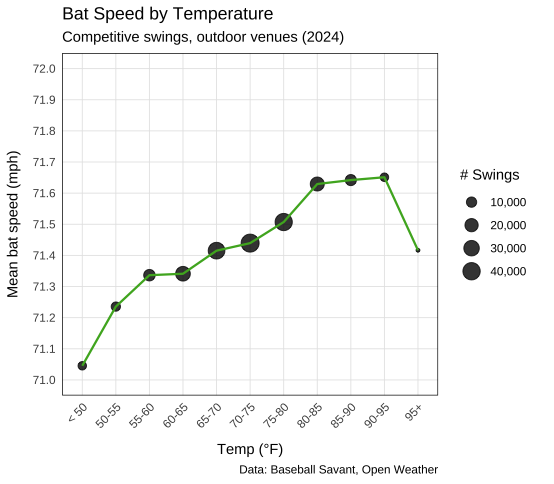
My first thought is this makes sense. It’s reasonable to assume batters don’t swing as fast when their muscles are stiff and their hands are numb. I’ve been cold before, and yeah, it’s difficult to perform tasks requiring fine motor skills.
My second thought is I’m skeptical. Notice the scale of the plot. All that movement amounts to about 0.6 mph from the coldest games to the warmest games. Lots of things other than temperature could be driving this relationship. Bat speed goes down with velocity. Velocity goes up with relievers. Relievers enter games late. Temperature goes down at night. You can see how this could get tricky.
Let’s build a model.
The Data
I tested bat speed for all competitive swings in 2024. Why 2024? That happened to be the year I purchased a bunch of data from Open Weather for my project on light at T-Mobile Park. I simply don’t have other data. Consider this a limitation.
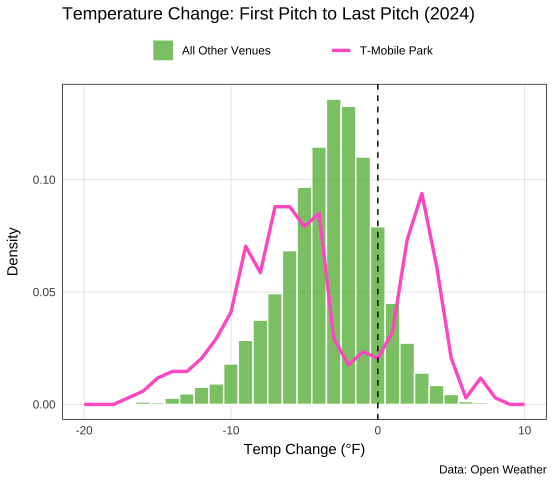
Open Weather data is recorded hourly, which is important. Temperature tends to change throughout a game, from 10-degree drops at night to 10-degree gains during the day. The game-time temperatures provided by MLB don’t capture this. For example, here’s how T-Mobile Park changed between the first and last recorded temperatures of a game:
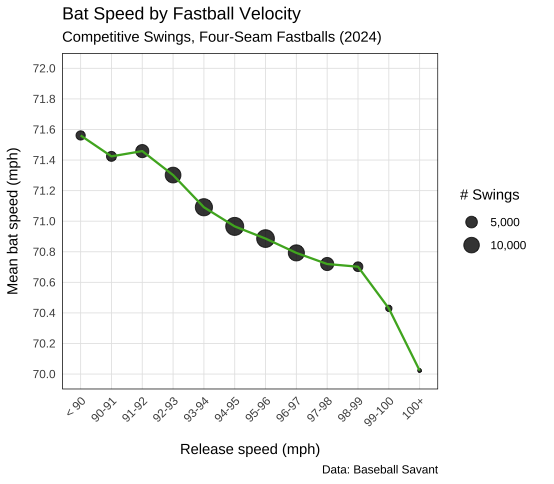
I limited the data to four-seam fastballs thrown in the zone. Again, bat speed is strongly correlated with velocity and location, and for the sake of testing causality, I want a reliable, consistent sample. We can see how four-seem velocity affects bat speed in the plot below. Note that the difference in bat speed between 92 mph and 95 mph is about the same as the difference across the entire range of temperatures.
I also omitted domes and any venue with a roof that’s closed most of the time. That means no Tropicana Field, Daikin Park, Globe Life Field, loanDepot Park, or Chase Field. I did include T-Mobile Park, American Family Field, and Rogers Centre, but only when their roofs were open.
Finally, I included players with at least 100 swings under these parameters. This gives us an even 250 players with 41,623 combined swings.
Cool. Or maybe hot.
The Model
To test all this data, I built a simple linear mixed model.
The most important thing in this model is the random effect for the batter. This creates the assumption that each batter has a personalized range of bat speeds, isolating the effect of the other variables. There’s also a random effect for the venue, though I didn’t find venues mattered beyond their weather.
For the fixed effects, I tried a bunch of different variables and landed on:
• Game-state: Inning, leverage category, and, most importantly, the number of strikes
• Schedule: Month and day or night game
• Pitch: Release speed and location relative to the batter’s handedness
• Weather: Wind speed, humidity, and, of course, temperature
Essentially, what this model does is say, if Batter A was put in the same exact same situation against the exact same pitch, how fast would they swing at 65 degrees Fahrenheit versus 75 degrees.
The Results
I found bat speed increased 0.0197 mph per degree Fahrenheit. Or rather, for every 10 degrees temperature rose, batters swung about 0.2 mph faster. I found this to be statistically significant with a p-value less than .001. I also found this to be a nearly linear relationship.
The r^2 for this model — how much of bat speed can be explained by these variables — was about 42.0%. That’s quite strong given the complexity of bat speed on any given swing. This isn’t too important for what we’re after here, but it’s a sign we’re on the right track.
Now, the marginal r^2 — how much of bat speed can be explained by the fixed effects alone — was just 7.8%. In other words, temperature, release speed, game-state, leverage, etc. had very little influence over bat speed. The batter was mostly in control.
One useful illustration is to estimate bat speed for each swing without the effect of temperature, and then plot the actual bat speed against temperature.
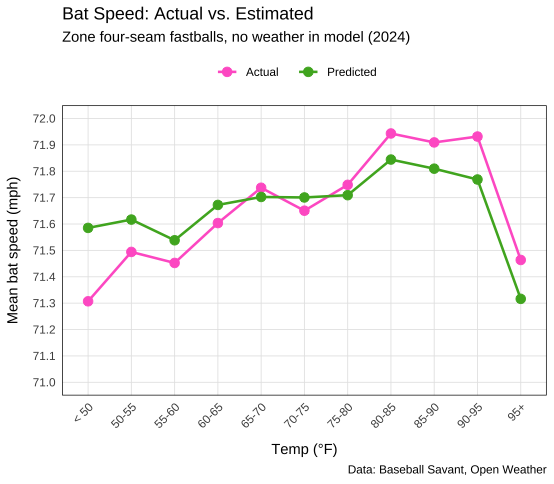
A few things stick out. First, estimated bat speed ticked up with temperature, even without considering it in the model. So my initial assumption — that temperature hides other variables that influence bat speed — appears to hold up. Batters swing slower in the cold, but not always because it’s cold.
We can also see that, yeah, temperature matters. In the cold, bat speed was slower than expected. In the heat, bat speed was faster than expected. In the middle, it was as expected. Again, I think this makes sense.
Perhaps the most interesting finding is a non-finding: The month did not have a statistically significant relationship with bat speed. I wondered if there might be some early-season bias, where bat speed drops because batters are still getting synced up. That’s not what I found.
What I did find, however, was that the month did influence whether a swing was competitive. Or, at least, April influenced whether a swing was competitive. We don’t even need a bunch of fancy math to discover this. Baseball Savant publishes this data in its search function — an early-season quirk hidden in plain sight.
| Month | Competitive Swing % |
|---|---|
| April* | 88.8% |
| May | 91.2% |
| June | 91.4% |
| July | 92.1% |
| Aug | 92.1% |
| Sept | 92.2% |
A swing in April 2024 was about 3% less likely to be competitive than a swing in any other month. I haven’t explored the why or the how — perhaps a future project — but it’s still kind of neat. This is also why it’s crucial to filter competitive swings when exploring the effects of temperature. Some swings are slower in April because they’re not real, full swings.
The Conclusion
Again, bat speed changed about 0.2 mph per 10 degrees of temperature. That’s… not a lot.
And that’s even less when you consider the range of temperatures over a season. About 80% of pitches in 2024 were thrown between 58 and 82 degrees Fahrenheit (with the that assumption enclosed venues were set at 70 degrees). A player with an average swing of 71.5 mph would be expected to swing about 71.3 mph in a typical cold game and 71.7 mph in a typical hot game. I’m not going to say that doesn’t matter — I honestly don’t know the impact of tenths of mph of bat speed — but it seems unlikely this relationship has a major, global impact on the league over a season.
That said, temperature isn’t evenly distributed within or between stadiums. The average swing at Busch Stadium in July is probably going to be a bit faster than the average swing at T-Mobile Park in April. Teams in cold venues are going to run into a few more outlier games each year that could plausibly suppress bat speed.
Still, this tends to even out. The average temperature for a Cardinals at-bat in 2024 (both home and away) was 73.9 degrees. The average temperature for a Mariners at-bat was 69.3 degrees. That implies a bat speed boost (or penalty) of just 0.1 mph for the teams in the hottest and coldest parks in the league. It’s also worth noting the Mariners, Red Sox, and Giants each finished 2024 in the top 10 by bat speed despite playing in the three coldest parks.
| Venue | April | May | June | July | Aug | Sept | Mean |
|---|---|---|---|---|---|---|---|
| T-Mobile Park | 53.8 | 60.8 | 65.7 | 74.1 | 73.5 | 64.2 | 65.3 |
| Oracle Park | 61.1 | 64.2 | 66.9 | 65.0 | 68.4 | 67.0 | 65.4 |
| Fenway Park | 51.9 | 59.6 | 67.5 | 74.4 | 73.5 | 66.0 | 65.5 |
| Oakland Coliseum | 59.0 | 64.9 | 67.6 | 71.7 | 70.6 | 69.8 | 67.3 |
| Progressive Field | 53.3 | 64.1 | 72.1 | 73.6 | 75.0 | 69.1 | 67.9 |
| Petco Park | 62.8 | 62.5 | 67.3 | 70.8 | 73.0 | 72.8 | 68.2 |
| PNC Park | 55.5 | 66.3 | 72.7 | 76.0 | 75.8 | 68.2 | 69.1 |
| Target Field | 51.0 | 66.8 | 76.0 | 78.5 | 75.7 | 67.4 | 69.2 |
| Guaranteed Rate Field | 54.3 | 65.7 | 73.7 | 77.0 | 76.2 | 71.1 | 69.7 |
| Citi Field | 55.9 | 63.6 | 72.0 | 78.9 | 78.2 | 70.1 | 69.8 |
| Rogers Centre | 69.6 | 67.7 | 68.8 | 74.0 | 71.9 | 66.5 | 69.8 |
| Yankee Stadium | 55.3 | 66.6 | 72.8 | 78.0 | 75.5 | 71.4 | 69.9 |
| Chase Field | 70.0 | 70.0 | 70.0 | 70.0 | 70.0 | 70.0 | 70.0 |
| Globe Life Field | 70.0 | 70.0 | 70.0 | 70.0 | 70.0 | 70.0 | 70.0 |
| Minute Maid Park | 70.0 | 70.0 | 70.0 | 70.0 | 70.0 | 70.0 | 70.0 |
| Tropicana Field | 70.0 | 70.0 | 70.0 | 70.0 | 70.0 | 70.0 | 70.0 |
| loanDepot Park | 70.0 | 70.0 | 70.0 | 70.0 | 70.0 | 70.0 | 70.0 |
| Comerica Park | 58.5 | 67.0 | 74.6 | 77.3 | 74.2 | 69.5 | 70.2 |
| Wrigley Field | 52.2 | 65.2 | 75.8 | 76.4 | 77.7 | 73.6 | 70.2 |
| Dodger Stadium | 62.1 | 65.8 | 71.4 | 76.8 | 76.2 | 75.7 | 71.3 |
| American Family Field | 69.9 | 69.7 | 72.0 | 73.7 | 73.1 | 70.2 | 71.4 |
| Citizens Bank Park | 57.8 | 67.6 | 75.2 | 80.0 | 78.7 | 69.1 | 71.4 |
| Coors Field | 59.4 | 63.2 | 76.2 | 80.7 | 79.7 | 73.9 | 72.2 |
| Great American Ball Park | 57.1 | 70.3 | 75.8 | 79.4 | 77.3 | 74.5 | 72.4 |
| Angel Stadium | 66.6 | 65.8 | 72.0 | 77.2 | 78.3 | 76.3 | 72.7 |
| Oriole Park at Camden Yards | 63.0 | 67.0 | 76.3 | 81.4 | 78.3 | 70.4 | 72.7 |
| Nationals Park | 60.4 | 67.7 | 77.2 | 81.2 | 78.3 | 74.4 | 73.2 |
| Truist Park | 61.5 | 69.8 | 79.1 | 81.0 | 79.4 | 72.5 | 73.9 |
| Kauffman Stadium | 58.5 | 68.5 | 80.2 | 82.0 | 80.0 | 76.2 | 74.2 |
| Busch Stadium | 62.1 | 71.6 | 80.6 | 81.9 | 79.3 | 75.6 | 75.2 |
| League Average | 60.8 | 66.7 | 72.7 | 75.7 | 74.9 | 70.8 | 70.3 |
That’s all to say, yes, temperature likely influences bat speed — just not very much.
The upsell here is this is another example of the environment seeping into every nook and cranny of the game. Stadiums are amorphous, and run environments are asymmetric. The field of play is changing day to day and inning to inning in ways that can subtly shift the nature of “true talent.” The wet blanket here is this appears to be one of the lesser environmental effects. I’m more interested in how air density affects ball flight, or how wind affects pitch movement, or how lighting affects batter vision, or how the schedule affects the sum of the league’s run environment.
So if your favorite player’s bat speed is down 3 mph in the first two weeks of 2026, it’s probably not the weather. If it’s down a tick, the weather very well could be the reason. Or maybe not. After all, the season is still warming up.
Editor’s Note (4/9/2026): A previous version of this piece included information about competitive swings in April 2024 that was based on incomplete Statcast data. From that data, we incorrectly concluded that the competitive swing rate was down in the first month of the season compared to the rest of the year. We have removed that note from the story.
Ryan Blake is a contributor for FanGraphs and Lookout Landing.
If batters swing harder at faster pitches…is that why it appears that faster pitches are hit harder? Not because they’re reflecting off the bats but because batters are swinging harder to make contact with them?
The article stated that bat speed decreases with velocity. I don’t know why that is true though.
There’s a strong inverse correlation between bat speed and squaring up the ball. I’m guessing that batters don’t swing as hard at faster pitches to increase their bat control and ability to make solid contact.
And Ben Clemens has looked into this: https://blogs.fangraphs.com/faster-fastballs-produce-worse-swings/
por que no los dos. jpeg
This is great, thanks Ryan. I wonder if teams have ever tried to get a small edge doing something to keep players warm in cold weather. Does MLB allow dugout heaters?
Anecdotally Chase Field is usually quite a bit warmer than 70 during enclosed mid-summer games.
I’ve also always wondered if offense starts to really fall off when the temperatures are very cold, say around 40 or below, which does happen in March/April and October occasionally in the cold-weather cities.
All of the indoor parks are hotter than 70 degrees. Globe Life had to have been close to mid 70s.
Yeah I would have guessed upper 70s or even 80 for Chase. Which feels very pleasant in midsummer in Phoenix.
You can literally fry an egg on the hood of a car in midsummer Phoenix. Not that you would want to except to say that you did.
Typically it’s more dangerous living in cold climates than hot ones, but at a certain point heat becomes more dangerous. In a place like Phoenix in the summer there’s nothing you can do about the heat except refuse to leave an air conditioned building.
In cold climates you can keep putting on more layers until you can walk to the store without any risk to yourself. But in Phoenix in the summer there aren’t enough clothes to take off to do the reverse.
The Bluejays play in 68 degrees when the roof is closed. The Brewers warm up to around 64 degrees in the early season.
Does the increased density of air at lower temperatures explain any of this decrease in bat speed?
You know I’m not sure. Just tried density in the model, and it shows pretty much the same thing. I’m not quite savvy enough to separate one from the other. My hunch is temperature reduces bat speed because it reduces fine motor skills, rather than denser air slowing the bat. But honestly density might fit the linear relationship here better. Something to look into.
what does the relationship between air density and temperature look like? are they basically 1:1, or is there some spread mediated by stuff like elevation? (if there’s some variation, i’m wondering if you could make the two orthogonal by regressing density ~ temperature, and then defining your density as density above your temperature-based expectation to see if there’s a separate effect for density.)
in any case, i liked this post a lot!
I didn’t expect STL and KC to be the hottest although I did expect at least top 5. I was assuming Atlanta would have been the hottest.
St Louis has one of the worst combinations of weather with the cold winters and hot (and relatively humid) summers.
As a northern midwesterner, I am compelled to laugh at St Louis’s idea of cold winters.
And then point out that the average difference between April and July is greatest in Minnesota!
St Louis is a like Boston in the winter and Tampa in the summer. It’s simply unpleasant all year round. It’s the opposite of San Diego that way.
It’s never as bad as summers in Houston or winters in the Twin Cities, but at least there is one season that is tolerable in those places.
It is true though that the winters are dreadfully cold in Minnesota. The Twin Cities almost certainly have the coldest winters of any current MLB team, although that is because Montreal no longer has a team.
The coldest place in North America that has a large population is definitely Winnipeg. It’s awful.
Yeah but like most things in life you get really used to it quickly and I doubt your baseline happiness is any different. I have lived in Missouri my whole life and I guess I feel bad for people who move here from cities with better weather but most of us don’t know any better. Summer is hot winter is cold and spring and autumn are nice, simple as
I found out about 7 years ago that your fat cells change to become more or less dense in response to the local climate.
I found that crazy.
This works a little better when the place is consistently cooler or warmer though. And I am not sure your body adjusts to humidity as efficiently.
For a place like St Louis it’s a bit more psychological, as you say. If you grew up on the plains or St Louis or some other place like that you’re probably used to it. Ignorance is bliss!
I have spent a fair amount of time in St Louis at all times of the year (sick family member that I visited regularly) and I thought “wow, this place has a weird climate!” But I never stayed for more than a week.
I have typically lived in places that are either cold and low humidity or warm and high humidity. However I did live briefly in Iowa and the climate there was very much like St Louis.
I don’t want to say much bad about Iowa, as it used to be a really nice place to live. It was unusually tolerant about 20 to 30 years ago. Not a place with any real tourist attractions but filled with good neighbors. (My friends who still live there now report this is much less true than it was)
But the weather was awful. The heat and the cold were both intense. Turns out living by a massive lake or the ocean is a good thing! The cities that got built up along the Mississippi River are just so different than those that got built on the Great Lakes.
Never underestimate the moderating effect of the ocean on temperature. And how FAR KC and STL are from significant bodies of water.
Having lived in New England all my life I can attest to the effect that water has on the temperature. Even in June there have been nights, when the east wind is off the water, that I have been at Fenway bundled up in a heavy jacket and a winter hat.
Some of my favorite games I’ve gone to at Fenway were in less than ideal weather conditions. But that usually ment that attendance was sparse. No lines for anything but the real plus is being able to go to different parts of the stadium. Or finding a place away from people if your friends were getting rowdy.
San Francisco is so cold in the summer, my word.
I think under 50 is a big net. Been quite a few games in the 31-38 degree temperature this year. Playing at freezing level vs 48 is a big difference
Playing as a kid with wooden bats there was a big difference with the bat in cold vrs warm. Connecting with a bat in the cold hurt so I wouldn’t be surprised if some players unconsciously wince. I sucked but I became really selective with n the cold.
I wonder how much of the dropoff in september is also related to overall fatigue after playing 130 games.
Wonder if wearing extra layers of clothing are contributing to slowing down swings in cold weather. Also, what about October when it gets cold again? Smaller sample with cold weather teams making post-season, but maybe still relevant?
*looks nervously at Pete Alonso’s Baseball Savant page*
So if I’m an owner and I want to juice my offense its best to have an indoor stadium and set the thermostat at ,80. It’s going to be hot for fans but that will just mean they buy more beer
This does nothing to dissuade the notion that a player experiencing a dip in bat speed could have the weather to thank due to injury concern over max effort swings. A simple Google search will tell you muscles don’t work as well in the cold as they do in the heat
What do you mean by “a competitive swing”?