Justin Verlander’s 2025 season isn’t going to be one for the history books. After his second stint with the Astros ended with a whimper (17 starts and a 5.48 ERA in 2024), he signed a one-year deal with the Giants that felt like a potential career capstone. At 42 and with a résumé that’s already a stone cold lock for Cooperstown, this year was never going to be about accumulating more statistics. When he started the year 0-8 with a 4.99 ERA, it felt like the final act of his career. No one fights off time forever, not even the seemingly ageless Verlander.
Anyway, here’s a leaderboard of the pitchers with the most WAR in the last 30 days:
Now, did I leave ERA out of this table on purpose? I sure did – ERA is noisy in small samples anyway, but mostly Verlander’s is just less impressive than the rest of this group. He’s at 4.18 in that span and 4.55 for the season, despite solid strikeout, walk, and home run numbers. He’s certainly not one of the best 10 starters in baseball, regardless of what that leaderboard says. But he’s been a solid big league starter, undoubtedly, and that in itself is pretty remarkable given how things looked a few months ago. Read the rest of this entry »
A warning up top: This article is about seeking and not finding, about the unique ways that data can mislead you. The hero doesn’t win in the end – unless the hero is stochastic randomness and I’m the villain, but I don’t like that telling of the tale. It all started with an innocuous question: Can we tell which types of hitters are streaky?
I approached this question in an article about Michael Harris II’s rampage through July and August. I took a cursory look at it and set it aside for future investigation after not finding any obvious effects right away. To delve more deeply, I had to come up with a definition of streakiness to test, and so I set about doing so.
My chosen method was to look at 20-game stretches to determine hot and cold streaks, then look at performance in the following 20 games to see which types of players were more prone to “stay hot” or “stay cold.” I started throwing out definitions and samples: 2021-2024, minimum 400 plate appearances on the season as a whole, overlapping sampling (so check games 1-20 vs. 21-40, 2-21 vs. 22-41, and so on), wOBA as my relevant offensive statistic, 50 points of wOBA deviation against seasonal average to convey hot or cold, 40-PA minimum per 20-game set to avoid weird pinch-hitting anomalies, throw out games with no plate appearances to skip defensive replacements — the list goes on and on. Read the rest of this entry »
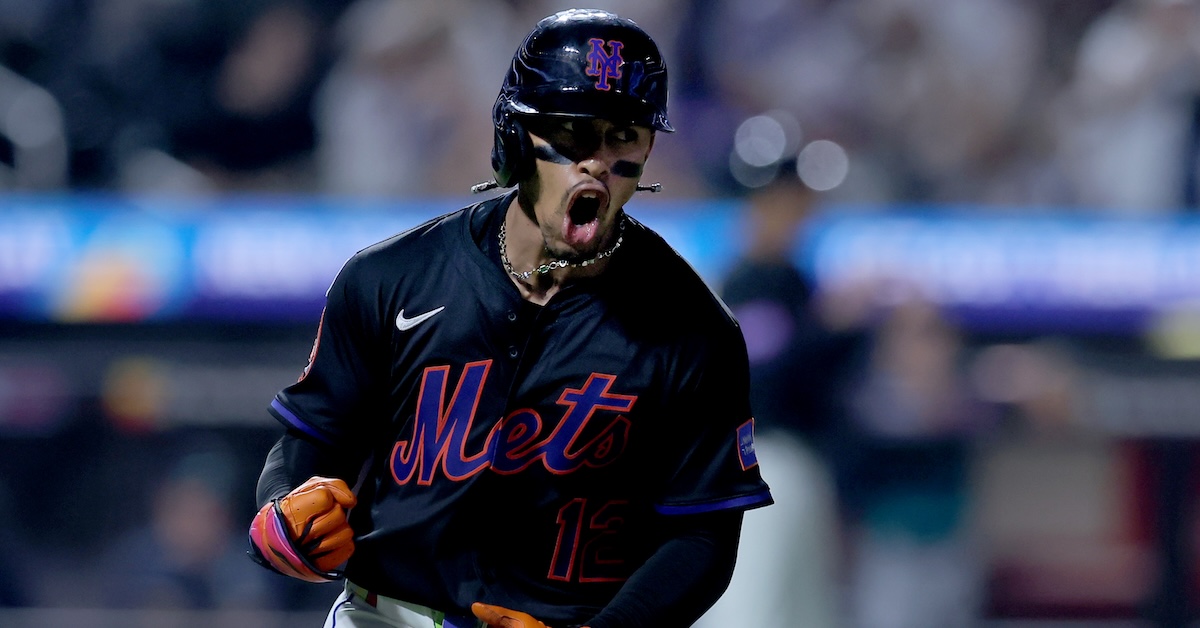
The Mets are the best Rorschach test in baseball right now. You can see almost anything you want to when you look at them. A band of high-paid underachievers? Sure. A great team in a rough stretch? Yup. A triumph of pitching development? Sure thing, but also a cautionary tale about what happens when you don’t have enough starters to get through the season. Each of those topics – and plenty more – are worth a closer look. But in watching the Mets in recent weeks, I’ve been struck by the same observation every time I watch a game. That observation? Man, Francisco Lindor is good.
Lindor has been right at the center of the Mets’ mid-summer meltdown. After starting the season as hot as he ever has, he posted two straight abysmal months in June and July while the team swooned in sympathy. I’m not sure you understand quite how bad it was, so let’s look at the numbers. He hit a desultory .205/.258/.371 over those two months, good for a 77 wRC+. So imagine my surprise when I looked at this year’s hitting leaderboard and saw Lindor’s 4.7 WAR in 11th place.
Now, am I writing an article to tell you that Francisco Lindor is good? I mean, kind of. More than that, though, I’m thinking of this as an appreciation post. Lindor’s year-to-year consistency is otherworldly. He’s putting the finishing touches on his fourth straight five-win campaign, all with wRC+ marks between 121 and 137. He’s doing it without it ever feeling like it’s unsustainable. So let’s appreciate that greatness and take a look at what this year’s roller coaster says about Lindor’s time in Queens more broadly. Read the rest of this entry »
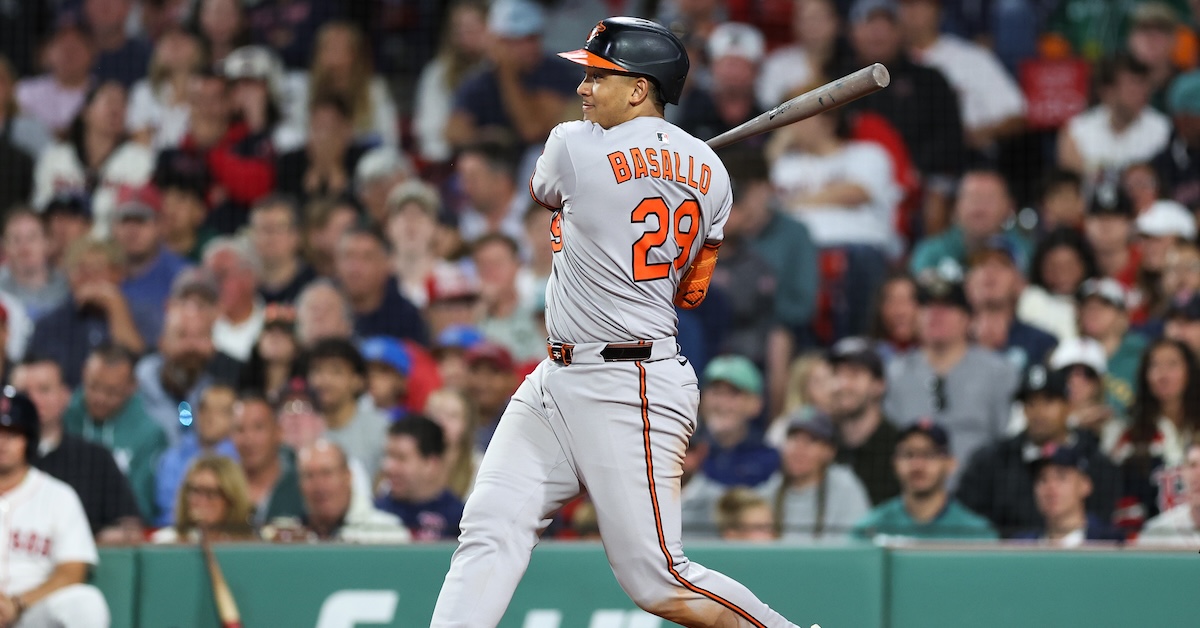
The Baltimore Orioles came into this year with a few goals. Foremost among them: reach the playoffs, find reliable pitching, and sign some of their young core to contract extensions. Goal one is out of the question. Goal two is up in the air. But goal three? Goal three is going strong after the Orioles and Samuel Basallo agreed to an eight-year, $67 million contract extension, with a team option and escalators that could push the total value to $88.5 million. Andy Kostka of The Baltimore Banner first reported the deal.
Basallo, currently the third overall prospect in baseball, debuted in the majors last week after a whirlwind tour of the minor leagues. He overpowered A-ball at 18 in 2023, mastered Double-A in 2024, and was hitting .270/.377/.589, good for a 150 wRC+, in Triple-A before the O’s called him up. He’s been far younger than his opposition at every level, and it just hasn’t mattered; his colossal raw power has papered over any weaknesses or growing pains again and again.
Throughout his ascension through the prospect ranks, the biggest question about Basallo has been whether he’ll stick behind home plate or have to move to a less demanding defensive position, likely first base. While Basallo’s offensive performance has been consistently excellent, his defense hasn’t been quite so exciting. A stress fracture in his elbow has slowed him, costing him valuable reps at catcher. He played DH about as frequently as he caught in Triple-A this year, and the same was true in 2024. Read the rest of this entry »
Welcome to another edition of Five Things I Liked (Or Didn’t Like) This Week. August is a month I like to use for rest and recovery. After the chaos of July, there’s a natural lull in the season before the drama of September. Both deadline buyers and sellers are figuring out their new rosters and allocating playing time to new arrivals and minor league call-ups. No race is down to the wire, and yet many races are already decided. That’s a great time to relax – and what I like to do to relax is watch baseball. This week’s set of five things doesn’t have a lot of pivotal plays or playoff squads on the brink. It doesn’t have walk-offs or game-ending defensive plays. It’s just guys doing cool things, and sometimes that’s the best part of baseball. So with a quick programming note – Five Things is off next week while I go to the US Open – and a nod to Zach Lowe of The Ringer, let’s get started.
1. Ultimate Reversals
In an 0-2 count in his first start off the IL, Hunter Greene lost control of a fastball:
Hey, it happens. It was an 0-2 count, so no big deal, get ‘em next pitch. Only, wait, something was going on:
Hit… by pitch? I’m not sure anyone at the plate was sure what happened. J.T. Realmuto said something to umpire Carlos Torres. Torres thought about it and then eventually awarded Realmuto first base. Tyler Stephenson went full John Travolta behind home plate, looking around in vain for someone to make this make sense to him.
How did Reds manager Terry Francona feel about this? The same way I did, and the same way you do right now, presumably:
When the first slow-motion replay came in, everything started to make a little more sense:
Realmuto wasn’t hit by the pitch; his bat was. It’s an easy overturn. Why didn’t anyone notice? Well, Stephenson had his eyes closed and his glove blocked Torres’ view of the butt of Realmuto’s bat. No one noticed the deflection right away either; after all, Stephenson stuck up his glove trying to catch it and the ball landed in the mitt.
The replay review was short and conclusive. The call on the field was overturned; instead of a hit-by-pitch, it was a foul ball. Only, that’s not quite right – there were two strikes. The ball landed in Stephenson’s mitt after making contact with the bat. That’s a textbook foul tip strikeout. Instead of strolling to first base, Realmuto trudged back to the dugout.
There have only been five other HBP-to-strikeout overturns in the replay review era. I watched video of all of them. The one this week was the strangest. Here’s AJ Pollock getting “hit” by Tyler Chatwood in the first one I found:
See the umpire’s quick and decisive reaction? That’s normal. Call a dead ball, determine what happened, point to first to signal a hit-by-pitch – it’s standard operating procedure. Torres didn’t even call a dead ball, because he didn’t realize he needed to.
In fact, I think Realmuto might have inadvertently done this to himself. It’s feasible that if he didn’t say anything to Torres, that would have just been a ball. No one saw the ball deflect off the bat in real time, and it was such a glancing blow that no one seemed to hear it. You can tell because of their reactions; Torres doesn’t call the ball dead right away and Stephenson definitely has no idea what’s going on. Also? Change this rule! That has to be one of the hardest-luck strikeouts of all time.
2. Coordination Jung Hoo Lee’s second year in San Francisco has gone much better than his first. He’s healthy, for one thing: After an injury limited him to just 158 plate appearances in 2024, he’s been active for the entire season and has already crested 500 plate appearances this year. He’s improved across the board offensively, flashing gap-to-gap power and consistently working counts and avoiding strikeouts. It’s been more of a struggle defensively, where he’s been somewhere between blah (per OAA) and quite poor (per DRS and Baseball Prospectus’ DRP). It’s tough having your fielding compared to the ridiculous monsters who roam center these days. But how many of them can do this?
What’s that, you say? That was a standard play, catch probability 99%? The wind looked a little swirly, which made it slightly more difficult, but you’re not wrong. Lee took a meandering route to the ball and still had time to flatten his route and more or less come to a complete stop to judge the wind; he probably could have caught it standing up if he’d gotten a better read initially. That’s all true! But wait for the reveal:
It’s like a magic trick, pulling a coin out from behind a kindergartener’s ear only in baseball form. Oh, you’d expect the ball to be in my glove? No, of course it’s somewhere else. See, the ball actually kicked out of Lee’s glove, but he made a spectacular instinctual adjustment:
Lee’s right leg made that entire play. He lunged and missed with his hand, the normal thing you’d use to catch a baseball. For most players, that would be the end of the play. But Lee somehow flipped his hips to get in position, drove his right knee past the ball without bumping it away, and then pincered it into the hollow between his knees to protect it from falling to the ground.
Don’t try this at home. I say that out of personal experience – my dog looked at me funny for about five minutes while I tried to replicate it on my living room floor. There’s no practicing or teaching this. No one works on it in spring training. For nearly every outfielder in baseball, the play would have been over after it kicked out of their glove. Lee might be a below-average outfielder when you take the sum of his defensive contributions into consideration. His coordination and ability to make last-minute adjustments, though? It’s certifiably excellent.
3. Necessity Ryan O’Hearn doesn’t face lefties. In his entire Orioles career – 1,223 plate appearances – he faced only 137 lefties. It’s no secret why: He posted an 89 wRC+ against them, as compared to a 126 wRC+ against righties. That’s a huge platoon split, more than double the major league average for lefties. The O’s had a surfeit of righty platoon options, and even this year, when O’Hearn put up his best season yet, they generally didn’t let him face lefties, and he hit poorly against them when he did get the chance.
In theory, the Padres are similarly capable of sheltering O’Hearn. They’ve only given him six plate appearances against lefties, and they’ve pretty much all been out of necessity rather than desire. Your bench isn’t always as full as you’d like, the other team can sneak in lefty relievers at almost any time late in the game, and no hitter avoids facing lefties altogether. In fact, the Padres have given him those opportunities at about the same rate as the O’s. But let’s just say he’s not hitting southpaws quite so poorly with San Diego:
That’s 4-5 with a walk, and all four hits have gone for extra bases. It’s far too small of a sample to make substantive conclusions, of course, but O’Hearn has already socked as many homers against lefties in a Padres uniform as he did in Baltimore, where he played for 20 times as long.
The last one, a two-run blast against All-Star Robbie Ray, came after Mike Shildt pinch-hit with O’Hearn against a lefty. It wasn’t exactly a normal decision – Jake Cronenworth was hit in the hand in his previous plate appearance, and while he played the field afterwards, he didn’t appear to be capable of swinging a bat. Since the Padres had already juiced their lineup with righties against Ray, the only bench hitter with a platoon advantage was Elias Díaz, and your light-hitting backup catcher isn’t a real pinch-hitting option. O’Hearn was the logical play even if “pinch-hit with the guy we never let face lefties against a dominant lefty” isn’t normally a good decision.
So, is O’Hearn suddenly a lefty killer? I don’t think so, but I definitely hope so. The Padres are going to run into many more chances to either let O’Hearn hit against a lefty or replace him with an inferior hitter (Jose Iglesias? Bryce Johnson?) who stands on the other side of the plate. Previously, the decision has rarely been interesting – get the righty in there. In the last 20 days, though, O’Hearn is making it hard to pull him from the game. Yes, it’s six plate appearances. Sure, that’s not how sample sizes work. But since coming to the Padres, he’s slashing .800/.833/2.400 against lefties. Can you really turn that down in favor of Candelita? It’s gonna be a great subplot to watch down the stretch.
4. Thievery Alejandro Kirk doesn’t steal bases. In his entire minor league career, he swiped five bags, all in 2018 and 2019. He’s never so much as attempted one at the major league level. He’s listed at 5-foot-8 and 245 pounds, kind of the reverse of a prototypical base stealing frame. His 24.2 ft/sec sprint speed is in the second percentile league-wide. Could you, personally, beat Alejandro Kirk in a footrace? Probably not, but it’s at least closer than it would be for pretty much every other major leaguer.
Anyway, here’s Alejandro Kirk stealing a base:
This play was a perfect storm of pro-stealing factors. With only one out and a runner on third in a one-run game, the Rangers infield was all the way in. That meant Jake Burger couldn’t hold Kirk on first base because he was off the line and on the grass. It wasn’t a big deal, though. Is there a runner less important to hold on than the guy with 2,000 plate appearances and zero stolen base attempts? Meanwhile, with Daulton Varsho on third base, Kyle Higashioka had no interest in throwing down to second and letting Varsho maraud home. The Rangers knew there was no throw coming to second. Look at their positioning with the ball already in Higashioka’s glove:
In other words, they were more or less daring Kirk to go. Why wouldn’t they? Kirk batted 1,946 times before attempting his first steal. Second place in the majors for most plate appearances without attempting one? Spencer Horwitz with 723. The post-integration record for career plate appearances without a stolen base attempt is 2,224, by Johnny Estrada from 2001-2008. Very few batters reach 1,000 plate appearances without trying to steal at least once. Kirk was a true standout in his field of standing around.
Now he’s got a swipe in his back pocket. Estrada’s record is safe; the odds of Horwitz getting to that milestone are negligible. He’s not even a catcher! But more importantly, Kirk is on the board. He tried to act casual after stealing the base, but the crowd wouldn’t let it go (the Jays posted that it was his first career stolen base on the scoreboard). You know you’ve done something fun when you get Max Scherzer to react like this:
5. Pratfalls With Happy Endings
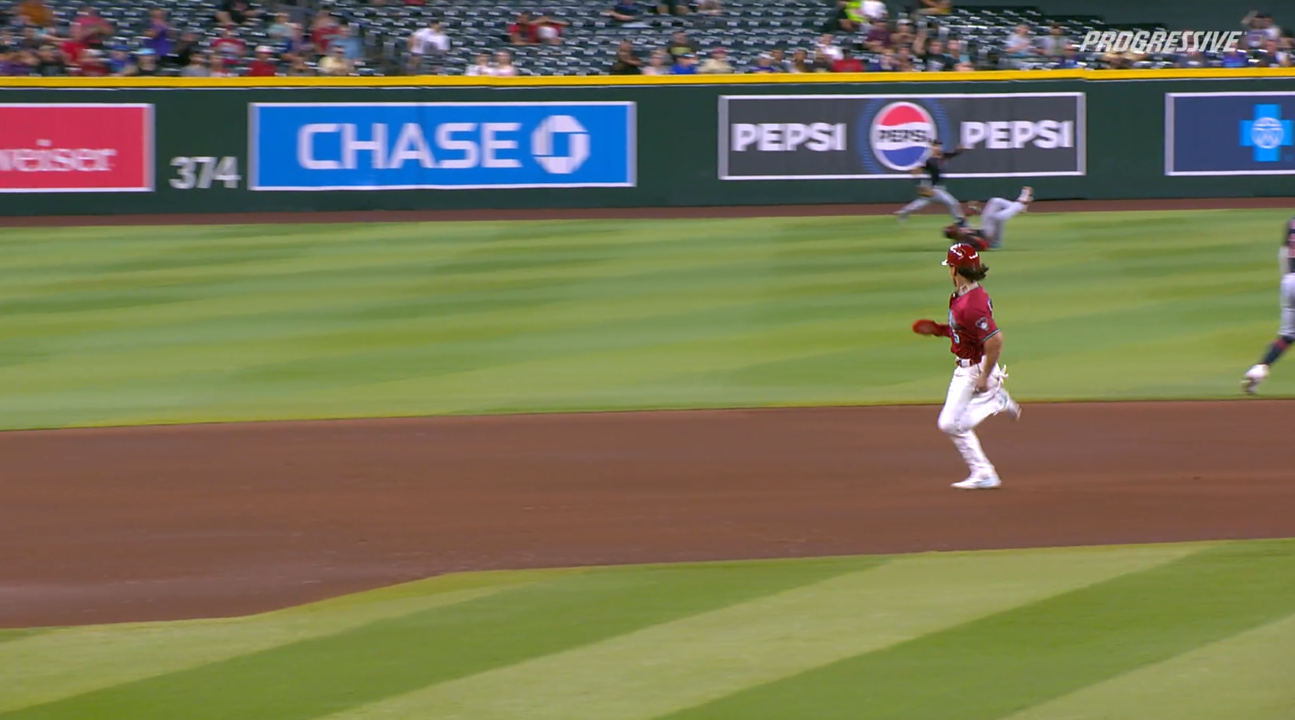
If your only understanding of outfield defense came from this column, you might think that falling over was a key part of the job:
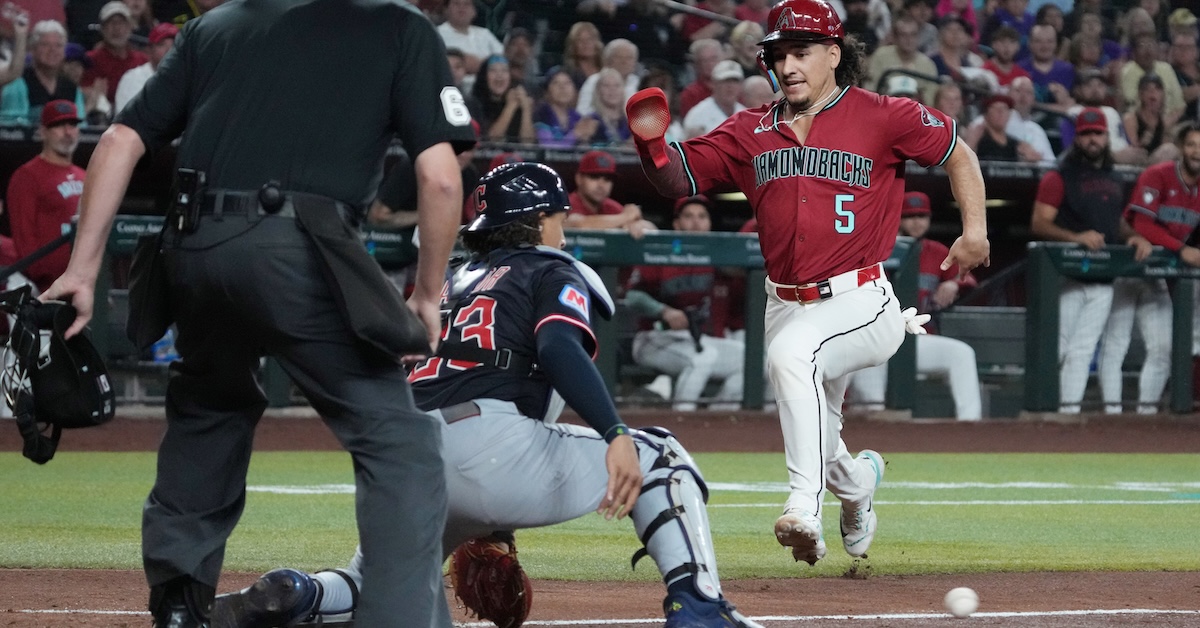
Sorry for the camera angle; it’s all both broadcasts had. But in any case, what a disaster. You can’t fall down there. That’s Alek Freaking Thomas on the basepaths. He’s maniacally aggressive and has the speed to make it work; he’s 10 runs above average on the basepaths in his career even without taking stolen bases (he’s not a great base stealer) into account. He was on his horse right away and had eyes on home plate. Watch Thomas clock what’s going on in center, pick up third base coach Shaun Larkin waving him on, and book it home:
Wait, what? He got thrown out?!? Yeah, and by a lot, as it turns out. See, Angel Martínez fell, but it was fairly graceful as falls go. He didn’t lose the ball, didn’t panic, and was back on his feet quickly to toss in the relay. It took him about a second-and-a-half to recover, which isn’t great, but it’s a lot better than staying down or losing his grip:
That was a decent relay throw, perfectly on line but without a ton of vigor. Martínez has a cannon arm, but he didn’t show it off there; he was just thinking of getting the ball to the infield. When Gabriel Arias received the throw, though, he had maximum effort on his mind. Arias has an incredibly strong throwing arm, too. He knew there was going to be a play at the plate. He received the relay throw while already stepping into a throw home:
Don’t overlook Bo Naylor’s role in that play. The throw beat Thomas by plenty, but it reached Naylor on a short hop. Without perfect concentration, that ball would probably skip away. It hit so close to Naylor that he had to make a first-base-style scoop:
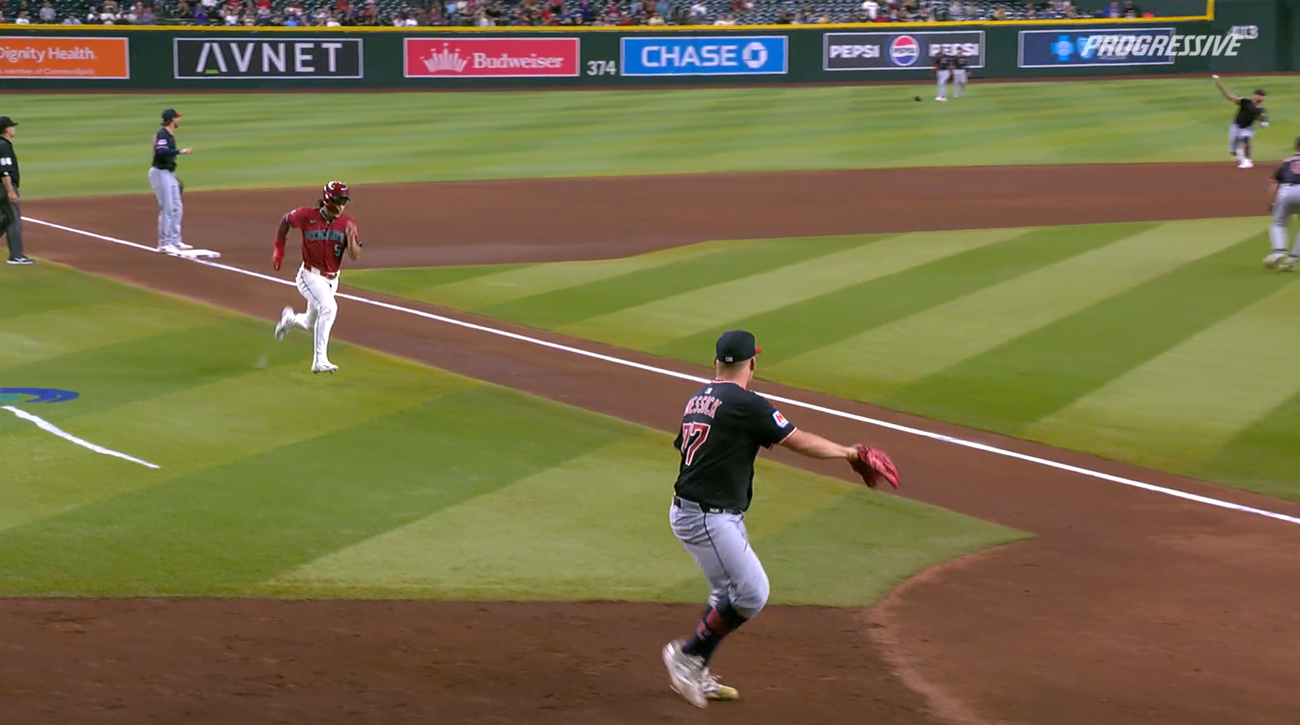
Meanwhile, though, even with an outfielder falling down and then feathering in a relay throw instead of ripping one, Thomas was out by quite a bit. I think I can show you what went wrong. Here’s Thomas with Martínez sprawled out in the outfield:
He’s nowhere near third base. Forget how hard Arias threw the ball on his relay; there aren’t many players who are making it home safely from this position:
The play wasn’t in front of Thomas; he noticed that Martínez fell, but he had to turn his head to run at maximum speed after that. But the timing just wasn’t right for even a fast runner to score. Martínez was throwing the ball in before Thomas reached third base. Arias was releasing it from shortstop before he was halfway home. Major league fielders are great. This just wasn’t a safe time to score, even after Martínez’s stumble.
It’s perhaps not a coincidence that Shaun Larkin isn’t coaching third base for the Diamondbacks anymore. Manager Torey Lovullo removed him after this very game, in fact. It was a straw-that-broke-the-camel’s-back situation, but I think it’s emblematic of how hard it is to wrap your head around just how athletic major leaguers are. Angel Martínez was on his back in the outfield, and then he made a natural-looking, low-effort move and just wasn’t. He didn’t have to make a hero throw. He didn’t have to try to whip it home on the fly to make up for his stumble. He just kept his head about him and let his natural coordination plus his team’s competence make up for the trip. Martínez has been quite bad in the outfield this year. He’s a shortstop by trade and hasn’t adapted to the broad expanses of grass all that cleanly. But making an athletic, tumbling play, and having the rest of the Guardians turn it into an out? He looks pretty good doing that.
Yesterday, I dove into the wonderful world of Nick Pivetta’s middle-middle magic. It’s pretty crazy to think about. Pitches down the middle shouldn’t lead to a huge batch of called strikeouts, and yet opposing hitters can’t help themselves when Pivetta is on the mound. This two-strike dominance is fueling Pivetta’s best season as a professional. Obviously it is – all those free strikeouts can’t be bad.
When I see such an unexpected and excellent tactic, my mind naturally goes to the exact opposite of it. If Pivetta is getting ahead by doing this, surely some hitter must be getting victimized by having it done to them. If there are standouts in acquiring called strikeouts, surely there are players particularly susceptible to them. So let’s look at the list of the hitters with the most called strikeouts on middle-middle pitches, hereafter “meatball punchouts” with a hat tip to editor Matt Martell:
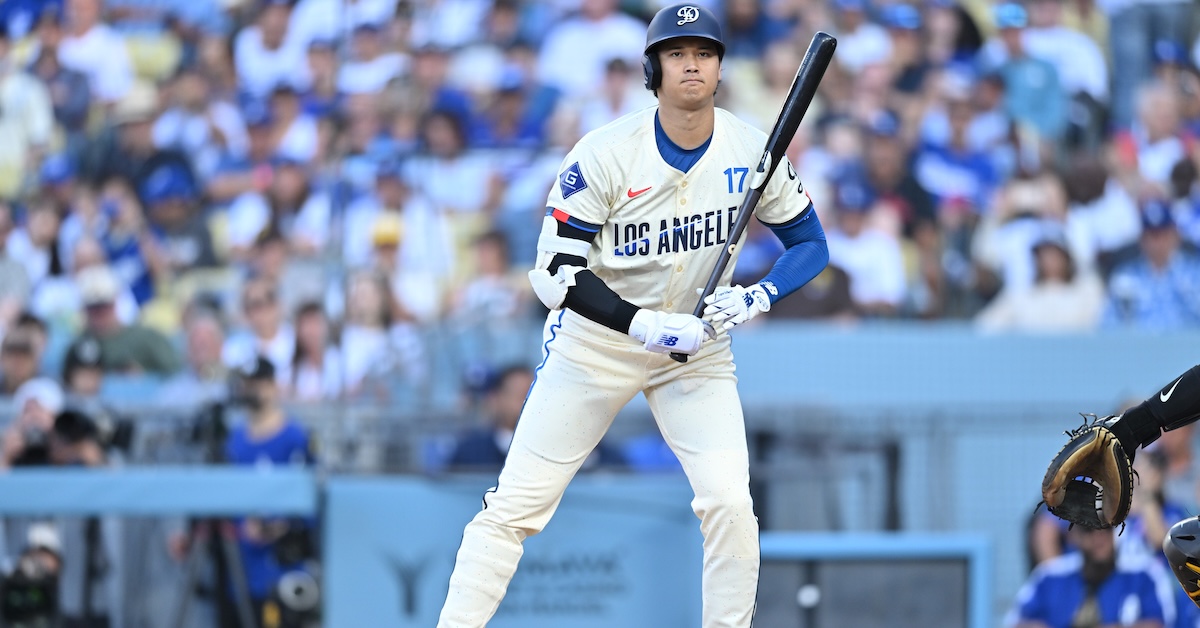
Wait, what? These are mostly good hitters! The anti-Pivetta being Gavin Lux is one thing – Lux is having a solid but not spectacular season. But Shohei Ohtani? Elly De La Cruz? The hitters who are worst at the thing Pivetta is best at are mostly great. Let’s look at it a different way:
You might wonder why all of his signature pitches are tossed down the middle for called strikeouts. That’s because Pivetta is the league leader in a statistic I didn’t know I loved until I looked it up: called strikeouts on pitches right down the pipe. He’s the 2025 leader. He’s the leader over the past five years, in fact. Keep your reality-distorting sweepers and letter-high four-seamers; Pivetta gets the job done more simply.
This feels like an impossible skill to cultivate. You hear all the time about pitchers going into a lab somewhere and adding velocity or spin. New pitches? They’re a dime a dozen these days. A starter who hasn’t added a sweeper and cutter sticks out like a sore thumb now that technology and training make it easier than ever to branch out. Every year, the sliders get slidier, the curveballs get curvier, and the fastballs get faster. Meanwhile, Pivetta throws 94-mph “heaters” down the middle for strike three. How?? Read the rest of this entry »
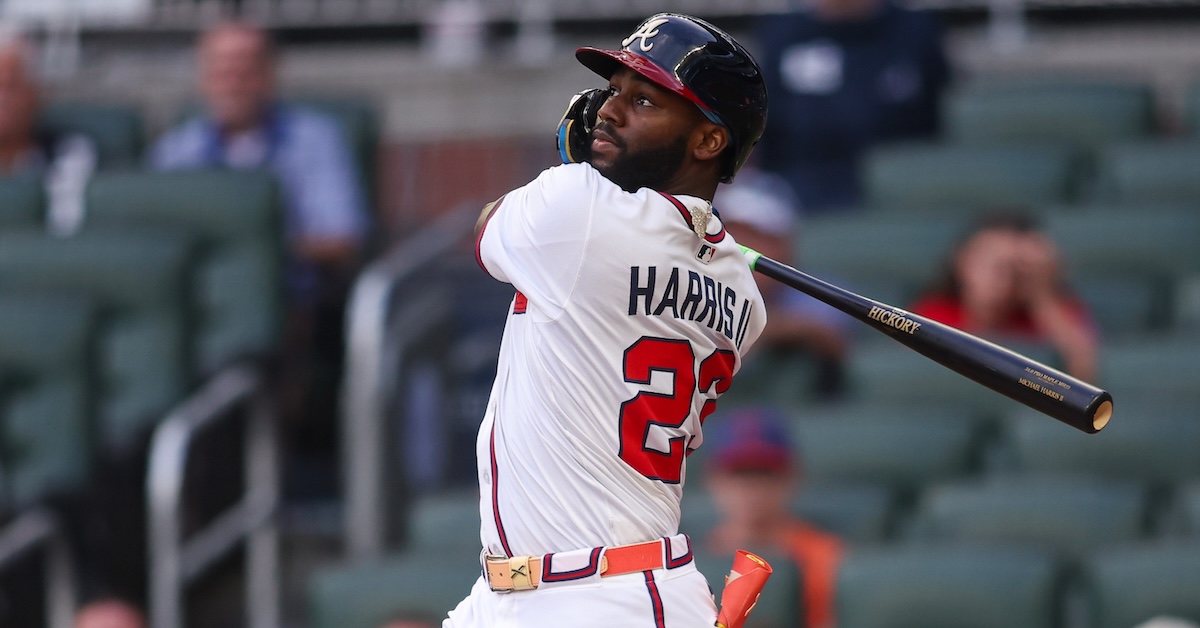
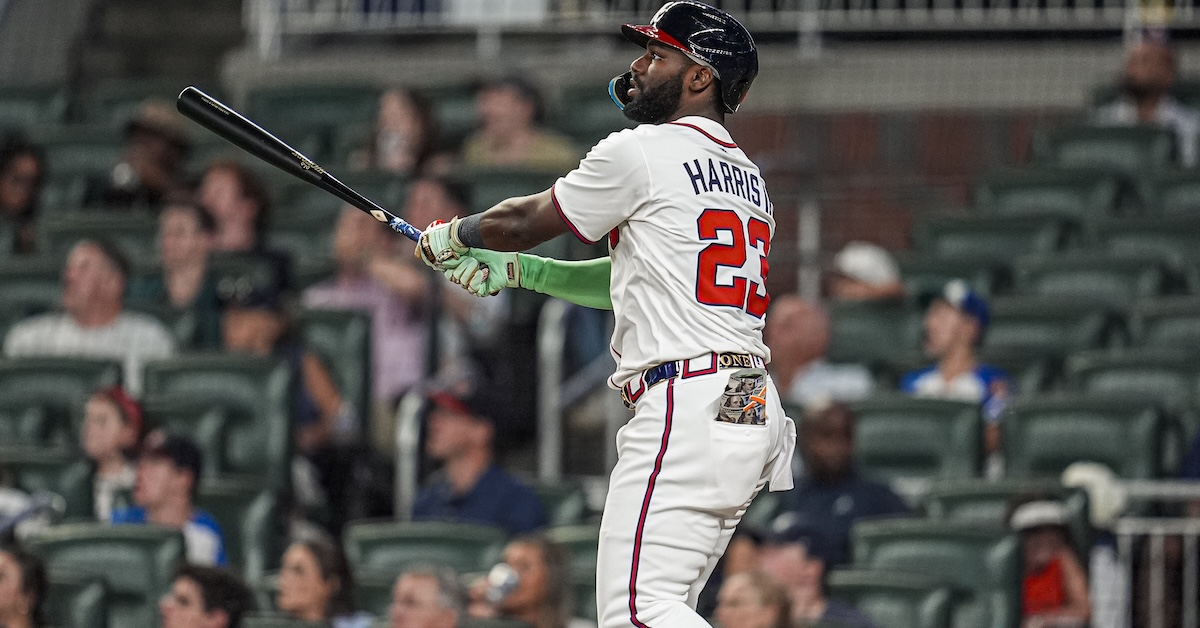
At the All-Star break, Michael Harris II was heading for his worst season as a professional. His solid defensive skills couldn’t make up for his woeful 47 wRC+, a .210/.234/.317 batting line that had neither on-base skills nor power. Between a league-low walk rate and only six homers, Harris had “accumulated” -0.8 WAR, a shockingly low number for the Braves standout. Only two Rockies, Brenton Doyle and Michael Toglia, had worse numbers.
Since the All-Star break, Michael Harris II has been one of the best hitters in baseball. In a mere 30 games, he’s racked up 2.2 WAR thanks almost entirely to his offensive prowess. He’s hitting a bruising .398/.413/.732, good for a 217 wRC+. That power outage? Forgotten. Harris has more home runs since the break (nine) than before it. Only two players in baseball – Nick Kurtz and Shea Langeliers – have a better wRC+ over that time span, or more WAR.
It can be hard to hold two opposing ideas in your head, particularly when those two ideas are “Michael Harris can’t hit” and “Michael Harris is one of the best hitters in baseball.” One purposefully silly way of saying it: Harris has accumulated 158% of his 2025 WAR in the second half of the season. Another wild thing about this ridiculous tear: Between when I filed this piece on Monday afternoon and when it was published on Tuesday, Harris went 4-for-4 with a home run and gained 16 points of wRC+ and 0.3 WAR. For the rest of this article, the numbers I use are updated through the end of play on Sunday.
It’s unquestionably true that almost anything can happen for 100 plate appearances, but this is stretching the limits of “almost anything.” You don’t run a 200 wRC+ for a month on accident. You don’t run a 47 wRC+ for half a season on accident either. I had to investigate. Read the rest of this entry »