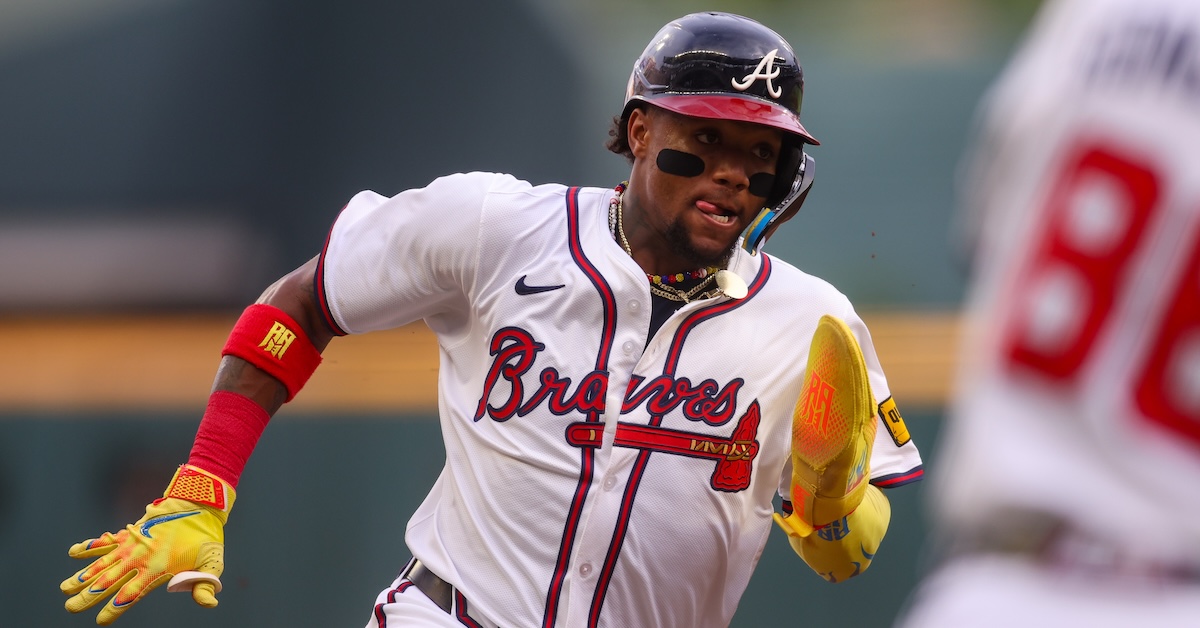
How much WAR does FanGraphs project Ronald Acuña Jr. for in 2026? It’s a really straightforward question. It should be especially straightforward now that all of our projections are out. But as it turns out, it’s less clear cut than it sounds at first, and clarifying it has two benefits. First, it’ll help you better understand our projections. Second, it’s fun to play with math. So buckle up: We’re doing arithmetic.
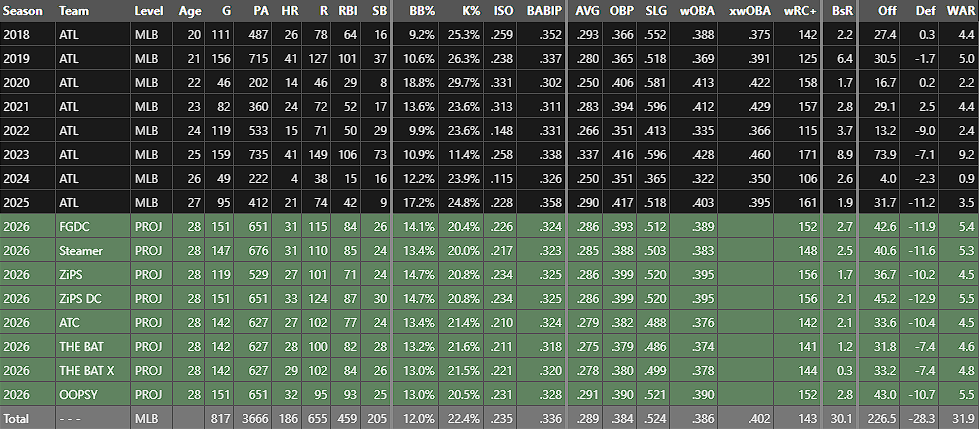
First, let’s settle on what the “FanGraphs projection” even is. Here’s the relevant section of Acuña player page:
Eight projections, each with tons of numbers. That’s a lot! But when I say the “FanGraphs projection,” I’m referring to the first green row, the FanGraphs Depth Charts projection or FGDC. That’s the top-line projection we use anywhere on the website that pulls in projections to make predictions. When you see “2026 (Proj),” it’s using that number unless otherwise stated.
That’s settled then, right? We’re projecting Acuña for 5.4 WAR. Why did I have to waste your time with an article about it? It has to do with how we make that projection, a process you’re about to learn about, probably in more detail than you wanted. Read the rest of this entry »
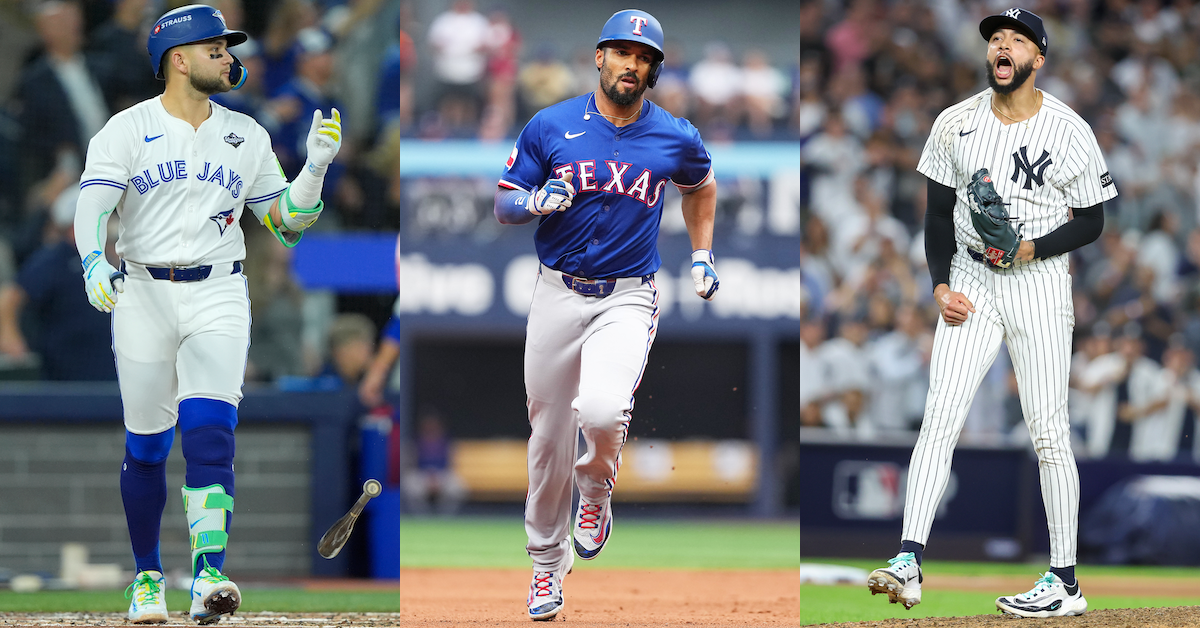
John E. Sokolowski, Nick Turchiaro, Wendell Cruz-Imagn Images
You already know how it works: January is for signings, trades, and articles that grade those signings and trades. Everything gets a letter, every transaction has a winner and loser, and positive thinkers like me hand out thumbs up left and right. I’ve rarely seen a signing I didn’t like. I think that most trades help out both sides. What about the aggregate effect of all the signings and trades, though? Which teams play the offseason game the best or the worst? Looking at the Mets this winter got me thinking.
How should we evaluate a front office, particularly in the offseason when we don’t have games to look at? I’ve never been able to arrive at a single framework. That’s only logical. If there were one simple tool we could use to evaluate the sport, baseball wouldn’t be as interesting to us as it is. The metrics we use to evaluate teams, and even players, are mere abstractions. The goal of baseball – winning games, or winning the World Series in a broad sense – can be achieved in a ton of different ways. We measure a select few of those in most of our attempts at estimating value, or at figuring out who “won” or “lost” a given transaction. So today, I thought I’d try something a little bit different.
Instead of a single number, I’m going to evaluate the decisions that David Stearns and the Mets made this winter on three axes. The first is what I’m calling Coherence of Strategy. If you make a win-now trade but then head into the season with a gaping hole in your roster, that’s not coherent. If you trade a star for teenage prospects and then extend a 33-year-old, that’s not coherent. Real-world examples are never that simple, but you get the idea. Some spread in decisions is inevitable, but good teams don’t work against themselves more than they have to.
Next, Liquidity and Optionality. One thing we know for sure about baseball is that the future rarely looks the way we expect it to in the present. Preserving an ability to change directions based on new information is important. Why do teams treat players with no options remaining so callously? It’s because that lack of optionality really stings. Why do teams prefer high-dollar, short-term contracts over lengthy pacts in general? It’s because you don’t know how good that guy is going to be in year six, and you certainly don’t know how good your team will be or whether you’ll have another player for the same position. All else equal, decisions that reduce future optionality are bad because they limit a team’s ability to make the right move in the future.
Finally, maximizing the Championship Probability Distribution. We like to talk about teams as chasing wins, but that’s not exactly what’s going on. Teams are chasing the likelihood of winning a World Series, or some close proxy of that. That’s often correlated to wins, but it’s not exactly the same. Building a team that outperforms opponents on the strength of its 15th-26th best players being far superior to their counterparts might help in the dog days of August, when everyone’s playing their depth pieces and cobbling together a rotation, but that won’t fly in October. Likewise, high-variance players with decent backup options don’t show up as overly valuable in a point estimate of WAR, but they absolutely matter. Teams are both trying to get to the playoffs as often as possible and perform as well as they can after arriving there. That’s not an easy thing to quantify, but we can at least give it a shot.
Let’s begin with a look at the transactions that reshaped the lineup. The biggest of these has to be the infield turnover, with Pete Alonso out and Bo Bichette, Jorge Polanco, and Marcus Semien in. Since we’re including Semien, we’ll have to include the departure of outfielder Brandon Nimmo as well. These decisions are clearly coherent; Alonso’s leaving meant space in the infield and an offensive deficit, and the Mets signed multiple free agents to account for that. I’ll analyze the Coherence of Strategy axis at the end of this write-up, but for each individual deal, I’ll focus on the other two axes of analysis. Read the rest of this entry »
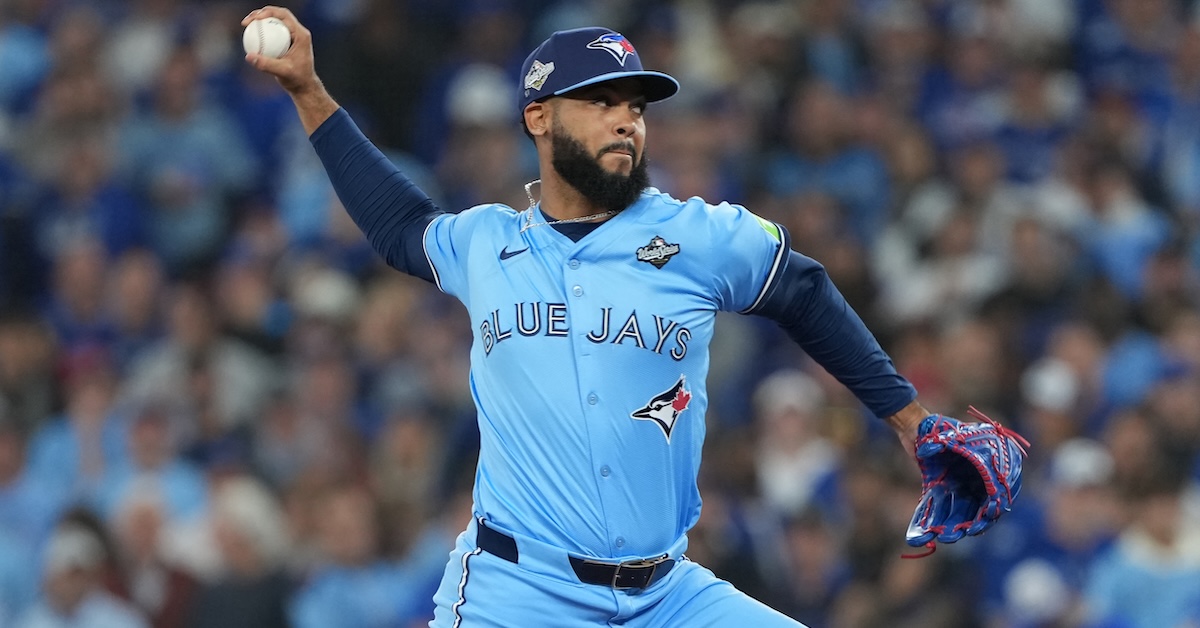
Last week, the White Sox admitted defeat in their handling of Luis Robert Jr.’s contract, shipping him out to the Mets for two lottery tickets and salary relief. That salary relief must have been burning a hole in their pocket, though. Or perhaps someone looked at their books, said “Guys, we play in Chicago but we’re projected for the lowest payroll in baseball and people are going to talk,” and handed GM Chris Getz a list of players who hadn’t yet signed. In any case, Seranthony Domínguez and the White Sox have agreed to terms on a two-year deal worth $20 million, as ESPN’s Jeff Passan first reported.
The right-handed Domínguez is no stranger to high-pressure relief work. In both the 2022 and 2023 postseasons, he appeared in mid- and high-leverage situations for the Phillies, and he handled them quite well (1.13 ERA, 0.78 FIP in 16 innings). In 2024, Philadelphia didn’t have much use for his services after his slow start, and so they sent him and Cristian Pache to the Orioles for platoon bat Austin Hays (whom they promptly non-tendered after the season). The O’s employed Domínguez for a year (he made two appearances for them in the playoffs), then dealt him and cash to the Blue Jays in exchange for Juaron Watts-Brown, a 40-FV relief prospect. He pitched for the Jays in October, and memorably had some ups and downs in their long run.
In other words, playoff teams have been employing Domínguez for years, but they haven’t been placing particularly high importance on his performance. He’s twice been traded to contenders in deadline deals, and at no point did his suitors offer much to get him. Those teams considered him a mid-leverage option; even the Blue Jays had him as a second-tier option out of their weak-link bullpen that flailed its way through October. Read the rest of this entry »
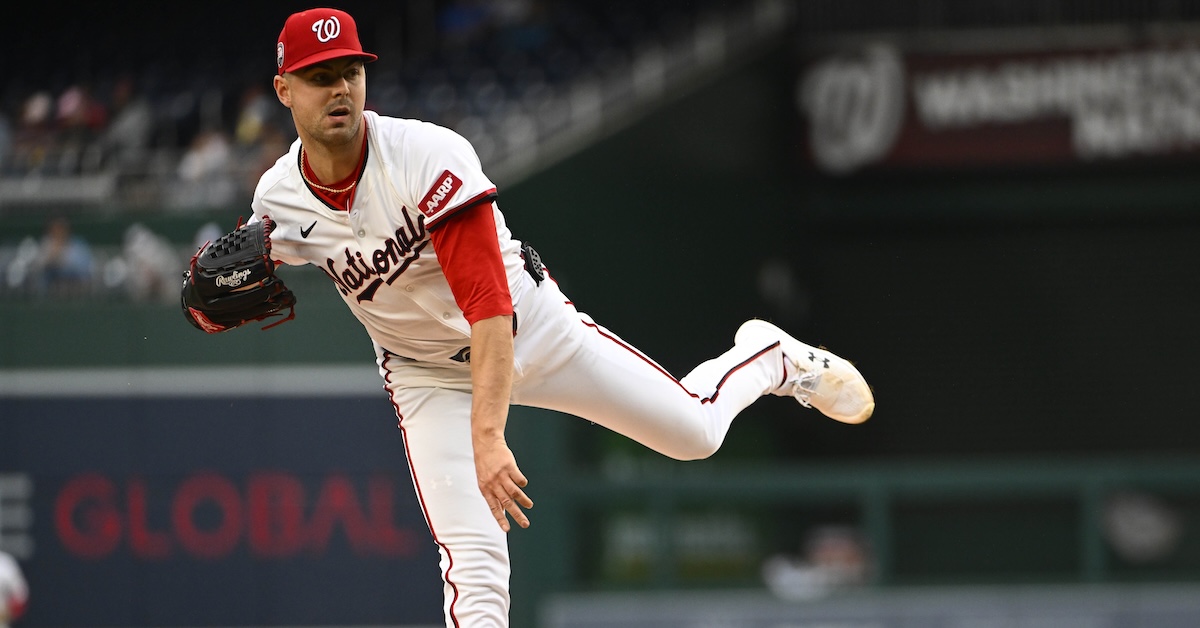
When the market is hot, it seems like it’ll never cool down. Forget the fact that we’re late into free agency and yet too early in the year for contract extensions. The last few marquee free agents to sign are starting to do so – hi, Cody – and that seems to have opened the floodgates for a series of trades. You’ve heard about all the noise the Mets have gotten up to, no doubt. They aren’t the only ones. The Rangers have jumped in on the action in a big way. On Thursday, they acquired MacKenzie Gore from the Nationals in exchange for prospects Gavin Fien, Devin Fitz-Gerald, Alejandro Rosario, Abimelec Ortiz, and Yeremy Cabrera, as Jon Heyman of the New York Postfirst reported.
In some ways, this trade has been a long time coming. Gore has been on the trade block for most of his major league career. First, he got sent from San Diego to Washington in the first Juan Soto trade. Almost immediately upon his arrival in the nation’s capital, however, he turned into a trade chip. The Nats were pretty obviously far away from competing, and Gore is the kind of arm that lots of teams dream about placing at the top of their rotation.
By 2024, Gore’s third year in the big leagues, the trade rumors were at full volume. Gore exploded out of the gate, with 98 strikeouts over 80 innings in his first 15 starts. He was a deadline target for many teams – but he slumped hard down the stretch, with a 4.48 ERA and 4.16 FIP the rest of the way, and no trade ever came to fruition. The Nats looked around that winter, didn’t move him, and then again held on after Gore came out of the gates hot, making his first All-Star appearance on the back of a 3.02 ERA (2.96 FIP) in the first half. He stayed put at the deadline – and once again slumped hard down the stretch.
That brings us to the present. Trading Gore always made sense, and the new Nationals front office finally did it. He still has two years of team control remaining, and the price for controllable starters has never been higher. His service time status lines up very well with the situation in Arlington. The Rangers have a roster that is built to contend now. Their lineup has five different hitters in their 30s (baseball-age wise, Jake Burger doesn’t celebrate his 30th until April), and only two who are 25 or younger. The rotation is led by Jacob deGrom and Nathan Eovaldi, two heroes of the 2010s who are in the twilight of their respective careers. Read the rest of this entry »
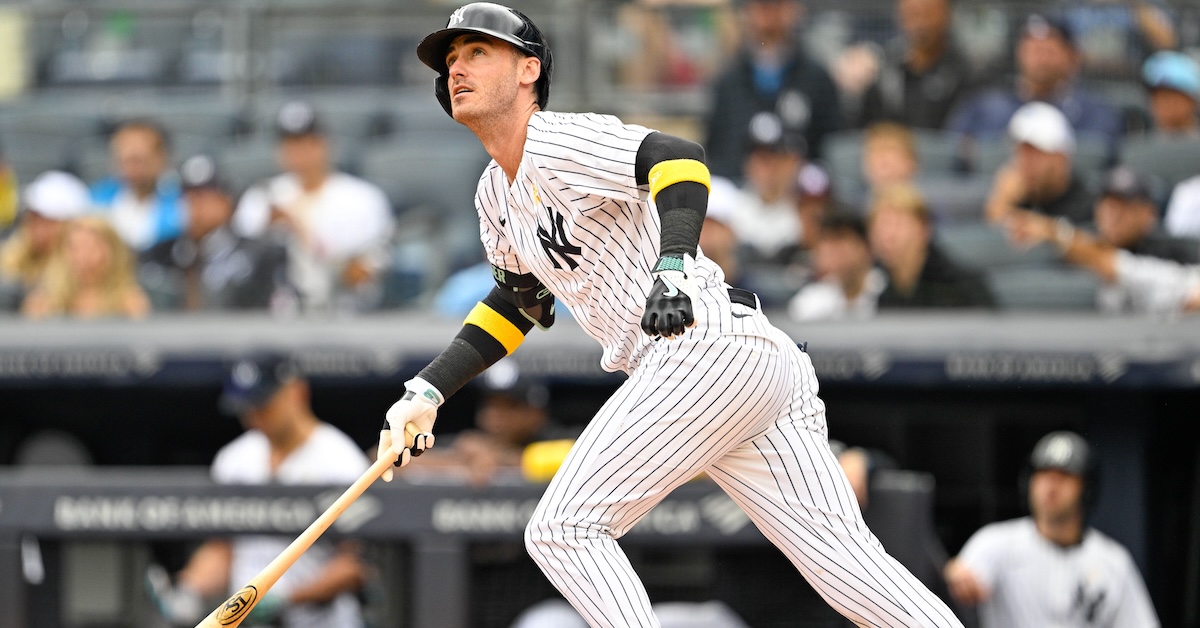
Our long national nightmare is over. After weeks of back and forth between Cody Bellinger and the New York Yankees, it’s official: He’s staying in the Bronx. The two sides have agreed to a five-year, $162.5 million deal with opt outs after the second and third seasons, a $20 million signing bonus, and a full no-trade clause, as first reported by Jeff Passan.
This fit was so obvious that it almost had to happen. The Yankees need offense, and they’d prefer it to come in the form of a left-handed outfielder who can cover center field in a pinch. They’re already familiar with Bellinger, who just put up a 5-WAR season in pinstripes. No other teams needed this exact type of player as much, at this current moment, as they did. Likewise, Bellinger was probably going to have to sign with the Yankees to get the deal he wanted. Now that that foregone conclusion has been reached, let’s unpack how this all fits together.
This contract is the culmination of a long, decorated career that was conspicuously lacking in free agency appeal. Bellinger burst onto the scene in 2017 with 39 homers for the Dodgers, taking Rookie of the Year honors in the process. He then went fully supersonic in the homer-happy 2019 season, with the rocket ball propelling him to 47 homers, a 161 wRC+, and NL MVP honors. Disaster struck in the 2020 World Series, however. Bellinger dislocated his shoulder celebrating a home run, and his performance fell off a cliff immediately after. Read the rest of this entry »
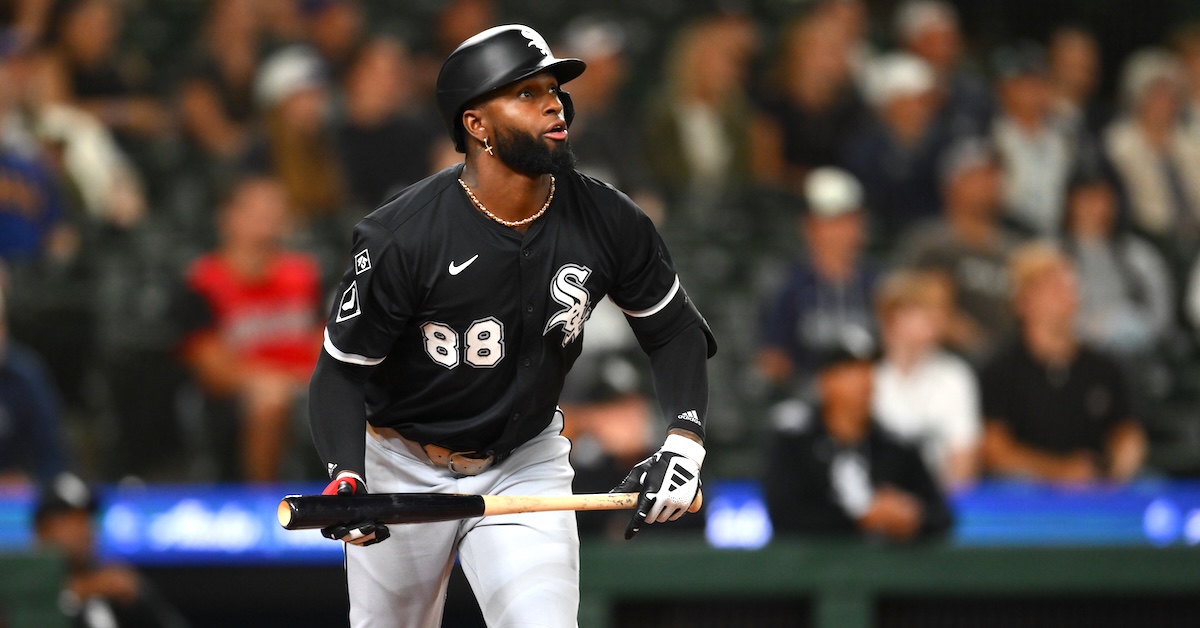
With most of the top free agents having found new homes – 12 of our top 15 have signed – the baseball transaction news figured to be light this week. Maybe the Yankees and Cody Bellinger would keep making lovey-dovey eyes at each other across the negotiating table to give us some headlines, but that felt like the only game in town for at least a few days. But just because no one is left to sign doesn’t mean nothing can happen. Out in Queens, the Mets weren’t content to sit pat after signingBo Bichette. They continued their offseason splurge by acquiring Luis Robert Jr. from the White Sox in exchange for Luisangel Acuña and pitching prospect Truman Pauley, as ESPN’s Jeff Passan first reported.
I’ve grappled with evaluating Robert innumerable times over the past few years. For a while, he was a yearly feature in our Trade Value series, an electric talent in his early 20s. Then he became an interesting litmus test when talking to team evaluators, as his production dipped but his prodigious tools remained as loud as ever. Finally, as his contract hit the expensive team option phase, I considered him for a list of top free agents, as I have to predict what option decisions teams will make. At every turn, I came away equally impressed and frustrated by Robert’s ludicrous ceiling and subbasement-level floor.
You want a tooled-up center fielder? Robert is your guy. If you click on the “Prospects Report” tab on his player page, you’ll see this short blurb by Eric Longenhagen: “Graduation TLDR: The Vitruvian Outfield Prospect in all facets save for his approach, Robert graduated from prospectdom as one of baseball’s most exciting players.” That Vitruvian Outfield Prospect phrase has stuck with me.
If you made an outfielder in a lab, he’d look a lot like this. Power? Robert has 90th-percentile bat speed and clobbered 38 home runs in his last full season of playing time. He gets the ball in the air, too, all the better to maximize his best contact. Speed? You guessed it, 90th-percentile sprint speed. He’s also among the best defensive outfielders in the game when he’s healthy. He even has a strong throwing arm, though it’s inaccurate at times. If you’re looking for a Gold Glove defender who can hit 40 homers at the hardest outfield spot and swipe 30 bags, he’s one of maybe three players in the entire majors who fits the bill. Read the rest of this entry »
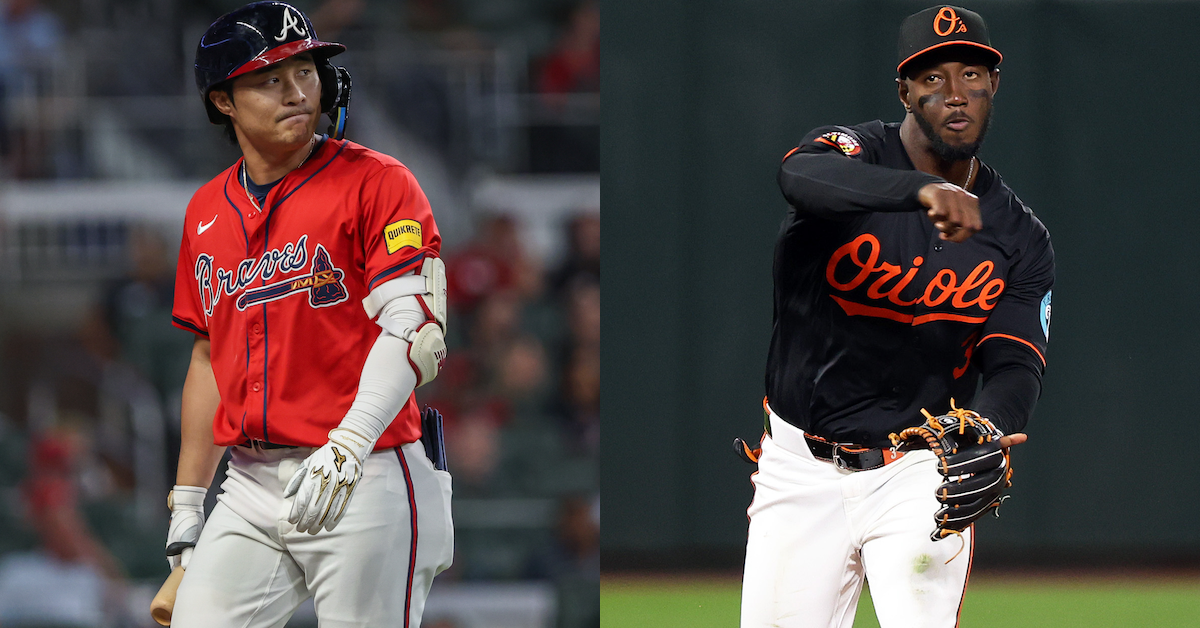
Over the weekend, Ha-Seong Kim’s whirlwind offseason took a jarring tumble. After opting out of his contract with the Braves (really his contract with the Rays, which the Braves assumed after they claimed him off waivers), he turned around and signed a one-year, $20 million deal to remain in Atlanta. But disaster struck when he slipped on a sheet of ice and tore a tendon in his right middle finger. That injury required surgery that will sideline Kim for four to five months, including roughly the first two months of the regular season.
This will be the second straight season where Kim misses significant time due to injury. In late 2024, he tore his labrum on a pickoff throw, then injured his hamstring and later his calf while rehabbing, costing him the first half of 2025. He then hit the IL twice with back injuries last year. In all, he managed just 191 plate appearances and looked understandably rusty.
That star-crossed sequence has to raise questions about the future course of Kim’s career. How could it not? It’s not so much that any of these injuries are devastating on their own, but this much missed playing time over two-plus years of his prime is no laughing matter. Last year, he never hit his stride after a late start. This year, it’s fair to expect more of the same. Even without knowing how Kim’s injured finger might affect him upon his return, our projection systems have him down for a below-average offensive line. Read the rest of this entry »
Eric Canha, Katie Stratman, Troy Taormina-Imagn Images
Last week was one of the busiest of the offseason so far, with Kyle Tucker taking his talents to Chavez Ravine and Bo Bichette heading to the Mets. Given those glitzy headlines, it was easy to miss an annual rite of winter: a weird, zero-sum-feeling trade that didn’t need to be a three-teamer but was anyway because the Rays got involved. The particulars: The Rays sent Josh Lowe to the Angels, the Angels sent Brock Burke to the Reds, and Tampa Bay got Gavin Lux from Cincinnati and prospect Chris Clark from the Halos.
The first thing that drew my eye in this trade is that the two hitters are at least superficially similar: lefties with enormous platoon splits and no real defensive home. Lux has a career 99 wRC+; Lowe 101. They get to those marks in extremely different ways, though, and I think that’s as good of an entry point into analyzing this swap as any.
Lowe is an archetypical lefty power bat, and the Angels simply don’t have anyone like that. Last year was easily Lowe’s worst as a pro on a rate basis, and he also spent a month and a half on the IL. But his 11 homers would have been the second-most by an Angels lefty, behind Nolan Schanuel’s 12 in 150-ish more plate appearances (Yoán Moncada also hit 12 lefty homers, but he left in free agency). Overall, the Angels were 29th in baseball in home runs hit by lefties, with 34 for the entire team put together. Read the rest of this entry »
Our annual preview of free agency doesn’t include projected destinations for free agents. I don’t know if that has always been a site-wide editorial decision, but it’s one I wholeheartedly agree with. Predicting how much money someone will get is hard enough. Predicting which team out of many similar teams will give that money to them is essentially guesswork; sure, matching names to teams has entertainment value, but it’s hard to actually be good at it. Except, if you made me predict where Willi Castro would have signed before this offseason started, I absolutely would have picked the Rockies, and voila: Castro agreed to a two-year, $12.8 million deal with Colorado on Thursday.
The Rockies haven’t been players in free agency for a number of years, though that appears to be changing. Earlier this month, they signedMichael Lorenzen to a $8 million contract, the largest deal they’ve given to a pitcher in the 2020s. Castro’s deal is the biggest guarantee they’ve handed out to a free agent since Charlie Blackmon, and that hardly counts, what with him being a long-time Rockie signing the last deal of his career and all. Really, Castro is the team’s biggest signing since Kris Bryant, which says a lot about how the past few years have gone in Colorado.
What compelled the team to wade into the free agent position player pool – the shallow end, to be sure – for the first time in years? Signing a good major league player, that’s what. Castro is a versatile defender who won’t embarrass you offensively. In 2025 alone, he logged 100 innings at four different positions, plus cameos at shortstop and in center field. He’s not a standout at any of those spots, but the sheer flexibility is inarguably useful. Roster Castro, and you have a nice backup plan nearly everywhere. He’s a switch-hitter, too, so he can shore up any of the positions where you’d really prefer a platoon, regardless of who his platoon partner might be. Read the rest of this entry »