Craig Edwards FanGraphs Chat–6/20/2019

June 20, 2019
In the winter of 2017, Lance Lynn was coming off a season with a solid 3.43 ERA but poor peripheral numbers and couldn’t get the multi-year deal he desired, eventually settling with the Minnesota Twins. Lynn got off to a rough start, but from May on he put up a 3.34 FIP and a 4.13 ERA with the Twins and Yankees (following a trade), with the former number making Lynn one of the top-15 pitchers in the game and the latter number befitting an average-to-slightly above-average innings-eater. Heading into 2018, Lynn was paid based on his poor FIP and not his solid ERA, but heading into 2019, Lynn received a contract based on his average ERA and not on his very good FIP. Lynn agreed to a three-year deal worth $30 million to pitch for Texas, and 15 starts into in his Rangers career, the MLB pitching WAR leaderboard looks like this:
| Name | IP | K/9 | BB/9 | ERA | FIP | WAR |
|---|---|---|---|---|---|---|
| Max Scherzer | 106.1 | 12.4 | 1.9 | 2.62 | 2.19 | 4.2 |
| Lance Lynn | 93 | 9.9 | 2.3 | 4.16 | 3.00 | 3.2 |
| Hyun-Jin Ryu | 93 | 8.2 | 0.5 | 1.26 | 2.51 | 3.1 |
| Matthew Boyd | 88.2 | 11.4 | 1.7 | 3.35 | 3.00 | 2.8 |
| Chris Sale | 90.1 | 13.0 | 2.1 | 3.49 | 2.80 | 2.8 |
| Lucas Giolito | 85.1 | 11.0 | 3.1 | 2.74 | 3.08 | 2.8 |
| Gerrit Cole | 96.2 | 13.8 | 2.3 | 3.54 | 3.10 | 2.7 |
| Jose Berrios | 97.2 | 8.7 | 1.6 | 2.86 | 3.52 | 2.6 |
| Frankie Montas | 82 | 9.7 | 2.3 | 2.85 | 2.89 | 2.6 |
| Charlie Morton | 87.1 | 11.0 | 3.2 | 2.37 | 2.88 | 2.5 |
| Jacob deGrom | 91 | 11.1 | 2.0 | 3.26 | 3.21 | 2.5 |
| Jake Odorizzi | 76.1 | 10.0 | 2.8 | 2.24 | 2.99 | 2.4 |
| Stephen Strasburg | 96 | 10.8 | 2.3 | 3.75 | 3.27 | 2.4 |
There’s Max Scherzer at the top, and right behind him is Lynn with 3.2 wins above replacement on the season. While some might have the urge to point to Lynn’s 4.16 ERA and insist there is something wrong with WAR, particularly at FanGraphs, I would request fighting against any such urges. First, I’d like to note that over at Baseball-Reference, Lynn’s 2.7 WAR ranks 12th in all of baseball and isn’t too far off from the one above. As for that ERA, Lynn has put together an unusual season with respect to runs allowed. First, Lynn has no unearned runs on the year. While most pitchers’ earned run totals are around 90%-95% of their runs allowed, Lynn’s runs have all been earned. Indeed, Rangers pitchers outside of Lynn have earned run totals that are 93% of their total runs allowed. While it is possible that Lynn has benefited from great defense, that’s unlikely as we’ll get to below. In any event, that explains roughly 0.3 of Lynn’s higher ERA. Read the rest of this entry »
The Nationals seem very unlikely to trade Max Scherzer (and his broken nose), but with them holding the 11th-best record in the National League and being five games under .500, rumors are starting to swirl. Ken Rosenthal discussed the possibility of a trade, mostly laying out the reasons why a deal was unlikely. While Scherzer trade proposals might be more fantasy than reality, determining his trade value is more reality-based, even if more of an academic pursuit.
A year ago, when constructing the Trade Value series, Kiley McDaniel put Max Scherzer at No. 41, and he indicated the difficulty surrounding a player like Scherzer.
Some small market teams like Oakland, Pittsburgh, and Tampa Bay could technically afford $22 million through 2021 then $15 million through 2028 for three years of Scherzer — it’s a huge but not insane part of their payroll — they would just never actually do that. So with all of those teams off the board and most of the middle-tier teams choosing to use their money with more of medium-term outlook, the market for Scherzer appears as though it would be limited. Also, he turns 34 this month and will decline at some point, even if he’ll punch me for saying that.
All that said, for big-market contenders that needs an ace in the playoffs, a 6.5-WAR pitcher may have the impact of a 10 WAR pitcher if deployed in a certain way during the postseason. And some orgs can stomach the $15-22 million tab, regardless of how long it runs, for that kind of impact over three postseasons. A trade-value list for just the Yankees may have Scherzer 20 spots higher, but this list is for a little bit of everyone. I feel like Dave and I did the math here similarly, as I moved him down eight spots from the 2017 edition of this series, based mostly on aging.
Assessing a generic trade value for a player like Scherzer is a problem because the market for Scherzer’s services is a small one, but among the teams that might be interested, the value to those teams would be higher than a standard analysis might provide. Scherzer’s value to the Nationals complicates matters further. To get an idea of what I’m talking about, let’s start with some generic projections for Scherzer, incorporate his salary, and estimate that the value of a win is around $9 million. Read the rest of this entry »
On Saturday, the Cardinals battled back from deficits of 6-1 and 8-3 to find themselves trailing by just one run with two outs in the bottom of the ninth. Yadier Molina had just singled off Mets closer Edwin Diaz. Cardinals pitcher Jack Flaherty came in off the bench to pinch run. Kolten Wong hit a high blooper that found its way in between second baseman Jeff McNeil and a diving Michael Conforto. Flaherty, showing some of his inexperience on the basepaths, twice looked back at the play instead of focusing on third base coach Pop Warner as he was heading toward third base when the ball hit the ground. He then ran for home.
This is how the play moved forward from there.
We can see Flaherty stumble a bit at third, though that stumble doesn’t look like it made a huge difference as the throw beat Flaherty by about 10 feet. With the benefit of hindsight, we know that the decision to send Flaherty ended the baseball game and handed the Mets a victory. As for the decision-making at the time of Warner’s choice to send Flaherty home, that deserves a closer examination.
The first step in looking at the decision to try and tie the game is establishing how much benefit the Cardinals would receive if Flaherty was safe and compare that to the loss if Flaherty was thrown out. We know that getting thrown out ends the game, so the Cardinals win expectancy in that scenario is of course zero. There are two other scenarios, with the first being if Flaherty stays. The Cardinals would then still be down by one run, but they would have runners on second and third base with two outs and Paul Goldschmidt stepping up to the plate. The second scenario is if Flaherty scores the tying run and Paul Goldschmidt steps up to the plate with a runner on second base. Read the rest of this entry »
Shohei Ohtani is a fascinating player. He’s perhaps slightly less fascinating this season while he is only hitting and not pitching as well, as he did in his first campaign. Although the fact that pitching can be taken away from him for a season and he can still be a useful baseball player is still pretty incredible. On the season, Ohtani is hitting .281/.350/.512, good for a 131 wRC+ in 137 plate appearances. Last night, Ohtani added the latest interesting wrinkle to his career by hitting for the cycle.
Here’s the first plate appearance of the game, in which Ohtani hit a three-run homer.
While the triple is the most difficult part of the cycle, the home run is the most important in terms of its impact on the field. This was particularly true last night, as Ohtani’s homer put the Angels up 3-0, increasing the team’s win probability by 18% as the biggest play of the game. The next time Ohtani came up, he hit a double. Read the rest of this entry »
A year ago, Aaron Nola was one of the best pitchers in baseball. His 3.01 FIP was very good, his 2.37 ERA was even better, and his 5.4 WAR was fourth in the National League and helped him to a third-place finish in the Cy Young voting. After four starts this season, Nola pitched like one of the worst pitchers in baseball with a 6.25 FIP, a 7.45 ERA, an ugly 13% walk rate, and a -0.2 WAR that ranked 74th out of 77 qualified pitchers. At that time, Dan Szymborksi diagnosed Nola’s issue with walks and homers and noted the following:
At least in the early going, batters seem to simply be taking a more passive approach to Nola after his breakout 2018 season, and he hasn’t adjusted. And he’s getting away from some of the things that he did successfully in 2018, such as daring to throw curves to lefties when behind in the count (he’s dropped from 39% to 20%). Batters are more patient and Nola’s been more predictable.
Since that time, Nola has essentially returned to form. He had one more bad start where he gave up two homers but encouragingly struck out nine batters against one walk. Since that start, Nola has taken the mound nine times and his FIP has been 3.30, a 76 FIP- in this run-scoring environment and very close to the 73 he’s put up over the last three years. His ERA is a very good 3.48, and though his walk rate is slightly elevated at 10%, his 26% strikeout rate is right in line with last season. In his piece, Szymborski produced a table showing the cause of Nola’s high walk rates. Batters weren’t chasing pitches they used to and they were making contact when they did. Here’s the bulk of that table, with Nola’s work through the time of Dan’s piece on April 18 and since then.
| Year | K% | BB% | O-Swing% | Z-Swing% | Swing% | O-Contact% | Zone% | F-Strike% | SwStr% |
|---|---|---|---|---|---|---|---|---|---|
| 2016 | 25.1% | 6.0% | 29.5% | 55.7% | 42.2% | 61.5% | 48.3% | 60.7% | 9.6% |
| 2017 | 26.6% | 7.1% | 29.4% | 60.8% | 44.5% | 59.3% | 48.2% | 64.4% | 10.8% |
| 2018 | 27.0% | 7.0% | 33.2% | 64.2% | 47.0% | 60.9% | 44.7% | 69.4% | 12.4% |
| Thru 4/15/19 | 21.8% | 12.6% | 25.5% | 55.4% | 38.4% | 70.0% | 43.0% | 48.3% | 8.4% |
| Since 4/15/19 | 26.8% | 9.2% | 30.3% | 57.0% | 41.1% | 61.8% | 40.4% | 62.4% | 9.2% |
Nola isn’t quite repeating what he did a year ago, but he’s not too far off either. He’s throwing fewer pitches in the strike zone and he’s not getting as many swinging strikes, which is something of an issue, but when hitters swing at pitches outside the zone, they are whiffing like they used to. Getting a lot more first strikes is a good thing for Nola, but even better, he’s actually finishing off batters once he gets that first strike. Read the rest of this entry »
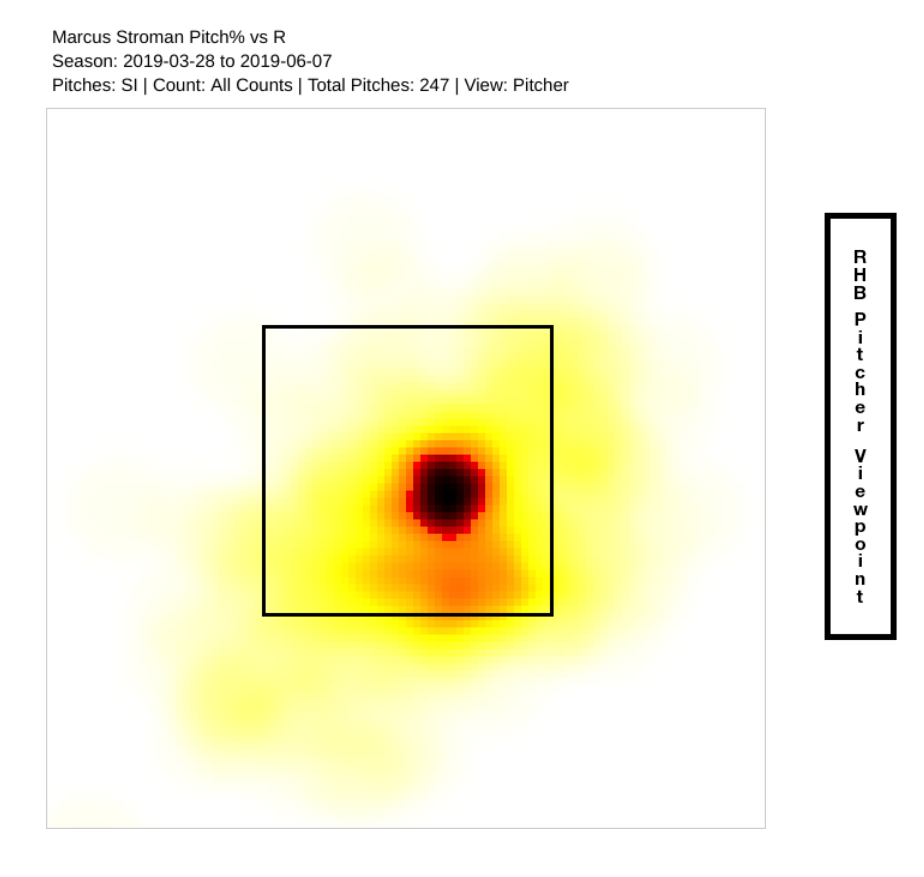
We are still about seven weeks shy of the trade deadline, but the list of teams trying to add to their rosters (and their counterparts willing to move quality players) is beginning to show its form. And as they are very July, teams are on the lookout for starting pitching, with the list of pitchers who might be available also beginning to take shape: Madison Bumgarner of the Giants, Marcus Stroman and Aaron Sanchez of the Blue Jays, the Rangers’ Mike Minor, the Tigers’ Matthew Boyd, and perhaps Mike Leake and Marco Gonzalez of the Mariners are all potential targets. Inevitably, some of these players will be traded and make a difference for teams down the stretch, but beyond simple availability, it is probably useful to know why a pitcher is desirable in the first place. Marcus Stroman is a good pitcher having a good year, and with another season of team control after this one, he might be the best starting pitcher traded this season.
Stroman is a bit of a throwback in today’s game, relying on a sinker and posting pedestrian strikeout totals. He challenges hitters with the sinker, as evidenced by his heatmap against right-handers using the pitch this season:
Hitting the ball over the fence in San Diego can be difficult, though not quite as difficult as it used to be after the team changed the dimensions in 2013. Similarly, hitting the ball out of the park to center and the opposite field is generally a more difficult task for hitters. Around 60% of home runs this season are pulled by batters, while only 15% of dingers are hit to the opposite field. These difficulties have proved to be of little consequence for 23-year-old Franmil Reyes.
The young slugger’s statistics can leave you slightly underwhelmed when compared to his imposing figure and powerful bat. Reyes has a 120 wRC+, which is good but not great, and his defense in the outfield keeps his WAR at 0.8 on the season. Reyes doesn’t walk a ton, he strikes out a bit too much, and he doesn’t add anything on the basepaths, but he can do this:
Fourteen of Reyes’ 19 homers have gone out to center or the opposite field. That figure is the most in baseball and two clear of Christian Yelich and Peter Alonso, and includes five homers to the opposite field. Ten of those 14 homers have come in Petco Park, one of the more difficult stadiums for lefties to hit homers, and they have the advantage over Reyes in being able to pull the ball to right field. Trying to hit homers to the opposite field is generally not advisable, but for a man of Reyes’ size and power, it’s a worthwhile strategy. And when Reyes hits the ball in the air to center or the opposite field, he hits the ball harder than anyone in the game, per Baseball Savant: Read the rest of this entry »
If the postseason started today, the defending champion Boston Red Sox would not be playing. The presumptive American League Central winner Cleveland Indians would not be playing. Instead, the Texas Rangers, projected to lose 90 games before the season began, would be squaring off against the Tampa Bay Rays for a spot in the Division Series if current results were to hold the rest of the way. Now, with 60% of the season left to go, current results are unlikely to hold the rest of the way. But 40% of the season isn’t an insignificant portion of the schedule, perhaps making the Rangers the most surprising team of 2019.
The Twins and Rays might have better cases for being the biggest positive surprises based on their record, but neither team was projected to be bad like the Rangers. The graph below shows every teams’ projected winning percentage before the season started, and their winning percentage through Sunday’s games:
