Author Archive

The Awfully Quiet Pirates

Twitter can be an awfully contentious place. After noting NL Central payrolls in a tweet over the weekend, I received a barrage of replies and quote tweets loudly complaining about the Pirates’ failures to invest in the team. And it’s not just folks who are mad online causing a stir. Pirates fans have spoken with their wallets as well; attendance has dwindled since the team made three straight playoff appearances earlier this decade. The Pirates have a decent team, but have done almost nothing this offseason to improve it, and seem likely to enter 2019 with payroll at it’s lowest point in the last five seasons.

PNC Park opened in Pittsburgh in 2001, and despite a 100-loss team, nearly 2.5 million fans showed up to watch the Pirates play. The team averaged 93 losses and attendance of 1.75 million fans over the next 11 seasons. After topping two million fans in 2012 — as the club approached a .500 record for the first time since Barry Bonds left for San Francisco — Pittsburgh made the playoffs each year from 2013 to 2015 and averaged 2.4 million in attendance per season. The 2016 season was a losing one, and attendance waned as the summer wore on, but positive expectations kept it at a reasonably high 2.25 million fans. Expectations were lowered in 2017; attendance dropped below two million. After trading Andrew McCutchen and Gerrit Cole, confidence in the club among fans seemed to drop to a new low as attendance dipped below 1.5 million despite a winning record.

The Pirates actually put together a decent team a year ago, but losing their two stars meant that the club’s surprising start didn’t translate in to people at the gate. At the All-Star break, Pittsburgh was averaging just 18,155 fans per game. Contention and the acquisition of Chris Archer breathed some excitement into the franchise, and in the month after the All-Star Break, the team averaged 25,357 fans per game, a two-million-plus pace over the course of the season. But as the Pirates fell out of the race, attendance plummeted again.

Last June, Pirates President Frank Coonelly acknowledged that fans had lost some of their faith in the team, faith the team would need to earn it back.

“We are genuinely focused on those great Pirates fans who are coming out to PNC Park and how much we appreciate their support,” Pirates President Frank Coonelly said in a statement responding to a request for comment. “At the same time, we appreciate that we have work to do to bring back fans who are not joining us at the park this year. Our television ratings remain in the top five in MLB, so we know that Pirates fans are following the team. We understand that we need to provide a compelling reason for all of our fans to come to the best ballpark in baseball.”

It was perhaps with those sentiments in mind that Pittsburgh pursued Chris Archer and Keone Kela, players who might have helped them if they had continued to contend in 2018, but who also could improve the club in future seasons. Given that Archer’s contract, assuming the team picks up his option years, runs through 2021 — a timeline that coincides with that of their best player, Starling Marte — it would be reasonable to assume the Pirates see a window of contention during that stretch.

This is what the Pirates have done so far this offseason:

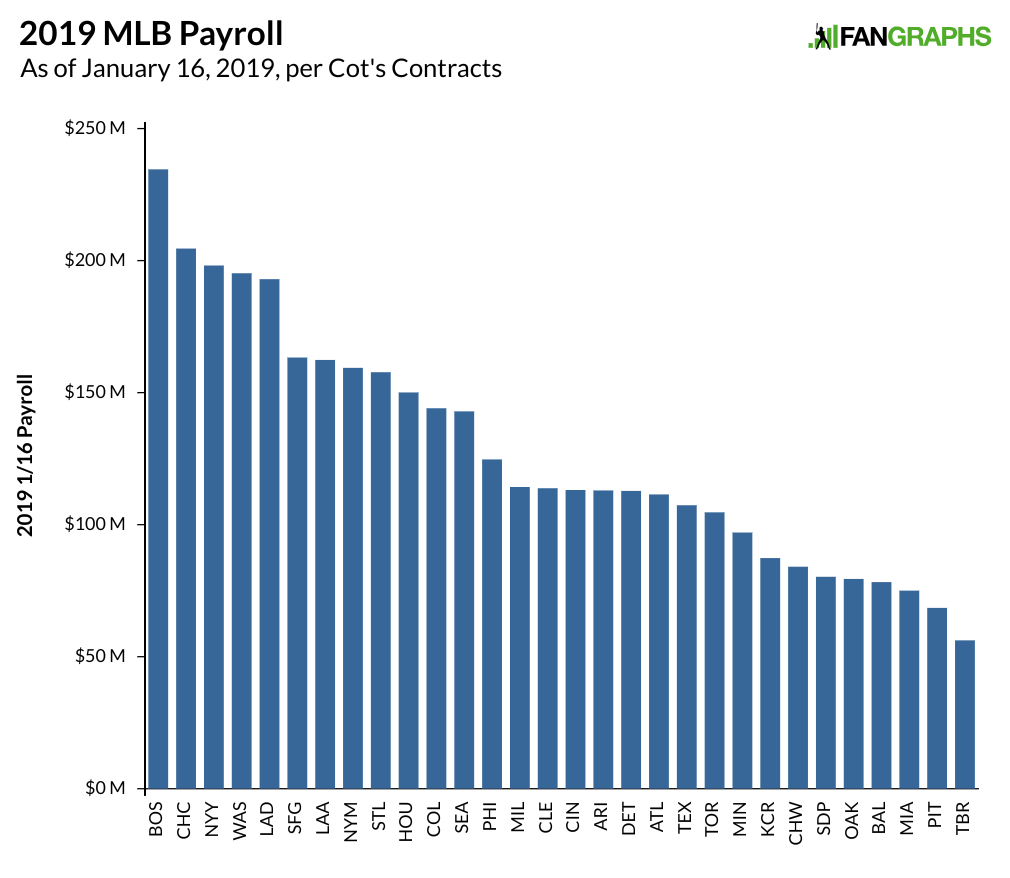
The team has also made the typical MLB teams minor league signings; among those, Tyler Lyons is the most interesting and promising. They also let Jordy Mercer go in free agency and declined Josh Harrison’s team option, though those weren’t big losses. The issue is the lack of progress on the major league roster from a team that, as Jeff Sullivan noted earlier this week, isn’t far from a playoff spot but currently has a projected Opening Day payroll of roughly $68 million. Only the Tampa Bay Rays have a lower projected payroll at the moment. This is how Pirates payroll has progressed over the years compared to MLB averages.

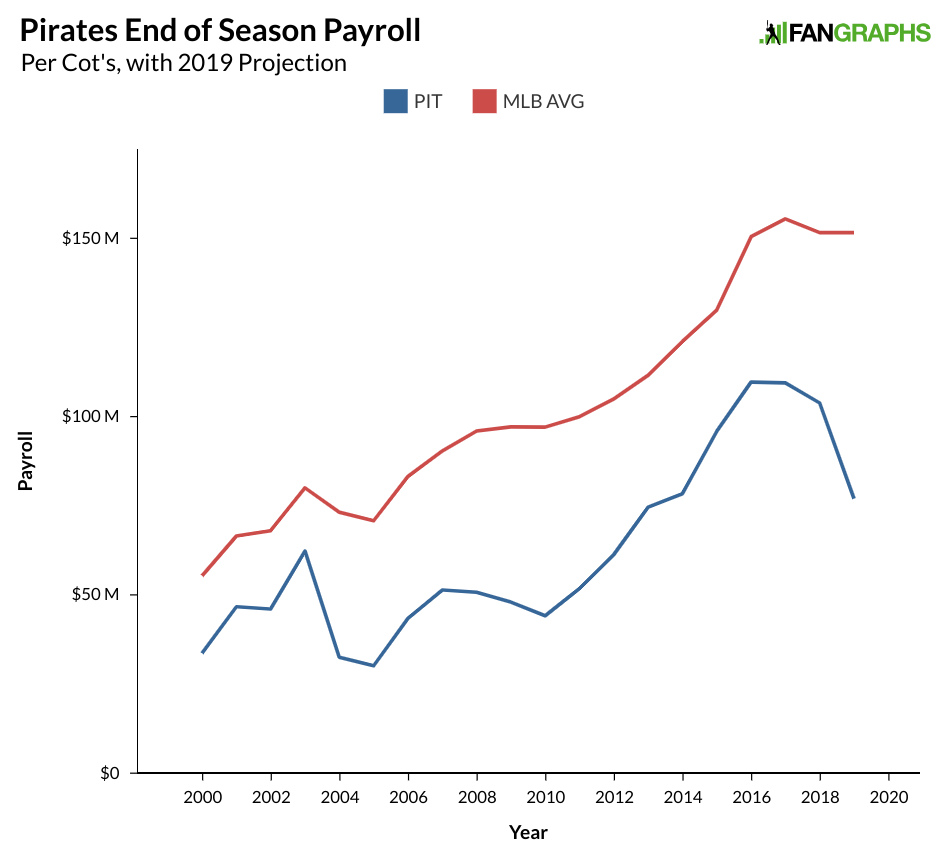
The first thing we might note is that the Pirates have always been a good bit below league average when it comes to spending. Given that the team plays in a smaller market, that’s not too surprising. The most obvious complaint for Pirates’ fans is the huge downturn in 2019 payroll we see as of now despite competing in 2018, losing no significant contributors this offseason, and gaining a full season of Chris Archer and Keone Kela. But that’s not where the angst regarding the Pirates’s spending really begins. If we were to look at graphs like the ones above for teams from similarly small markets like Milwaukee, Cleveland or Kansas City, we would expect to see similar graphs. What we would actually see, though, is that when those teams became competitive, they immediately invested more money into the roster to capitalize on that excitement, and ran close to (Cleveland) or above league-average payrolls (Milwaukee and Kansas City).

It’s that failure to invest that has disillusioned fans, and created a need for the team to somehow draw them back to the ballpark. Trading for Archer and Kela was a very good start, but at this point in the offseason, it’s hard to see how much more the Pirates can do given the remaining options and their purported budget constraints. They have mostly let the offseason pass them by, leaving deficiencies in the middle infield and in their rotation depth largely unaddressed.

In the middle infield, the team has options like Adam Frazier, Kevin Newman, Kevin Kramer, and Erik Gonzalez, but in a free agent market with a glut of reasonably priced options at second base, it’s hard not to think an opportunity was missed.

In the rotation, Mitch Keller might be ready to take a spot, but further depth would have raised the floor — and potentially the ceiling — for a team still close to contention. There are still some starters out there who could help, like Wade Miley, Gio Gonzalez, and of course, Dallas Keuchel, but it is possible the Pirates missed the boat on a better fit earlier in the offseason.

The Pirates had an opportunity this offseason to continue repairing their relationship with their fans. But an approach that looked so promising at the trade deadline has left much to be desired this winter. In order to win back the fans — and potentially gain back close to a million attendees a season — the team will have to win consistently, or at least offer a reasonable expectation that they might. There are lots of teams with built-in buffers that help keep their attendance from falling too far. The Pirates are not one of those. Their quiet offseason isn’t likely to attract more fans to the park on Opening Day, and their lack of additions might also hurt them at the end of the season in the standings.


A Look at the Padres’ Finances

On the public side, there are few opportunities to see the precise financial machinations of major league baseball teams. The Atlanta Braves are a publicly traded company so we have some information on their inner-workings. And a recent piece by Kevin Acee at the San Diego Union Tribune provides a little bit more information. Acee was granted access to some of the Padres’ finances, though as Acee noted, the league keeps a close watch on financial information and generally doesn’t want it to get out:

The caveat from the club was that many of the numbers shared herein had to be “general.” The Padres are a private company and one of 30 members of a greater private organization. One member does not have the prerogative to make public financial data Major League Baseball has not approved for release.

The Padres’ decision to grant a reporter access to some of the team’s financial information is an unusual one, though the motivation is fairly clear. The Padres are still in the midst of a rebuilding process that isn’t likely to end this season. The club believes their window of contention isn’t yet open and as a result, they aren’t likely to spend big right now. A peek into the books, and the team’s debt, helps them provide further justification for that lack of spending. There is a lot of financial information disclosed in the article, and it is probably best to break things down a bit.

The Debt

The crux of Acee’s article involves a refinancing of the debt the team’s current owners have carried since purchasing the Padres. According to the article, that debt amounted to roughly $193 million at the time of the purchase back in 2012 — it was no doubt factored into the purchase price — and the interest rate on the loans was something like 8.5%. Due to the nature of the loan, which included a make-whole provision that would require paying extra for paying down the loan early, refinancing it to get a lower interest rate would have meant an extra payment of close to $70 million. As a result, the team elected to make payments on the loan, including interest payments of $13 million in 2015 alone.

By 2017, the make-whole penalty was down to $28 million and the club made a cash call for about half of that amount and used some of their MLBAM money for the rest. Reading between the lines here, the piece mentions a total of $68 million in money coming from the sale of BAMTech, with $50 million of that amount presumed to have been received last year. That means that the first sale of MLBAM to Disney, which netted the league one billion dollars, likely resulted in some smaller payment, perhaps $18 million, that was used by the Padres in their refinancing in 2017. The team appears to have further used about $45 million of the $50 million BAMTech proceeds to pay down additional debt. The club has now paid down 40% of the original $193 million, reducing interest payments to around $4 million, a savings of around $8 million per year, plus additional savings on principal payments. In short, the club took $15 million of owner money. plus nearly all the BAMTech money it received, and used it to make $10 million or more per year for the foreseeable future. It has obviously been a good investment for the owners, and the tenor of the article suggests that that money will be invested back into the club at some point in the future, likely, if team officials are to be believed, when the club is closer to contention.

The Minors

In 2016, the Padres were coming off a minor debacle in 2015 (more on that in a bit), having expended a decent amount of cash and prospect capital to attempt to contend. That attempt failed, and the Padres decided not to invest any more money in the major league ball club. Under baseball’s old international spending rules, teams could splurge on international prospects for a year before being restricted to more expenditures in the following two seasons. The Padres splurged like nobody had splurged before, spending around $40 million on prospects and around that amount on penalties. Between the major league payroll and the bonuses for the draft and international amateurs (and the penalties that followed), the team probably spent close to $200 million in 2016, with Acee’s piece indicating the owners pitched in about $20 million to make that happen.

As for the results, the Padres now have one of the best farm systems in baseball, and that 2016 class is a big reason for their success. As of the end of last season, the Padres had 12 players from that class alone receive a graded rank, including three who already project as average despite the fact that most of these players are under 20 years old. Those 12 prospects, including Adrian Morejon, Luis Patino, and Michael Baez, were already worth roughly $100 million by the end of last year. While it hasn’t impacted the results at the major league level yet, that investment should pay huge dividends going forward. As for investments that didn’t go so well…

The First Prellering

The Padres hired A.J. Preller in the middle of the 2014 season, and Preller aimed to make the team a contender the following year. He essentially traded Yasmani Grandal for Matt Kemp, then sent prospects to Atlanta for Justin Upton. He traded Joe Ross and Trea Turner, among others, for Wil Myers and others. James Shields was given a four-year contract. Right before the season started, he took on the money owed to B.J. Upton to get Craig Kimbrel. Those deals added about $20 million in payroll over the previous year and about $40 million over the 2013 campaign. The moves weren’t successful, although they weren’t quite the disaster the Union-Tribune piece and Padres ownership make them to be.

In the piece, the club claimed to have spent $40 million more for the season. That is partially true given they spent that much in new salaries, but when compared to the previous season, the additions were about half that much. Interestingly, the club indicated that all that movement netted the team an extra $15 million in ticket sales and concessions. While that number isn’t too far off from the payroll increase, we can glean more from that bit of information. From 2014 to 2015, the Padres increased attendance by 265,000 fans. Some simple math has the increase in revenue at about $57 per attendee. What’s interesting about that information is just how the attendance increase happened. The Padres’ gambit almost worked.

On June 13, the Padres had a .500 record, were five games out of first place, and three games out of the wild card. Over the next month, they went 9-17 and fell out of the playoff race. Through the trade deadline that season, the club was averaging 31,782 fans, but after the season went south, attendance the rest of the way dropped to 28,200. If the team had remained competitive and drawn the same amount, that potentially would have meant another $6.5 million in revenue, making the increase in payroll worth it. If the team had made the playoffs, the club would have come out ahead. Adding the declining Kemp, the unproven Myers, a one-inning closer in Kimbrel, and getting a below-average performance from Shields sunk the club in 2015, but the decision to go for it wasn’t necessarily bad; it just turned out that some of the players underperformed or were poor fits on the roster. And the added salary commitments ensured the team would spend millions on players who wouldn’t even be with the team after another season. Preller’s first go at building a contender failed; the second, as noted, had to take a different approach.

Revenue Estimates

The article doesn’t come out and say how much the Padres make, but there are a fair number of estimates. First, the piece says that interest payments went from 5% ($12.6 million in 2015) to 2% ($4.6 million in 2018) of the budget, which would put revenues somewhere between $252 million and $230 million, though a few decimal points of difference on the interest percentage significantly changes the total. Looking at their larger expenditures and the percentage of expenses might be more helpful. Roughly one-third of revenues have gone to major league salaries over the last four years, which would put average annual revenue at around $295 million. They have spent around 22% of revenue on operating expenses — that number is listed at $68 million, which would put revenues at around $310 million. Forbes last year estimated the Padres’ revenue at $266 million, which now looks like that might be a little low. I should also note that the team does spend money on stadium maintenance and improvements along with all those debt repayments, but that those amounts are taken out of net local revenue and serve to increase the amount of revenue sharing they receive from the league.

Looking Ahead

Acee’s whole piece is fascinating, and I recommend reading it in full. All of baseball has seen a considerable increase in revenue over the last few seasons, an increase from which the Padres have benefited. With their revenues, they have opted to pay down debt and make an international splash. Their payroll has been lower due to those decisions, and the amount of payroll we actually see on the field has been lower still, due to bad contracts taken on in trades and free agent signings for players who were later dealt with money attached. The explanation offered in the piece is pretty clear, and while the team wasn’t completely forthcoming, most of the information checks out. The team is asking fans to be patient for one more year. Building up the minor league system should eventually create a better on-field product at Petco, but the team’s debt reduction and refinancing does more to add to a franchise value that has already doubled since Executive Chairman Ron Fowler’s group took over seven years ago. The club will need to continue to invest in the big league product to demonstrate that this is more than just perpetually shifting fans’ expectations off into the future. It’s up to the fans to determine how much more losing they can stomach.


After a Bad 2018, Cody Allen Heads to Angels

After he signed with the Yankees, Adam Ottavino became the ninth reliever on our Top 50 Free Agent list to get a contract for next season. The Yankees taking Ottavino off the board meant there were just two relievers to go. One is Craig Kimbrel, who has been one of the better relievers in baseball over the last half-dozen seasons. The other is Cody Allen, who was one of the better relievers in baseball in 2015, solid in 2016 and 2017, and not very good last year. His poor 2018 season showing plunged him down our rankings and left him as one of the less desirable proven-reliever types available this offseason. His track record did mean something, though, and per Ken Rosenthal, he’s landed a one-year, $8.5 million deal with the Angels that has the chance of being worth $11 million based on games finished.

Allen, picked in the 23rd round of the 2010 draft, moved quickly through the Cleveland system as a reliever, reaching Double-A a year after he was drafted and hitting the majors one year later. He was a good reliever in 2013 and 2014, with sub-3.00 FIPs and ERAs better than that. He took over the closer role in 2014 and had his best season the following year, striking out 35% of batters, walking 9% and giving up just two home runs all season, to go along with a 15% infield fly rate. When Cleveland acquired Andrew Miller in 2015, the club could afford to put the lefty in high leverage situations in the middle of games without worrying about the ninth because Allen was closing. He didn’t give up a run during their playoff run to the World Series and struck out 24 of the 55 batters he faced.

Allen had another solid season in 2017, though not as good as his 2015 peak due to a slight decline in strikeouts and an increase in homers. In 2018, Allen started off the first two months of the season pitching much like he had his prior two years. His strikeout rate had dipped to 25%, but his walk rate was good and he only gave up two homers on his way to a 3.54 FIP and 3.00 ERA. He wasn’t great, but he was getting the job done. From June to the end of the season, his strikeout rate was up at 29%, but his walk rate went up to 13% and his home run rate more than doubled. He had a 5.14 FIP and 5.65 ERA the last four months of the season, leading to an overall replacement-level campaign. In the playoffs, he faced nine batters and retired just three of them. Read the rest of this entry »


MLB Payroll Probably Isn’t Going Back Up in 2019

In 2018, for the first time in more than a decade, player salaries went down from the previous year. At one point, there was some thought that this offseason’s free agent class might reverse the course charted last offseason. For years, we’ve been hearing about the monster class of free agents that would sign this winter. Here’s Jeff Passan back near the beginning of the 2017 season:

For those who have yet to hear about the free-agent class of 2018-19, here’s a sampling: Bryce HarperManny MachadoClayton KershawJosh Donaldson, Daniel Murphy, Dallas Keuchel, Charlie Blackmon, Andrew Miller, Zach Britton, Craig Kimbrel. There are dozens more. Teams will guarantee $3 billion to players that winter. The number could exceed $4 billion.

Two years later, that free agent class isn’t quite as good as we expected. When we put up our Top-50 free agents, along with crowdsourced contract expectations, the expected outlay to 66 potential free agents didn’t come close the $3 billion assumed; the crowd predicted a number that was just about half of $4 billion that was thought possible about 20 months ago. Our readers provided estimates for 66 players, including Joe Mauer and Adrian Beltre, who have since retired. Of the remaining 64 players, 36 have signed contracts so far. Here’s how the contract totals compare to the crowdsourced average.

Free Agent Signings and Contract Predictions
Name Signing Team Proj WAR Crowd Average Contract Total Difference
Patrick Corbin WSN 3.5 102.3 M 140 M 37.7 M
Nathan Eovaldi BOS 2.7 44.5 M 68 M 23.5 M
Andrew McCutchen PHI 2.9 43.1 M 50 M 6.9 M
Zach Britton NYY 1.1 31.8 M 39 M 7.2 M
J.A. Happ NYY 2.8 32.6 M 34 M 1.4 M
Michael Brantley HOU 2.4 42.2 M 32 M -10.2 M
Charlie Morton TBR 2.8 32 M 30 M -2 M
Jeurys Familia NYM 1.0 33 M 30 M -3 M
Lance Lynn TEX 1.6 27.3 M 30 M 2.7 M
Andrew Miller STL 1.3 26 M 25 M -1 M
Joe Kelly LAD 1.0 16.1 M 25 M 8.9 M
DJ LeMahieu NYY 2.0 41 M 24 M -17 M
Daniel Murphy COL 1.9 29.6 M 24 M -5.6 M
Josh Donaldson ATL 4.2 57.8 M 23 M -34.8 M
David Robertson PHI 1.4 26.3 M 23 M -3.3 M
Jed Lowrie NYM 2.1 26.8 M 20 M -6.8 M
Wilson Ramos NYM 2.2 35.6 M 19 M -16.6 M
Anibal Sanchez WSN 1.7 11.8 M 19 M 7.2 M
Yasmani Grandal MIL 3.2 51.6 M 18.3 M -33.3 M
Kelvin Herrera CHW 0.4 24.8 M 18 M -6.8 M
Hyun-Jin Ryu LAD 2.0 35.6 M 17.9 M -17.7 M
Garrett Richards SDP 0.0 17.4 M 15 M -2.4 M
Joakim Soria OAK 0.9 14.8 M 15 M 0.2 M
Nelson Cruz MIN 3.2 28.2 M 14.3 M -13.9 M
Matt Harvey LAA 1.0 14.7 M 11 M -3.7 M
Kurt Suzuki WSN 1.3 10.1 M 10 M -0.1 M
Brian Dozier WSN 2.2 31.9 M 9 M -22.9 M
Trevor Cahill LAA 1.3 14.5 M 9 M -5.5 M
CC Sabathia NYY 1.2 10.7 M 8 M -2.7 M
Ian Kinsler SDP 1.7 11.8 M 8 M -3.8 M
Jesse Chavez TEX 0.6 7.5 M 8 M 0.5 M
Trevor Rosenthal WSN 1.2 9.9 M 7 M -2.9 M
Steve Pearce BOS 1.2 10.5 M 6.3 M -4.2 M
Jonathan Lucroy LAA 1.9 10.4 M 3.4 M -7 M
Lonnie Chisenhall PIT 0.9 10.4 M 2.8 M -7.6 M
Brian McCann ATL 1.0 10.1 M 2 M -8.1 M
TOTAL $984.7 M $838 M -$146.7 M

So far, free agents have signed for roughly 15% less combined than predicted. It’s interesting to note that the discount is being taken almost entirely in the length of the contracts, as both the predicted and actual AAV are around $12 million. Now that many players have reached agreements to avoided arbitration and a good number of players have signed free agent deals, we can take a look at where teams’ Opening Day payrolls stand at this point in the offseason. There are obviously a few huge contracts to go, with five of the top six contract projections still unsigned, so these numbers are nowhere near final. As of this writing, here’s what Opening Day payrolls look like for every team.

The Red Sox are well out in front of everybody, just like they were last season. The Cubs payroll is up compared to where it was. It might be somewhat difficult, if not impossible, to tell how every team’s payroll has moved based on the graph above. For reference, here’s a graph showing each team’s change in payroll from Opening Day last season.

Some of this will change in the coming months, though a lot of those teams at the bottom aren’t really expected to move the needle much. Last year’s Opening Day payroll average came in at around $136 million. Keep in mind, these numbers don’t include benefits or players on the 40-man roster. Last year, the end-of-season payroll average including those numbers went up to around $152 million. Right now, the average 2019 Opening Day payroll comes in at close to $128 million. In total, the difference between last year’s combined Opening Day payrolls and payrolls right now is $243 million. If we take a look at how much spending is left to be done, we might be able to approximate payroll for next season.

Here are the remaining crowdsourced free agents, their projected total salaries and the average annual value of each deal.

Remaining Free Agent and Contract Predictions
Name Proj WAR Crowd Avg Years Crowd Avg Total ($M) Crowd AAV ($M)
Bryce Harper 4.9 9.1 $300.0 $33.0
Manny Machado 5 8.6 $272.9 $31.7
Dallas Keuchel 3.3 4.2 $81.0 $19.4
Craig Kimbrel 2.1 3.9 $62.2 $16.1
A.J. Pollock 3.1 3.7 $58.8 $16.0
Mike Moustakas 2.8 2.8 $34.3 $12.2
Adam Ottavino 0.8 2.6 $27.0 $10.3
Marwin Gonzalez 1.8 2.9 $29.5 $10.1
Jose Iglesias 1.7 2.8 $25.6 $9.1
Gio Gonzalez 0.8 2.3 $26.4 $11.6
Nick Markakis 1.1 1.9 $19.9 $10.8
Adam Jones 1.2 1.9 $18.7 $9.9
Asdrubal Cabrera 2 2.1 $20.4 $9.6
Cody Allen 0.5 2.3 $20.5 $9.0
Wade Miley 1.1 1.9 $15.9 $8.5
Josh Harrison 1.2 1.9 $14.5 $7.5
Freddy Galvis 0.3 2.1 $15.1 $7.2
Brad Brach 0.1 2.0 $15.0 $7.5
Justin Wilson 0.1 2.1 $12.2 $6.0
Martin Maldonado 1 1.8 $10.7 $5.9
Carlos Gonzalez 1.3 1.5 $10.9 $7.3
Ryan Madson 0.1 1.2 $6.9 $5.8
Clay Buchholz 1 1.4 $9.3 $6.6
Jeremy Hellickson 0.4 1.5 $9.2 $6.2
Greg Holland 0 1.3 $7.4 $5.8
Tony Sipp 0 1.2 $5.9 $4.8
Shawn Kelley 0 1.2 $5.4 $4.5
Zach Duke 0 1.2 $4.7 $3.9
TOTAL 73.3 $1140.3 M $296.1 M

If the crowd is correct and $296 million in salaries are added to the 2019 season, we’ll be looking at around a $50 million increase over last season. That probably won’t happen, though. Last season when I did this same exercise, I was overly generous in my estimates, giving the players the crowdsourced money, and adding in another $60 million for all the other players for whom we did collect estimates. By the time Opening Day rolled around, I was more than $100 million off, and instead of a potential 1% increase in payroll, teams moved down 1% from the previous year.

If the rest of this offseason is anything like the remainder of last offseason, we are going to be looking at flat Opening Day payrolls. Even more troublesome for the players is that while Opening Day payroll was down about one percent from 2017 to 2018, when the end of season numbers were calculated, that figure was closer to 2.5%. While not definitive yet, there seems to be a pretty good possibility that major league payrolls will go down for the second consecutive season.


The Specter of Jason Heyward’s Contract Looms Over Manny Machado

Three winters ago, Jason Heyward was a young free agent, a relative rarity as most players make their debuts at 23 years old or older, while many other young stars sign contract extensions prolonging the wait to hit the open market. Heyward debuted at just 20 years old on Opening Day back in 2010 and moved through the arbitration process to become a free agent heading into his age-26 season. There hadn’t been a free agent like Heyward — that young and that accomplished — in more than a decade. Three seasons later, Heyward has put up just four wins rather than the four wins per year that was expected. And now a very similar player in Manny Machado is hitting free agency, and might not be receiving the offers he expected.

While Manny Machado isn’t Jason Heyward, he’s not Bryce Harper either. Machado just put up his best offensive season with a 141 wRC+, while Harper’s season was almost viewed as a disappointment despite him hitting a very similar 135 wRC+. Harper derives nearly all of his value from his bat, while Machado is a more balanced player, getting value from his bat and his glove. In that way, he’s a remarkably similar player to Jason Heyward when the latter hit free agency.

Manny Machado and Jason Heyward Through Age-25
Name PA HR BB% K% ISO AVG OBP SLG wRC+ WAR
Manny Machado 4074 175 7.3 % 16.4 % .204 .282 .335 0.487 120 30.2
Jason Heyward 3429 97 10.8 % 18.5 % .163 .268 .353 0.431 118 25.2

Machado got a one-third season jump on Heyward to begin his career and has almost never been hurt, leading to roughly an extra season’s worth of playing time and a five-WAR lead. Heyward walked more, while Machado hit for more power. Heyward’s baserunning exceeded Machado’s, but his good defense at a more difficult position evened out that baserunning deficiency. When Heyward hit free agency, there were some (including me) who argued that Heyward’s contract floor in free agency should have been something like $160 million, with a reasonable value potentially above $300 million based on his comps at the time. Heyward is the most recent player to point to when it comes to long-term deals not working out, even when signed at a young age. Setting aside that Heyward was hurt almost immediately, that the Cubs changed a swing that worked in 2015, and that Heyward will now be on his third hitting coach in four years, what Heyward really should be is another data point among potential Manny Machado comps.

Earlier this month, I took a look at some comps for Bryce Harper mostly ignoring his MVP season. Near the end of the piece, I noted just how great Harper’s overall comps were.

There are so few players like Bryce Harper in baseball history that it is tough to find a lot of good comparisons. In the past 100 years, there have only been 16 players within five WAR of Harper and also within 20% of his plate appearances. Of those 15 other players, 11 are in the Hall of Fame. Manny Machado is another player on that list, with the others being Jim FregosiCesar Cedeno, and Vada Pinson. The 14 players averaged 37 WAR from age-26 through age-35, with eight of the 11 players who played since 1947 hitting that average.

The same exercise with Machado yields slightly different results due to a difference in plate appearance and Harper’s half a win higher WAR total. We end up with 16 total players, including Machado and Harper. We lose Johnny Bench and Tim Raines, but gain Adrian Beltre, so the number of Hall of Famers is pretty close. Also added to the list is Jason Heyward, but even if we include Heyward’s 4.1 WAR and assume he will not generate any wins over the next seven seasons, the average WAR produced from 26 years old through age 35 is 34.8 WAR. That’s easily $300 million contract territory, and with seven of the 11 players since integration going above that mark, there’s a reasonable chance of hitting that mark with Machado.

On the other hand, if we were to admit that the valuations on Heyward missed the mark from some reason or another — like too much of his value being tied into defense or perhaps that debuting young isn’t as important as we thought — we can take a different angle to get a better perspective on Machado. The last set of comps look at only total value, go very far back in history, and take into account up to seven nearly full seasons for some players. Let’s start by narrowing things down a bit. We’ll look at Machado’s last four years, when he put up a 128 wRC+ and 21.7 WAR from age 22 through his age-25 season. To find good comparable players, we’ll look at non-catching position players from 1973-2008 with at least two wins at 25 years old, a WAR between 18 and 26, a wRC+ between 118 and 138, a positive defensive value, and enough plate appearances to qualify for the batting title. Here are Machado’s comps.

Manny Machado Age-22 Through Age-25 Comps From 26-35
Name PA HR AVG OBP SLG wRC+ Off Def WAR
George Brett 5554 204 .316 .393 .535 148 317.4 14.9 53.7
Scott Rolen 5367 195 .284 .367 .492 124 172.9 131.4 47.6
Derek Jeter 6923 161 .317 .387 .456 125 247.2 -14.1 46.1
Chet Lemon 5059 151 .266 .352 .441 121 112.1 43.6 33.2
Cesar Cedeno 4007 78 .277 .342 .418 113 76.6 -41.2 17.5
Troy Glaus 3485 172 .255 .357 .485 120 81.6 -38.9 15.6
AVERAGE 5066 160 .286 .366 .471 125 168 16 35.6

Through 2008, six players have taken Manny Machado’s path at the same age. Two are Hall of Famers, and Scott Rolen should be a third. Even if we include more recent players who have yet to play through age-35, only Jose Ramirez and Ryan Zimmerman qualify and the latter drops the average by just a couple of wins. Machado is still pretty easily a $300 million value by this analysis assuming we start with a $9M/WAR evaluation. Now, let’s only use the last three seasons, where Machado put up 15.1 WAR and a 125 wRC+. Using similar PA, defense, and age-25 restrictions, with WAR between 12 and 18, and a wRC+ between 115 and 135 yields the following comps at age 26 through 35 years old.

Manny Machado Age-23 Through Age-25 Comps From 26-35
Name PA HR AVG OBP SLG wRC+ Off Def WAR
Chipper Jones 6165 312 .312 .413 .565 150 401 -33 55.3
Scott Rolen 5367 195 .284 .367 .492 124 173 131 47.6
Derek Jeter 6923 161 .317 .387 .456 125 247 -14 46.1
Andre Dawson 5839 260 .285 .332 .502 125 180 7 39.6
Ryne Sandberg 5416 185 .290 .353 .465 122 148 42 38.5
Robin Ventura 5405 223 .267 .363 .465 113 85 114 37.4
Willie Randolph 5500 32 .273 .368 .343 106 43 87 31.8
Eric Chavez 3217 123 .260 .339 .451 108 30 29 16.6
Troy Glaus 3485 172 .255 .357 .485 120 82 -39 15.6
Edgardo Alfonzo 3390 84 .280 .357 .422 106 31 7 14.4
Lloyd Moseby 3237 88 .251 .333 .405 103 25 -42 9.3
AVERAGE 4904 167 .279 .361 .459 118 131 26 32

Another very good group here, but it’s worth noting that Glaus, Chavez, and Moseby all posted WAR totals at age-25 at least two wins lower than Machado last year, so restricting this group further would yield a number even higher than the previous group. It is also worth noting that Jason Heyward, Dustin Pedroia, Nolan Arenado, and Ryan Zimmerman are all recent comps. Pedroia has been worth 33 wins over the past 9 years with Zimmerman worth around 14 over the past eight seasons, and including those two players only drops the average WAR by about one win. Arenado has already put up 11 wins in two seasons, we’ve discussed Heyward, and in the unlikely event that none of the four active players produce anything else, the group average still sits at around 28 wins. We are dealing with a very accomplished group whose average production would be worth well over $300 million over the next 10 years.

When we drop down to just the last two years of Machado, we should see the most pedestrian group given Machado’s lackluster 2017 season. Over the last two seasons, Machado has a 122 wRC+ with 8.8 WAR, so we’ll look at players between 112 and 132 wRC+ with between 7 and 11 wins, leaving the other parameters the same.

Manny Machado Age-24 Through Age-25 Comps From 26-35
Name PA HR AVG OBP SLG wRC+ Off Def WAR
Carlos Beltran 5748 252 .282 .368 .509 129 265.8 21.6 47.2
Alan Trammell 5279 132 .293 .359 .445 121 138 125.5 44.8
Andre Dawson 5839 260 .285 .332 .502 125 180 7.4 39.6
Dave Winfield 6301 256 .290 .359 .496 136 263.7 -112.4 37.6
Matt Williams 5155 261 .278 .327 .503 112 79 76 31.9
Dwayne Murphy 3989 142 .241 .348 .410 116 73 42.7 25.4
Dusty Baker 5407 166 .279 .346 .432 119 114.5 -62.1 24
Coco Crisp 4345 82 .260 .327 .393 96 31.8 20.9 20.3
Eric Chavez 3217 123 .260 .339 .451 108 29.5 29.3 16.6
Raul Mondesi 4571 201 .264 .330 .478 109 61.5 -49 16
Edgardo Alfonzo 3390 84 .280 .357 .422 106 30.5 6.7 14.4
Roberto Kelly 3915 98 .290 .338 .436 105 29.6 -68.5 9.5
Lloyd Moseby 3237 88 .251 .333 .405 103 25.1 -41.7 9.3
AVERAGE 4646 165 .273 .343 .452 114 101.7 -0.3 25.9

As we might expect given Machado’s 2017, this is the most disappointing group we’ve seen. It’s also still a group that might produce an average outcome in the $275 million range. There are three Hall of Famers up there with Beltran having a chance at four. The same caveats as above regarding Moseby and Chavez apply here, as well. Among active players, we still have Pedroia, Heyward, and Arenado, though we add Kyle Seager, who has averaged around four wins per season over the last five years despite a disappointing 2018 campaign. We also add Christian Yelich, who has just one season beyond 25 years old, but won the NL MVP with a 7.6 WAR year. Javier Baez and Xander Bogaerts also qualify, but are the same age as Machado.

If we only had Machado’s 2018 season as a comparison, this is what that group looks like:

Manny Machado Age-25 Comps From 26-35
Name PA HR AVG OBP SLG wRC+ Off Def WAR
Larry Walker 5127 277 .331 .416 .613 147 323 6 48.6
Alan Trammell 5279 132 .293 .359 .445 121 138 126 44.8
Bobby Grich 5209 158 .271 .375 .438 132 185 51 42.7
Andre Dawson 5839 260 .285 .332 .502 125 180 7 39.6
Ryne Sandberg 5416 185 .290 .353 .465 122 148 42 38.5
Tim Raines 5808 107 .294 .385 .429 125 221 -53 36.8
Willie Randolph 5500 32 .273 .368 .343 106 43 87 31.8
Jesse Barfield 3456 153 .250 .336 .456 115 58 71 24.7
David Wright 3824 112 .286 .366 .458 128 127 -16 24.1
Marcus Giles 2190 38 .273 .348 .405 100 12 8 9.2
AVERAGE 4765 145 .285 .364 .455 122 143 33 34.1

These are the wildest results we’ve seen with a bad Marcus Giles, a good but injury shortened run from David Wright, a decent run from Jesse Barfield, and then near-Hall of Fame or better runs from the seven remaining players. Of the more recent players, Evan Longoria, Ryan Zimmerman, Hanley Ramirez, Kris Bryant and Matt Chapman also fit the bill. Even including the first three more recent players doesn’t drop the average below 30. Of note, Jason Heyward is not a comp in the last group, as Machado’s 141 wRC+ was significantly higher than Heyward’s age-25 season and at least 20 points higher than every season Heyward has put up since the right fielder’s 134 wRC+ in his 2010 rookie campaign.

Jason Heyward might show some similarities to Manny Machado, but that contract and the results the last three seasons shouldn’t scare people away from Manny Machado. Heyward is still young enough that he could turn his contract around, but that also shouldn’t matter for Machado. The current free agent has better comps than Heyward and is coming off a much better season. Even with similar comps, Heyward is still just one data point among multiple Hall of Famers. Players who hit like Machado, play solid defense, and perform well in their early to mid-20s tend to keep doing so. The same should be expected of Machado, as well.


Yankees Go a Different Route on the Infield

The Yankees signed a free agent infielder. He’s been an All-Star and has won Gold Gloves, and there are considerable differences of opinion over how much he might be worth, but the Yankees found the player for whom it was worth going over the competitive balance tax threshold. That player is not Manny Machado. Signing DJ LeMahieu will cost the Yankees $24 million. Not per season, but total over the next two years, per Jack Curry and Ken Rosenthal.

The Yankees’ infield is an intriguing one. With shortstop Didi Gregorius set to miss some of next season, the team signed Troy Tulowitzki to play shortstop. Tulowitzki has barely played the last two seasons and at 34 years old, it isn’t clear he has much left, but with Gregorius coming back at some point and Gleyber Torres able to play short, the team didn’t necessarily need Tulowitzki to earn a starting role. The club still has Miguel Andujar penciled in at third base with some hope that he will improve his defense, while over at first base, the team has late-season wonder Luke Voit and perpetually hurt Greg Bird.

The logic for adding Manny Machado was pretty sound. Beyond his obvious talent at the plate, the Yankees had a potential hole at shortstop and a long term opening there after next season. This year, Machado could have played third base, with Andujar moving to first base, designated hitter, or another team. That would leave Torres at second base, and first base as is. It would also likely provide the team a five-win upgrade over its present situation. As to how things will fit with LeMahieu, Jack Curry provides some insight.

LeMahieu has started 882 games in the field in his career and 857 of those have come at second base. He’s started 24 games at third base, the last one coming in 2014, and he also started one game at first base for the Cubs during the 2011 campaign. It would seem that this signing is an insurance policy of sorts for the shortstop situation. If Torres needs to move to short, the organization doesn’t have anyone capable of playing at an average level at that spot. If Andujar completely bombs out on defense at third base, the team could move LeMahieu or Torres there and hope to get decent play. Of course, LeMahieu is a very good defensive second baseman, and it would be odd to move him from that spot given how well he fits there.

There’s also the question of LeMahieu’s bat. The now-former Rockies’ second baseman has played essentially six full seasons in the majors and been above-average offensively in exactly one of them. In 2016, Leamhieu posted a double-digit walk rate, a strikeout rate of just 13%, an ISO of .147 and a sky-high .388 BABIP on his way to a 130 wRC+. The last two seasons, his walk rate has dropped to 8%, his strikeout rate increased slightly to 14%, his ISO has been .123, his BABIP .326, and his wRC+ has been 10% below league-average. Combined with solid defense, this has made him a roughly average player. Jeff Sullivan noted that LeMahieu does have some hidden upside as a player who hits the ball hard and makes a lot of contact, and used the graph below to illustrate those two skills, with LeMahieu’s spot highlighted.

If LeMahieu could take that hard contact and put it in the air more often, he might hit for more power and have better overall numbers. As Sullivan (along with Travis Sawchik) noted, there might have been some attempts by LeMahieu to achieve a change. In 2018, he posted a GB/FB rate below 2.0 for the first time in his career, while his 30% pull-rate was a career-high. It likely helped cause his career-high .152 ISO. If that power came at the expense of hits — LeMahieu had a career low .298 BABIP, as well as fewer walks, with just a 6% walk rate — it isn’t clear the trade-off has helped yet.

The problem for LeMahieu is that he just hasn’t been able to translate his hard ground balls into hard fly balls. On ground balls last season, LeMahieu put up an average exit velocity of 89.6 MPH, well above the 84.5 mph league average and in the top 10% in all of baseball. On fly balls, LeMahieu put up an average exit velocity of 91.3 mph, which is harder than his grounders, but below the league average of 91.6 mph last year. His exit velocity ranks so highly overall because he hits balls on the ground very hard, which is generally what allows him to post high BABIPs and come close to a league-average player. This is what his spray chart looked like last year.

That’s a lot base hits from a player who can’t be effectively shifted against. LeMahieu might have some untapped power, but he hasn’t yet been able to get to it. At 30 years old, he probably isn’t getting any better than the useful player we see right now. In any event, the Yankees aren’t bringing LeMahieu in for his untapped power. They are bringing him in to raise the team’s floor should their other infield options fail to work out, and to add a solid glove with good contact ability.

In a world where LeMahieu was one of very limited options, the move would make sense, albeit not all that much sense if LeMahieu is a utility player. We don’t live in that world, though. We live in a world where Manny Machado exists, wants to play in New York, and doesn’t seem to have a whole lot of bidders for his services. By signing LeMahieu, the Yankees are essentially committed to going over the competitive balance tax next season. The last time the Yankees passed on a $200-plus million infielder who really wanted to play for the Yankees, the team missed the playoffs in two of the next three seasons and didn’t play in a playoff series during that time. Robinson Cano averaged five wins per season over those three years in Seattle, as the Yankees opted to spend their money on Jacoby Ellsbury, Brian McCann, and Carlos Beltran. The Yankees should be better the next three seasons than they were from 2014 to 2016, and D.J. LeMahieu should help them, but it’s easy to see how the Yankees might end up regretting passing on a 26-year-old star so they can save a little money. Unless they still sign Machado, in which case the last paragraph is moot.


Nationals Gain Upside with Brian Dozier

While much of the focus of the Nationals’ offseason has been the potential loss of Bryce Harper, the club has been one of the more active teams this winter. Their big move brought in Patrick Corbin. They also signed Anibal Sanchez and traded Tanner Roark. They fixed their biggest hole last season by trading for Yan Gomes and signing Kurt Suzuki to play catcher. They also added Kyle Barraclough and Trevor Rosenthal to improve their bullpen depth. With all of those moves, the Nationals were already going to have the best team in the division on paper, no matter who the Phillies signed. Despite that apparent lead, having missed the playoffs a year ago, the club filled it’s last obvious weakness by signing Brian Dozier to a one-year deal worth $9 million, per Jeff Passan.

While there are obvious concerns over the slow offseason and declining salaries, Dozier’s seemingly low contract is more a victim of circumstance than a league-wide issue. There have been a lot of second basemen available this winter, and not as many contending teams with holes. Add in Dozier’s disastrous 2018 season, particularly toward the end, and his market was going to be limited. The Rockies signed Daniel Murphy, and even if he plays first base, that seemingly puts Ryan McMahon at second. The Padres added Ian Kinsler as a stopgap. The Twins signed Jonathan Schoop. The A’s traded for Jurickson Profar. The Mets didn’t even really need a second baseman and they traded for Robinson Cano.

That just leaves a smattering of contending teams in the bottom half of our second base depth charts. The Angels don’t need to work too hard to justify giving David Fletcher a shot. Cleveland’s going to go with Jason Kipnis in the last year of his deal. That really just leaves the Rockies, who could go with McMahon, the Nationals, and the Brewers. The list of available second baseman along with Dozier includes DJ LeMahieu and Jed Lowrie, as well as Asdrubal Cabrera, and Josh Harrison. Utilityman Marwin Gonzalez can play some second base as well. That’s before we get to a trade market that might include Joe Panik, Whit Merrifield, and Jedd Gyorko. In our Top 50 Free Agent list, Kiley McDaniel correctly pegged Dozier for the one-year, $9 million deal he is receiving, though the crowd was a bit more optimistic, believing a multi-year deal worth more than $30 million would be possible. This is what Eric Longenhagen had to say about Dozier in that piece.

He didn’t miss any time due to the injury (and has still never been on the DL), but Dozier has acknowledged to the media that a right knee bone bruise — and the manner in which he compensated for it, mechanically — impacted his 2018 production. Dozier had the worst full big-league season of his career, slashing .215/.305/.391 and playing sluggish defense. The league-average line at second base in 2018 was just .254/.317/.395, so if there’s any dead-cat bounce in Dozier at all, he’s probably still an average regular going forward. Obviously, though, a return close to what he has shown for the last four years means he has a chance to be an All Star.

Dozier has also had minor back issues over the years, which has been known to sap some strength. Dozier’s reliance on homers means any decrease in power is going to stunt his overall production. As for what went wrong last year, Paul Sporer noted that Dozier’s plate discipline numbers were mostly unchanged, but Dozier’s home run to fly ball rate went way down. One thing slightly unusual about Dozier’s plate discipline numbers is that Dozier swung at fewer pitches out of the zone, yet his walk rate didn’t go up. He did make more contact on pitches out of the zone, and those pitches tend to elicit weaker contact, so it is possible his numbers were hurt a little by a small adjustment to not swing for the fences as much. His expected BABIP based on launch angle and exit velocity was about 20 points higher, but any contact on pitches out of the strike zone or batted-ball luck were relatively small issues compared to his lack of thump.

A quick look at his Statcast numbers on fly balls over the past two seasons shows the following:

Brian Dozier’s Fly Balls
Exit Velocity Launch Angle Distance
2017 95 MPH 37.3 335 ft.
2018 92 MPH 38.4 324 ft.

There’s not some big secret to explore here. Dozier just didn’t hit the ball as hard last season, so his fly balls didn’t go as far, and therefore Dozier’s home runs and ISO came down significantly. If we can chalk Dozier’s issues up to injuries that might resolve with an offseason of care and training, then Dozier is going to be a huge bargain for the Nationals. If any lingering issues follow him into next season, it’s possible we are just looking at the decline of a player in his 30s who has been selling out for pull power, which isn’t working as well anymore. Jeff Sullivan noted towards the end of 2017 that Dozier was going to the opposite field more often, and he made the natural assumption that this was an approach-based change to get better. However, Sullivan wasn’t quite sure the change was necessary. With another year in the books and similar spray charts in 2017 and 2018, it’s possible we are seeing a hitter who isn’t capable of pulling the ball as much rather than one choosing to be successful going the other way.

We don’t know which version of Dozier is going to show up next season. If he repeats his 2018, the Nationals should still have enough firepower to win the division. If he recovers some of his old form, he could help Washington be the best team in baseball. The Nationals won’t have to pay much for the opportunity to find out. The floor for players like LeMahieu and Lowrie is considerably higher than Dozier, but the former Twin is just one season removed a five-win campaign. He’ll get the opportunity to put last year behind him in a lineup that shouldn’t need his production. If he plays well, he could be in line for a much bigger contract a year from now.


A’s Revenue Sharing Money Heads Back to the Yankees

A lot of time and words are spent here and elsewhere on the split of baseball revenue between players and owners; we spend less time comparing revenue between franchises. Sure, we make distinctions between small-market teams and large-market teams, putting the Yankees and Red Sox in one corner and Cleveland, Kansas City, and Pittsburgh in another. But we don’t spend a lot of time talking about what that actually means. There are a few good reasons for that. One is that we don’t have access to much of the data that would make meaningful analysis possible. But I suspect the main reason is probably that fights between billionaires who don’t take the field aren’t that interesting to a lot of fans. Add in rising revenues and $50 million windfalls from MLBAM, and for some, exactly how much money owners have isn’t all that important when we just know that they have a lot.

Many fans don’t even care about the fight between millionaires and billionaires. That’s their prerogative, but it’s important to consider these things carefully. The latest CBA wasn’t just a loser for the players for the obvious reasons, those were multiple: a competitive balance tax that barely increased, tax penalties that get progressively worse, small minimum salary increases, no universal designated hitter, only minor changes to free agent compensation, no concessions when it comes arbitration, no additional roster spots, hard international spending limits, and no help at all for the minor leaguers. The CBA also hurt the players when it comes to revenue sharing.

Wendy Thurm’s post from 2012 does a good job explaining the system under the old CBA and it is worth revisiting, but in sum: Teams took 34% of their net local revenue (local revenue minus stadium expenses), pooled it together, and divvied it up equally among all the teams. This was the base plan, and as is probably obvious, teams like the Yankees paid more into the pool than they received as part of it. There was also a supplemental plan. A pool of 14% of total net local revenue is created, with revenue taken from big-market teams like the Yankees and Red Sox and given to small-market teams like Pittsburgh and Tampa Bay. The supplemental plan worked to take a greater percentage away from high-revenue teams like the Yankees, and give it in higher percentages to the small-market teams.

Here’a a hypothetical under the old system.

  • Total Local Net Revenue is $3 billion, averaging $100 million per team.
  • Yankees Local Net Revenue is $400 million
  • A’s Local Net Revenue is $50 million

Under the old system, 34% of the *total* local net revenue is $34 million per team. For the Yankees, 34% of their local net revenue is $136 million; they end up making a net payment to the pool of $102 million once their distribution is taken into account, bringing other clubs up to $34 million. For the A’s, 34% of local net revenue is around $17 million; they end up receiving around $17 million in revenue sharing from the pool. Under the supplemental plan, 14% of $3 billion is $420 million. The Yankees pay about a quarter of that total with the Red Sox, Dodgers, Cubs, and Mets paying another 50%, so the Yankees put another $105 million in the pool. The A’s receive around 8% of the supplemental pool, so they get another $34 million to up their total to around $51 million. The Yankees end up with $193 million in net local revenue minus revenue sharing and the A’s end up with $101 million in net local revenue plus revenue sharing. These numbers are meant to be illustrative and provide a rough example of how revenue sharing worked.

The current CBA is much simpler, with a single 48% pool divided equally so that the same percentage of revenue is shared, but it is distributed differently. It takes less money away from the richest teams by eliminating the supplemental pool. In the example above, every team gets $48 million from the pool. The Yankees 48% figure comes to $192 million, so that they pay in $144 million. The A’s 48% figure is $24 million, so they receive $24 million. In this scenario, the Yankees get to keep a lot more of their money and the A’s get less. While we don’t know what the actual numbers are, the A’s did receive more than $30 million in 2015 and 2016, and at one time expected their 2019 payment to be greater than $40 million. The A’s won’t be getting that $40 million, however, as they will receive just a fraction of that amount. Most of that $40 million will stay with the Yankees, Cubs, Red Sox, and Dodgers.

In the last CBA, which went from 2012-2016, MLB phased in restrictions on teams receiving revenue sharing payments. All teams started on equal footing, able to receive revenue sharing based solely on their local net revenue numbers. (The Marlins were treated slightly differently, essentially unable to collect in 2012 after refusing to spend any money prior to 2012, resulting in a threatened grievance by the players.) The CBA phased in restrictions so that larger-market teams could only collect a portion of the revenue sharing owed to them, and by the time the new CBA rolled around, none of the large-market teams were allowed to collect revenue sharing money if their revenue was low except for the A’s, who despite their famously spendthrift ways and decaying ballpark, signed a billion dollar local TV deal in 2009. They’re low-revenue due to their stadium issues, but not quite small-market. The A’s were given an exception under the previous CBA, so that the restrictions didn’t apply until the team got a new ballpark. The new CBA removed those restrictions and began phasing in reduced revenue sharing payments for the A’s. Per the CBA:

Notwithstanding the foregoing, the revenue sharing disqualification of the Oakland Athletics shall be phased in as follows: 25% disqualified in the 2017 Revenue Sharing Year; 50% disqualified in the 2018 Revenue Sharing Year; 75% disqualified in the 2019 Revenue Sharing Year; and fully disqualified in the 2020 and 2021 Revenue Sharing Years.

This means that if, for example, the A’s had received $40 million in revenue sharing in 2016, they would only have received $30 million in 2017, then $20 million last year, $10 million this year, and then would get nothing in 2020 and 2021. So who gets the A’s money? The teams paying into revenue sharing receive it, but there’s a catch: teams get more money if they don’t go over the competitive balance tax.

Let’s say the Yankees pay about 20% of the money in revenue sharing that goes to other teams. That means that for next season, they will receive $6 million more dollars than they would have because the A’s can’t receive revenue sharing. The Dodgers will get something less than that. The Cubs, too. The Red Sox will receive 75% of their potential share because they will have gone over the tax threshold two years in a row next season. In 2020 and 2021, the clubs stand to gain even more money. Even If the Yankees go above the tax threshold the next two seasons, they might end up holding on to around $15 million that would have gone to the A’s in the previous CBA. That money might make its way to players, but given the incentives here and the teams publicly stated desires to stay under the threshold, there’s cause to be skeptical.

The amounts we are dealing with aren’t huge sums, but they are an added benefit to keeping spending low despite having to pay significantly less in revenue sharing. These aren’t speculative amounts if some big market team have lower revenues. We know where Oakland will be the next few years. And it isn’t just Oakland that ends up with less money, though they certainly bear the brunt of the losses. All of the lowest-revenue, smaller-market teams are likely receiving less money from revenue sharing than they used to under prior CBAs. It’s not an excuse for Cleveland to cut payroll given the increases in national television money, but it is likely that the have-mores are taking a bigger piece of the revenue pie than the have-a-decent-amounts.

Ahead of the last round of CBA negotiations, I thought there would be a fight among the owners over revenue sharing. Likely because the players didn’t demand enough concessions, that fight never took place. Small-market teams were willing to take less revenue sharing because negotiations with the players were too easy, and national revenues from television deals and money from MLBAM were good enough at the time. It’s not a big part of the player loss in the last CBA, but it doesn’t help when the teams with more money refuse to spend it. Revenue sharing might not seem like an important issue for the players, but spreading money around might have yielded a bit more spending at the bottom of the league.


The Missing Free Agents

This year’s free agent class was supposed to be historic, but with Clayton Kershaw pitching only really well, Josh Donaldson and Andrew Miller hurt, David Price and Jason Heyward not performing well enough to opt out of their deals, and Matt Harvey taking a nosedive, this class only turned out to be pretty good. Manny Machado and Bryce Harper are two superstars hitting free agency in their mid-20s. Having one of the two would make for a great headliner; signing both would provide multiple teams with the opportunity to transform their franchise. After those two, we’ve seen starting pitchers do pretty well so far, and a bunch of relievers sign solid deals, but the talk of a slow offseason has returned.

Some of last winter’s slowness was mitigated by star players receiving contracts close to expectations. Yu Darvish, Eric Hosmer, J.D. Martinez, and Lorenzo Cain all signed deals that seemed fair as spring approached. Jake Arrieta didn’t come that far off when we consider his opt-out. Machado and Harper are still likely to sign very big contracts, while some in the middle might end up getting squeezed. But with this free agent class the supposed justification for teams saving their money on the heels of MLB payrolls going down despite soaring revenues, another slow winter is cause for concern for the players.

In examining the slow market, Ken Rosenthal recently called the system broken and floated some differing perspectives on the causes, effects, and solutions. One paragraph, in particular, caught my eye. Read the rest of this entry »


White Sox Sign Kelvin Herrera as Relief Market Shrinks

The White Sox have made a series of minor moves this offseason to prepare themselves for contention at some point in the future; that might be as soon as next year, but it’s more likely in 2020 or later. The team added Ivan Nova from the Pirates to provide innings in the rotation. They added Alex Colome from the Mariners to help the pen. Chicago acquired Yonder Alonso from Cleveland to improve the offense and let Jose Abreu spend more time at designated hitter. If there was a $7 million to $10 million unwanted player, the White Sox have seemed willing to take on the salary in exchange for a fringe prospect. That strategy took on a different form today, as the team snapped up free agent reliever Kelvin Herrera on a two-year, $18 million deal with a vesting option, per Jeff Passan.

Herrera, not unlike many relievers, has had an inconsistent career. In 2012, 2014, and 2016, he put together very good seasons, with a sub-3.00 FIP and at least one win above replacement. In 2013 and 2015, he was closer to average. In 2017, when he took on closer duties in Kansas City, he just wasn’t very good. Last season, he put together a very good first half, which prompted Kansas City to trade him to Washington at just the right time. In DC, Herrera pitched poorly, and was sidelined with a rotator cuff injury and then a foot problem that ended his season. He’s missed time due to right arm injuries in 2014, 2017, and last year, also not uncommon for a reliever throwing in the high-90s. This is what his velocity looks like by season.

Velocity isn’t everything, and at 29 years old, Herrera is still young, but the drop is concerning. Here’s a similar graph showing his strikeout and walk rates.

Herrera’s walk rate has always been fine aided by a career 60% first strike rate, including 67% last year. It is interesting that his strikeout rate doesn’t necessarily correlate with his fastball velocity. He wasn’t striking out a lot of batters in 2014 and 2015, when he still had great velocity, and then when his velocity first dipped in 2016, he struck out batters at the highest rate of his career. In ranking the Top 50 free agents this offseason, Kiley McDaniel put Herrera 49th overall and 10th among relievers. McDaniel pegged Herrera for a one-year deal at nine million dollars, roughly half the guarantee he ended up receiving. Dan Szymborski wrote Herrera’s report in that post and came to a similar conclusion. Read the rest of this entry »