The 2025 Playoff Odds Are Here!
The playoff odds and projected standings for the 2025 season are now available!
As a refresher, to generate our playoff odds, we take each team’s projected performance and the schedule, and use those inputs to simulate the remaining season 20,000 times. We aggregate these outcomes to find the probability of a team winning its division or a Wild Card spot, along with its chances of winning the World Series and various playoff rounds. If a team has a 90% chance of making the playoffs, it means that 18,000 out of the 20,000 simulated seasons end with the team playing in October.
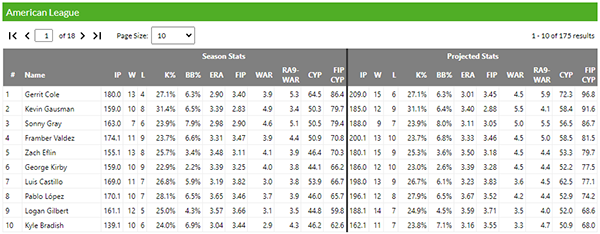
To calculate each team’s initial projected performance, we use individual player projections from the FanGraphs Depth Charts, which are a 50/50 blend of ZiPS and Steamer, prorated to our RosterResource Depth Chart playing time. We then aggregate those individual player projections by team and apply the BaseRuns calculation to each team’s batters and pitchers to get projected runs scored and allowed. Those BaseRuns runs scored and allowed calculations are used to calculate a projected winning percentage using the Pythagorean win expectancy. This is the number you’ll see on our projected standings page, which amounts to a team’s projected winning percentage versus neutral opposition. Here I’ll remind everyone that this is calculated before being run through the season simulation 20,000 times, so the projected standings can, and often do, differ from what you’ll see on the playoff odds page. Read the rest of this entry »