Daily Graphing – Esteban Loaiza
Yesterday, free agent Esteban Loaiza was signed by the Oakland Athletics to a 3 year deal worth slightly over 21 million dollars. Esteban Loaiza has been quite the enigma the past three years. After being consistently average for the first 8 years of his career, he shocked everyone in 2003 by winning 21 games with a 2.90 ERA and finished second in the AL Cy Young balloting. Then in 2004 he had one of the worst seasons of his career by posting a 5.71 ERA. Last year, determined to prove that his 2003 season was not entirely a fluke, he went 12-10 with an ERA of 3.77. Don't let that 12-10 record fool you either. He had 24 quality starts, the 6th best in the majors and some very poor run support. So, the big question is, who is the real Esteban Loaiza?
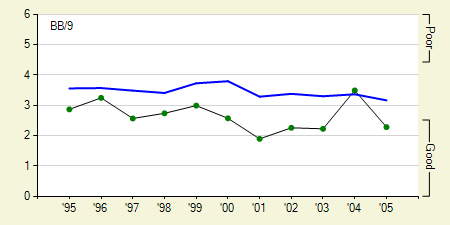
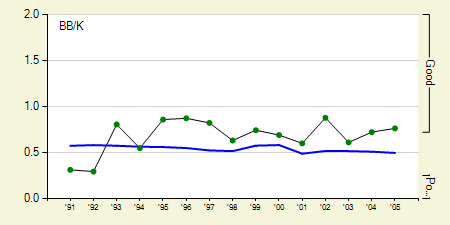
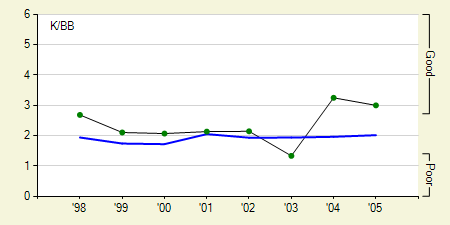
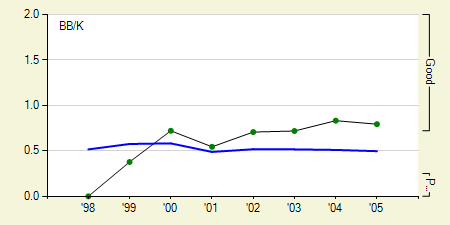
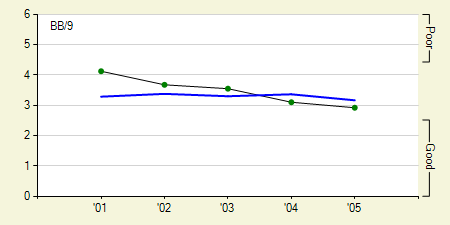
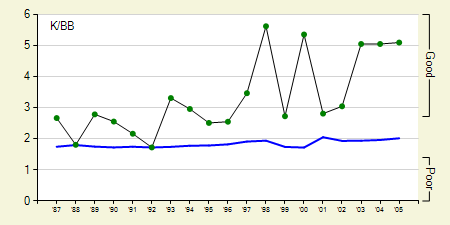
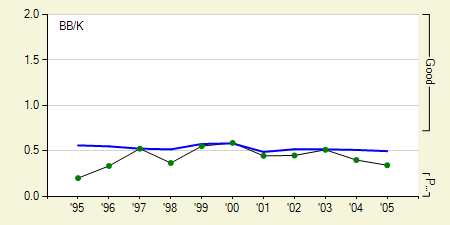
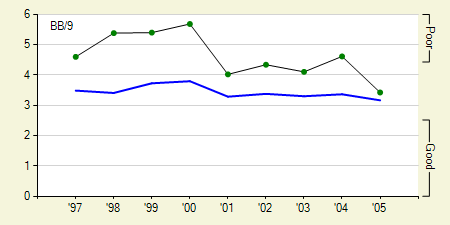
He's certainly not someone who walks a lot of batters. As you can see he's done a very good job limiting free bases over the course of his career. The one exception was 2004 and most of his trouble came after he was traded to the Yankees. Before being traded to the Yankees he had a walks per 9 innings (BB/9) of 2.9. With the Yankees it jumped to an abysmal 5.5 BB/9. I think it's safe to say that was a fluke. Since he has his walks under control, strikeouts will be one of the major keys to his success.
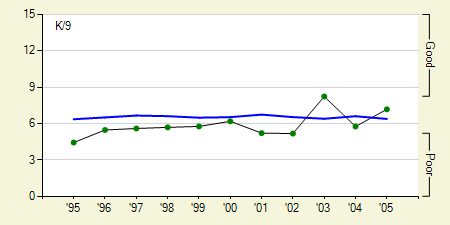
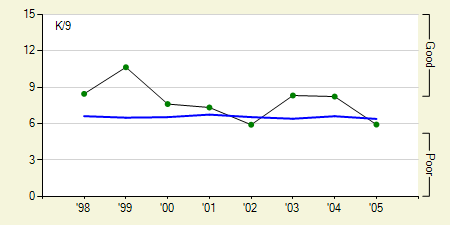
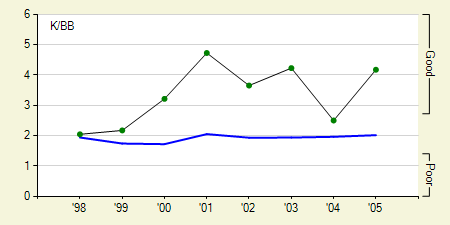
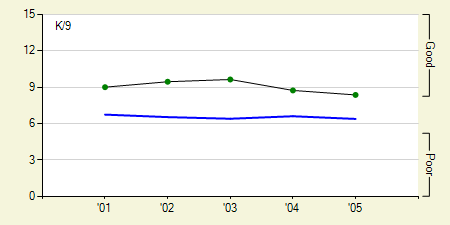
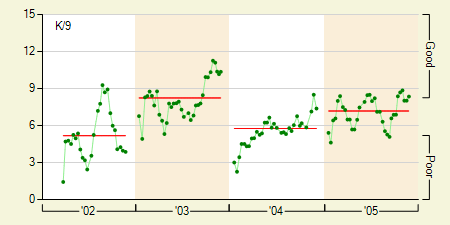
As you can see, in 2003 his strikeouts per 9 innings (K/9) took a major jump mostly due to an improved cut fastball and changeup. In 2004 in dropped back down to his career levels and then in 2005 it was up again. What the graph above doesn't show you is that in 2004 his K/9 was creeping back up to 2003 levels the entire year. In the first half of 2004 his K/9 was 5.1 where in the second half it was 6.9.
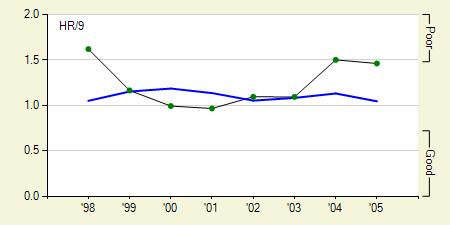
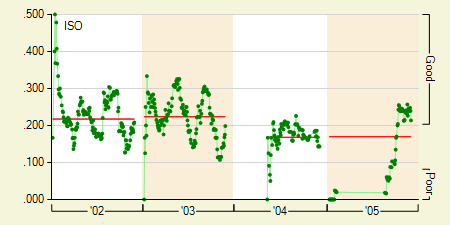
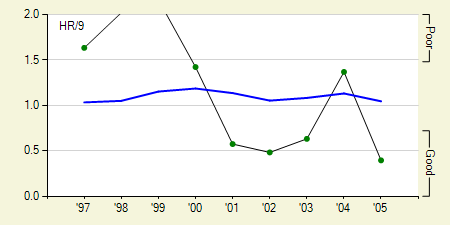
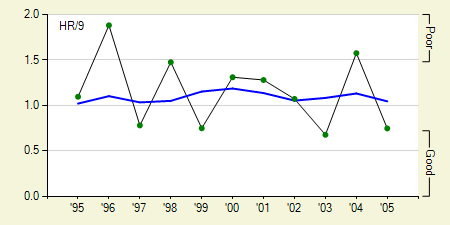
The other key to his success in 2003 and 2005 was limiting the number of home runs he allowed. He's actually been all over the map in home runs per 9 innings (HR/9) and I wouldn't be too surprised if he allowed more home runs next year.
I think Esteban Loaiza is one of these overvalued/undervalued players where some people can't get past his 8 years of mediocrity and others are still hung up on his 21 win season. I have to admit, I've been on the mediocrity side for quite some time, but as long as he doesn't allow too many home runs I think he'll be a quality pitcher. He's never had a problem with walks and it looks like his increased strikeouts are for real.