Daily Graphing – David Wells
Apparently the Padres are interested in re-acquiring David Wells from the Red Sox. Over the past four years David Wells is tied for the 8th most wins in baseball with a record of 61-29. Over that same time period, he has had the most run support of any player in baseball with 605 runs, a whopping 4.94 runs per start. What I'm trying to infer is that he's been the benefit of some pretty gaudy run support and maybe he hasn't pitched quite as well as his record indicates.
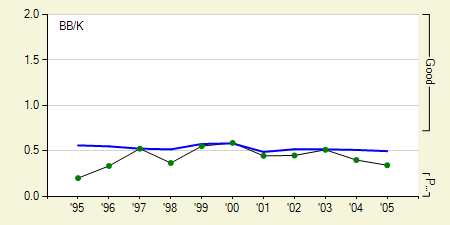
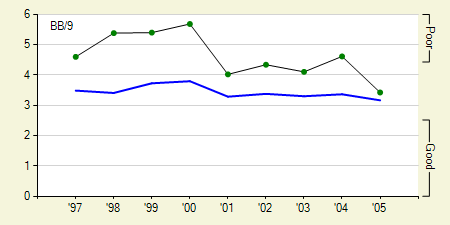
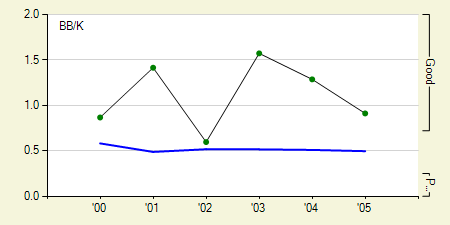
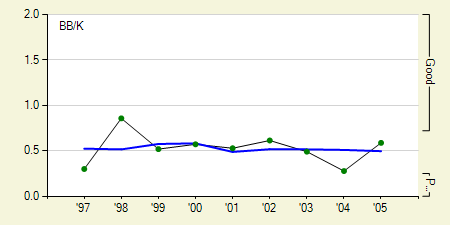
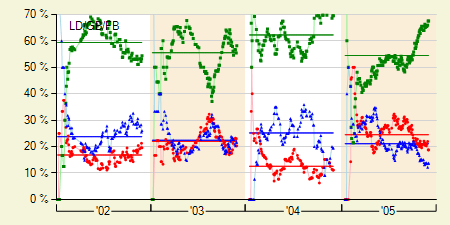
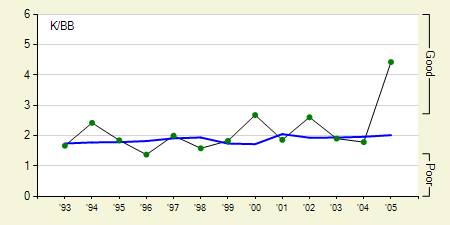
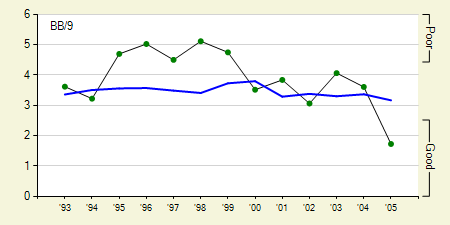
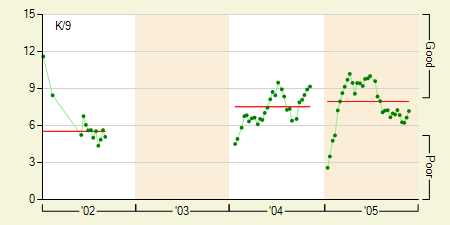
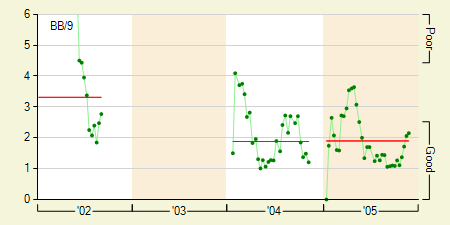
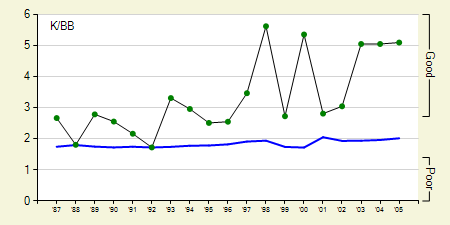
You certainly can't accuse David Wells of giving up many free passes. Over the past three years he's walked 61 batters in 91 starts. He only struck out 5.2 batters per 9 innings last year, but when you're walking only 1 batter every 9 innings, you can live with a lower strikeout rate. As you can see in the graph below, his strikeout to walk ratio (K/BB) is extremely high.
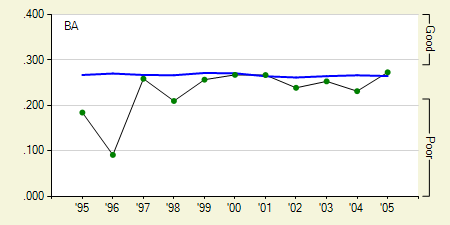
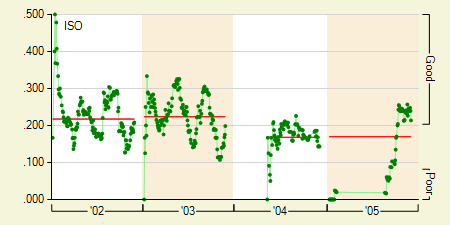
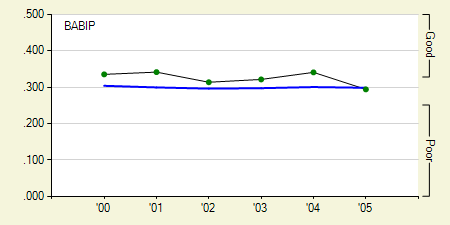
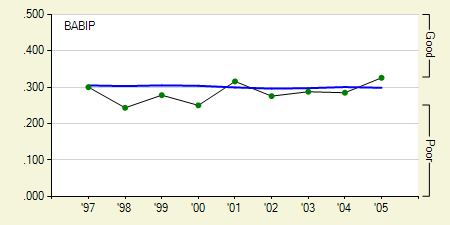
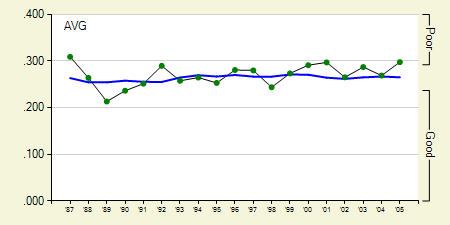
David Wells will be 43 years old next season, which is getting up there for a baseball player. It's hard to pinpoint any specific areas of decline on his graphs, but if I had to point to one thing it would be his opponent's batting average (AVG). It looks like he might be starting to become a more hittable than he used to be. This worries me for a pitcher that relies on keeping the ball in the strike zone.
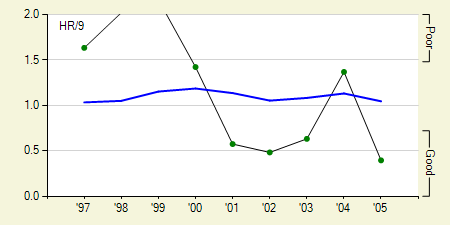
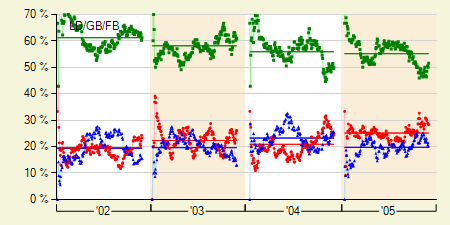
While David Wells may be exceptional at limiting walks, he's pretty average at everything else. A move to PETCO Park would certainly help him give up less home runs, but I doubt we'll see another 15 win season from him next year.