Daily Graphing – Paul Byrd
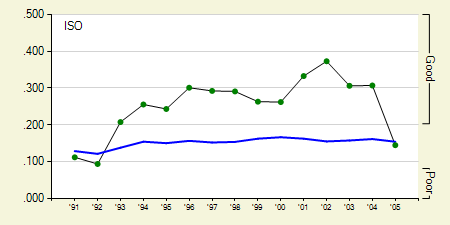
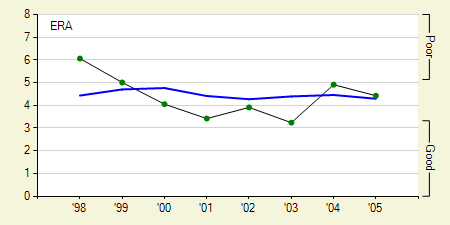
Paul Byrd and the Indians have agreed on a 2 year contract worth slightly over 14 million dollars with an 8 million dollar third year option. This will be his fourth different team in his past four seasons. After having a breakout year in 2002, he spent all of 2003 recovering from Tommy John surgery. When he returned in 2004, he picked up right where he left off by having another 2 season with an ERA slightly below 4. Is there any reason to suspect he'll be any different in 2006?
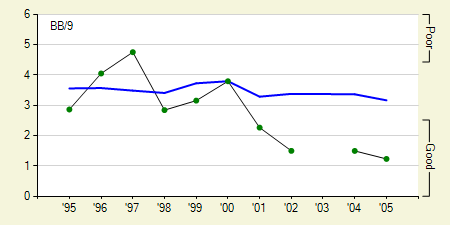
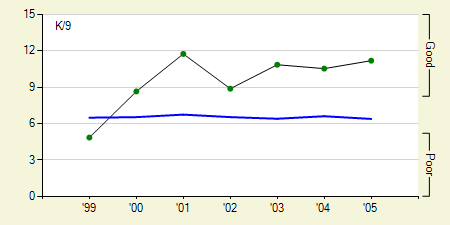
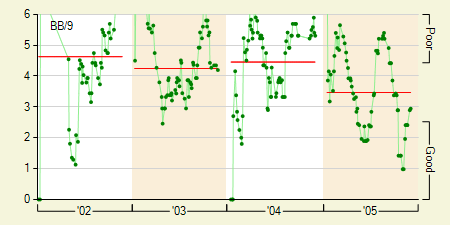
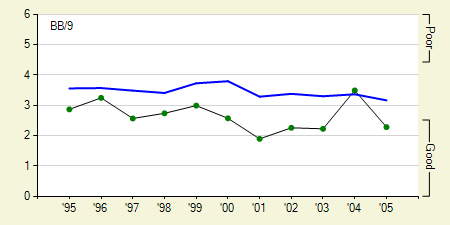
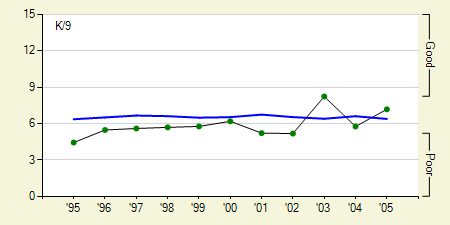
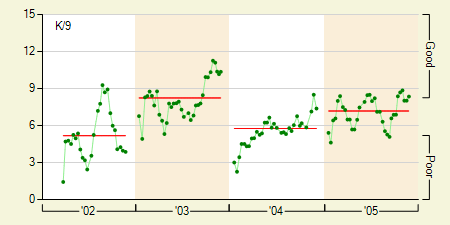
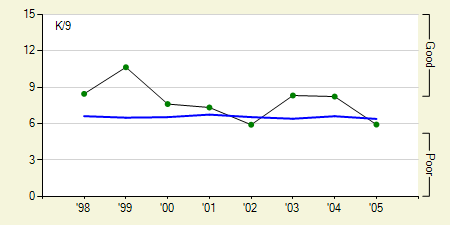
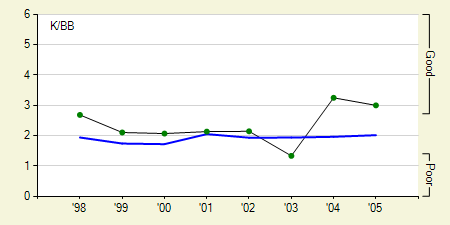
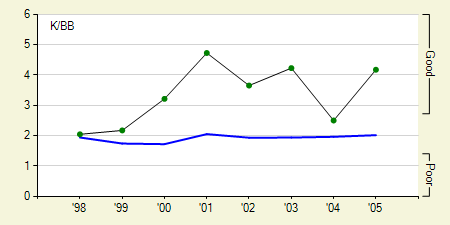
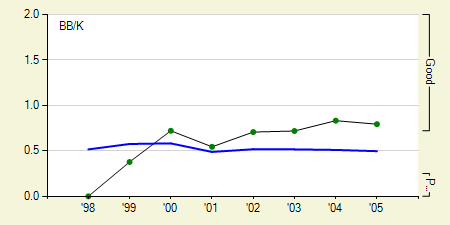
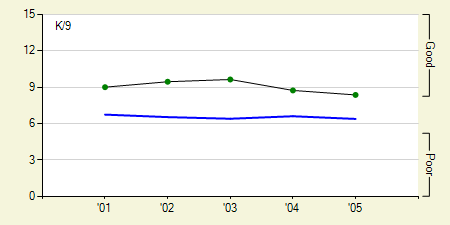
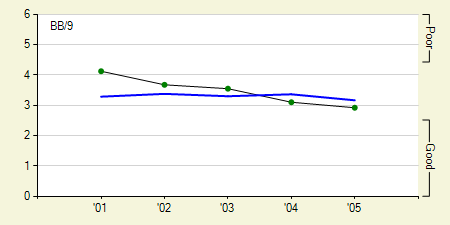
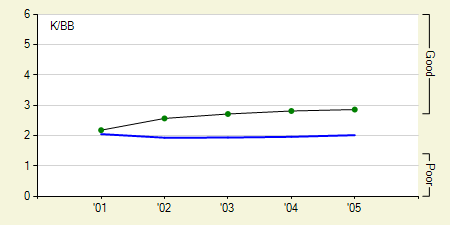
His walks per 9 innings (BB/9) have been very consistent the past three years. Obviously he issues very few walks. He had the fifth lowest BB/9 among all starting pitchers in 2005. However, his strikeouts per 9 innings (K/9) are an entirely different story.
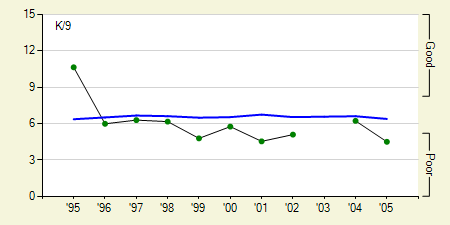
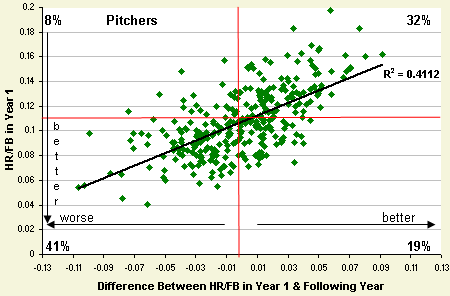
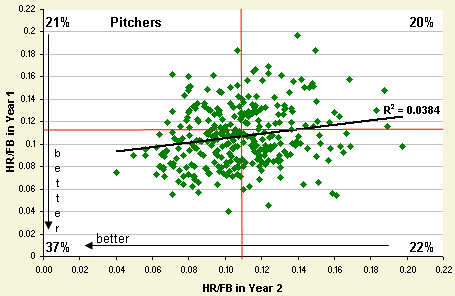
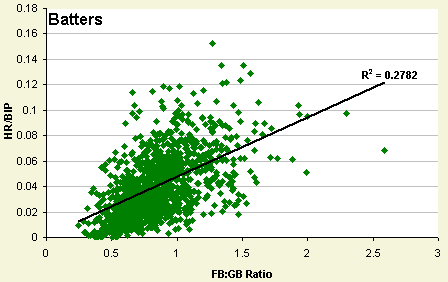
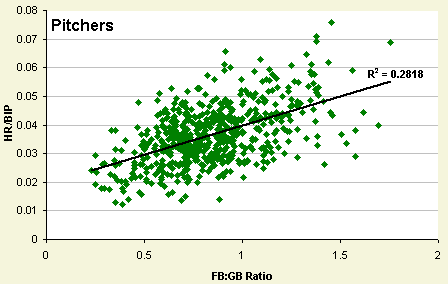
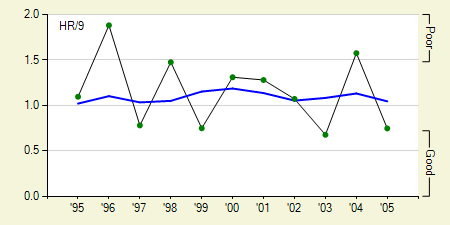
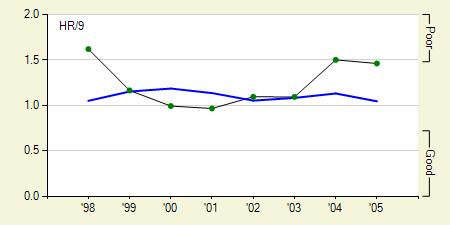
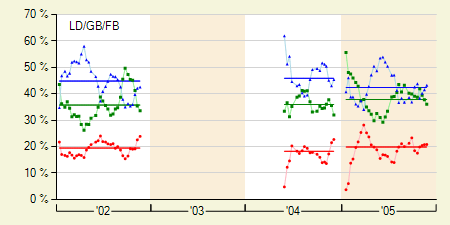
Once again he's very consistent, but this time not in a good way. His low number of walks and low number of strikeouts means he puts the ball in play often. This inspired me to take a look at the number of home runs he allows per fly ball (HR/FB). In 2005, 7% of his fly balls ended up being home runs where the league average is around 11%. Due to his low HR/FB percentage, my research (see HR/FB analysis) shows there's about a 70% chance it will increase the next year. It's also worth noting he's a fly ball pitcher, so a larger HR/FB percentage means even more home runs than a ground ball pitcher.
Despite a likely increase in his home run totals, I think Paul Byrd next year will probably be pretty similar to what he was in 2005. There's not much suggesting his previous three seasons were flukes. Watch to see what his K/9 does next year. Any increase in his strikeouts will go a long way considering his BB/9 is so low.