Author Archive

Daily Graphing – Matt Lawton

Matt Lawton tested positive for steroids today and will serve a 10 game suspension since it's his first offense. Let's see if the steroids worked.

ISO

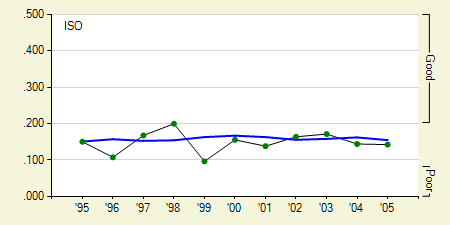
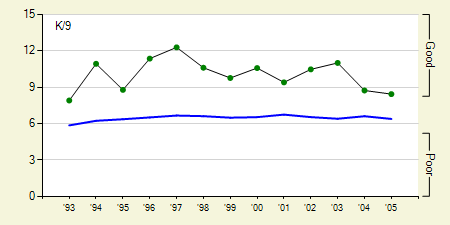
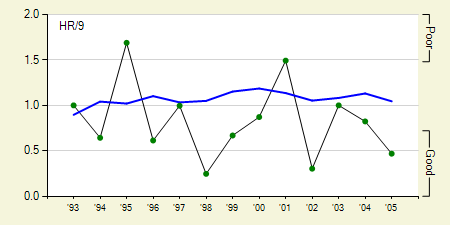
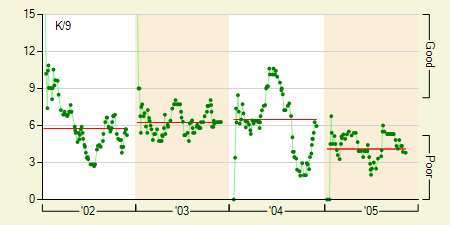
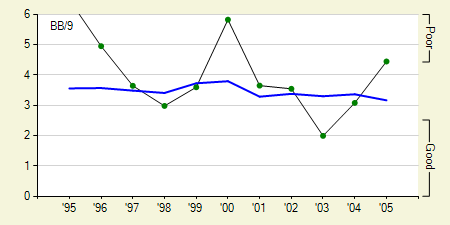
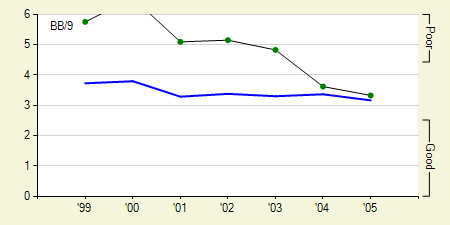
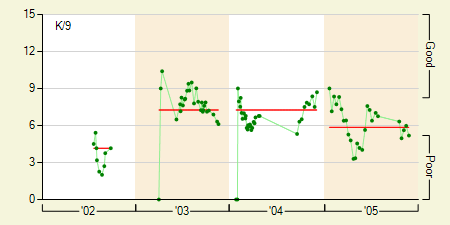
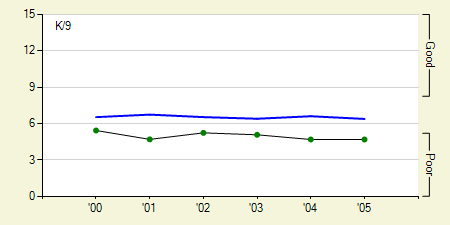
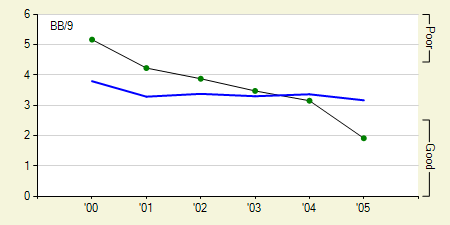
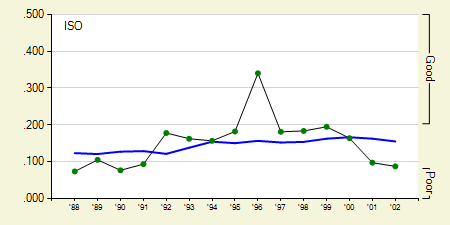
The first thing that comes to mind with steroid users is power. Over the course of his 10 year career Matt Lawton has shown very average power. There's not a thing here that makes me want to yell steroids user. Perhaps if we look at his rolling game by game Isolated Power (ISO) we'll get see some substantial power spikes.

ISO

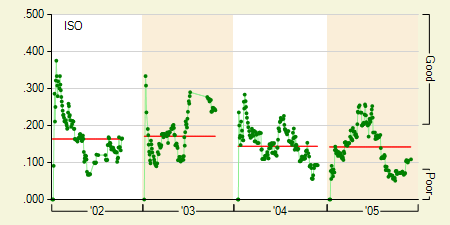
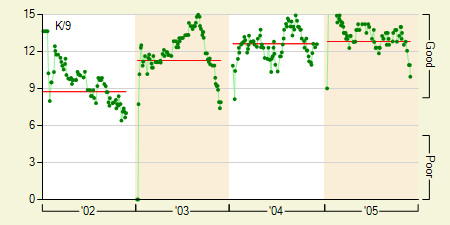
Nope, nothing really eye popping here. He showed some power towards the middle of the season this year, but I was hoping for something more visible, like Brady Anderson's out of the blue 50 home run season.

ISO

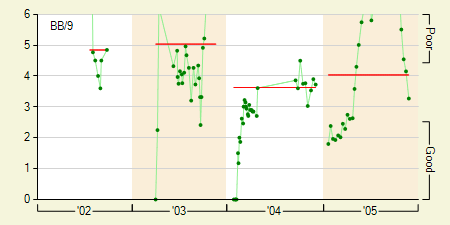
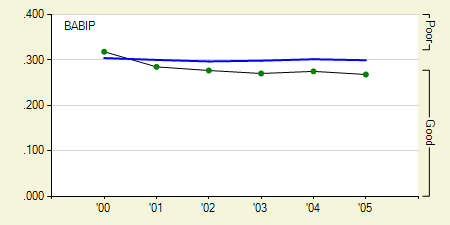
I think Matt Lawton used some defective steroids. He's been pretty consistent through out his major and minor league career so I doubt he's been a long term user. If he was tricked into taking steroids (like all steroid using baseball players are), then it's quite possible it was only for a short amount of time and had no major impact on his stats. Unlike the Rafael Palmeiro suspension, this story has no legs.


Daily Graphing – Trevor Hoffman

After the Padres' insulting 2 year, 10 million dollar offer to Trevor Hoffman, there's a possibility the two might finally be parting ways after 13 years. The question on everyone's mind is, if he leaves San Diego, will his new team play AC/DC's “Hells Bells” when he comes out to close? He better make arrangements for that in his new contract! Let's see why Trevor Hoffman thinks he deserves more than the Padres are offering.

K9

Looking at a closers best friend, his strikeouts per 9 innings (K/9), there has been some drop off in recent years, yet it still remains a strong 8.4. This should be perfectly adequate for him to continue closing at a high level as long as his walk rate remains low, which it has.

HR9

There is however one area I am slightly concerned about. As you can see from the graph above he's been pretty good at keeping the ball in the park, but for the last two years he has pitched in PETCO Park which is the most difficult park to hit home runs in. I can't help but feel that his home run total has been slightly suppressed, especially since he tends to be a fly ball pitcher.

LDGBFB

When I saw Trevor Hoffman's blown save and loss in the 2005 opener, I was worried that it was the beginning of the end for him. Instead, he went on to compile 42 saves while only blowing an additional 2. I wouldn't bet against him in 2006.


Daily Graphing – Braden Looper

The Mets decided not to take the 5.5 million dollar option on Braden Looper's contract yesterday meaning he will be a free agent. Smart move. Over the past three years, he has successfully converted 81% of his saves, the 2nd worst of any full time closer in baseball. Let's see if there's any hope of Braden Looper getting a closer job elsewhere.

K9

Taking a look at his strikeouts per 9 innings (K/9), it looked like he was headed towards elite levels in 2004. Then midway through that year it suddenly dropped and it has stayed there ever since. Overall his K/9 as a closer was 5.7. Some other closers who have a similar K/9 are Danny Kolb, Danny Graves, Dustin Hermanson, and Jose Mesa. Just like Braden Looper, none of them are still closers.

BB9

If you're wondering about his 2004 success, it was the result of a very low walk rate, and an extremely high ground ball rate. They both reverted towards his career averages in 2005 making him a very average reliever.

LDFBGB

Braden Looper is not the answer to any team's closer problems, or setup man problems for that matter. Unfortunately, I'm betting some sucker of a team will sign him with those purposes in mind and probably won't be too pleased with the results.


Daily Graphing – Matt Morris

Every team is looking for pitching and this winter quality pitchers are in short supply. Matt Morris is one of the few big name free agent pitchers on the market this off season and undoubtedly many teams will be interested in acquiring his services. Will teams get what they're looking for in Matt Morris?

K9

As you can see his strikeouts per nine innings (K/9) have been down year over year for the past four years. He's managed to get away with this worrisome trend for two reasons:

BB9

The first reason is his walk rate, which he managed to get down to a career low 1.7 walks per 9 innings (BB/9). If you can't strike people out, at least make them work to get on base. The second reason is that he plays for the Cardinals. They gave him 4.48 runs on average each time he took the mound, the 8th most in baseball.

Teams considering Matt Morris should not expect him to revert to his 2001-2002 form, but rather they should think of Cory Lidle (they had remarkably similar stats) when signing him. Matt Morris will be a solid 3rd starter for most teams, but anything more should be considered a bonus.


Daily Graphing – Aaron Heilman

Aaron Heilman has been mentioned recently in many trade rumors, all involving big name players such as Manny Ramirez and Barry Zito. Lets take a look at why he's such a hot commodity on the trade market.

ERA

Looking at his rolling ERA, you can see he basically gave up nothing towards the end of the season. Since being moved to the bullpen he gave up 16 runs in 70 innings of work, an ERA of 2.91. In the last two months of the season he gave up a mere 2 runs in 33 plus innings of work. This was good enough for him to split the closers job in the final weeks of the season where he went 4 for 4 in save chances.

K9

His strikeouts per nine inning (K/9) have been on the rise since he was moved to the bullpen. As a reliever his K/9 sits at an elite 9.8 compared to 7.2 as a starter.

BB9

He's even managed to decrease his walks per 9 innings every year he's been in the majors. There's still room for improvement, but if he continues to strike out batters at his current rate, he can probably live with an average walk rate. Francisco Cordero, the Ranger's closer, finds success with a similar strikeout rate and a much higher walk rate.

LDFBGB

To add to the good news, he's also a ground ball pitcher! What's not to like about him? It's quite clear that Aaron Heilman has tremendous upside as a reliever, and maybe even as a starter. As you can see there's a reason why so many teams are interested in him and it will take a big name player for the Mets to move him.


Daily Graphing – Kevin Millwood

Did you know Kevin Millwood holds one of the more annoying records among active players? He has the least amount of wins per start of any pitcher with an ERA under 3 in a single season. It's fun to invent records! The reason for this lack of wins is that the Indians gave him only 85 runs to work with, a mere 2.8 per start. The only pitcher to have less run support than him and have a winning record in 2005 was Roger Clemens, and he needed a sub 2 ERA to do it. So now that Kevin Millwood has filed for free agency, is it realistic for teams to expect another sub 3 ERA from him?

KBB

There were three places he made improvements this year, the first being his walk rate. This was slightly offset by a drop in his strikeout rate, but overall his strikeout to walk ratio was up on the year, but not by much. So why such a big difference in his ERA from 2004 to 2005?

BABIP

His Batting Average on Balls in Play (BABIP) was dubiously high in 2004. As you can see it has dropped back down to a more normal level this year. There was also a slight rise in his percent of ground balls induced, but it's not such a large rise that it alone could be the cause for his good season.

LDGBFB

Despite the improvements in walks, ground balls, and BABIP, I think it would be difficult for him to repeat his 2005 season. However, I do think that he'll be able to keep his ERA well below 4, and chances are he'll have better run support which will mean more wins. Kevin Millwood may not quite be the pitcher teams are looking for as an ace, but he's more than capable of being any team's second starter.


Daily Graphing – Jason Schmidt

The Giants picked up Jason Schmidt's 2006 option yesterday for 10.5 million dollars. Over the past 4 or so years, he has been one of the better pitchers in baseball with a winning percentage of 69%. That puts him at the 6th best in baseball for that same time period. The only knock against him is that he can't pitch an entire season without getting injured at least once. It will come as no surprise then, if I tell you over the past 4 years he is 3rd in pitches thrown per start.

K9

If you take a look at his strikeouts per 9 innings, he reached a 4 year low. I'm not too concerned about this since it still sits at an excellent 8.6. The real drop off came in the free base department.

BB9

As you can see, he allowed more walks per 9 innings last year than he had since the 2000 season. Why did he have such a down year in 2005? Could it be the fact that he threw the most pitches per start of any pitcher in all of baseball in 2004? In 21 starts before his injury that year, he averaged a whopping 120 pitches per start. He did have a decreased workload last year, down nearly 600 pitches from the year before. Hopefully he'll come back next year well rested, but the Giants might be wise to put him on a strict pitch count. I think if he can stay healthy and relatively fatigue free for an entire season he has the ability to be a serious Cy Young contender.


Daily Graphing – B.J. Ryan

Congratulations to the White Sox for winning their first World Series since 1917. Before I go onto the usual daily graphing, I feel it necessary to rant about the headline pretty much everyone chose to use for the White Sox win, “Say it's So!” or its wordier cousin, “Say it IS So!” I actually saw this same headline being used when they made the World Series, and now it's being used again, and again, and again…. The worst part is, this play on the now famous cry of a small boy in reference to the 1919 White Sox scandal never actually happened. Rant over. Let's take a look at B.J. Ryan.

Free agent B.J. Ryan was given the Orioles closers job last year and he thrived in it. He converted 36 saves out of 41 chances, a solid 88% successful conversion rate. More importantly, he kept his strikeout rate ridiculously high for the second season in a row.

K9

Of all active players, his 2005 K/9 of 12.79 is the 11th highest of any other single season. That puts him in the elite company of Eric Gagne, Brad Lidge, and Billy Wagner to name a few.

BB9

To go with a career high strikeout rate, he also managed to get his walks down to a career low. As you can see from the BB/9 graph above, there's still room for improvement here. The only weird thing is his high Batting Average on Balls in Play (BABIP) of .337. I don't exactly know how to explain it, but it could have to do with the Orioles defense. Whatever the reason may be, it's quite possible he hasn't reached his ceiling yet. Barring injury, he should be worth every penny he gets.


Daily Graphing – Brandon Backe

I'm sick of hearing how baseball playoff games are too long. If it were up to me, game 3 would still be in progress right now (that would put them right around the 48th inning). I wonder who would be pitching in the 48th inning of a game, perhaps Ozzie Guillen? In any event, Brandon Backe will take the mound tonight in game 4 of the World Series as the Astros try to avoid a White Sox sweep. He actually pitched pretty well in his last start, giving up only 2 hits in 5.2 innings while striking out 7 and walking 3. Looking at his season as a whole he's been incredibly inconsistent.

BB9

Taking a look at his walks per 9 innings, things started off quite well for Brandon Backe, but then he literally went off the charts. This is not a good thing on the walks graphs. He had thrown 1,050 pitches on the year before he went on his walk frenzy. Guess how many pitches he threw the entire year before? 1,102. That was the most he had ever thrown in the majors and it was over the course of an entire season. Now he had equaled that total in just 2 months. After he went on the DL with a strained rib cage and missed all of August, he seemed to get his walks under control again.

K9

Unfortunately, the same cannot be said about his strikeouts per 9 innings which has drifted down the entire season. All signs point to him being a little overwhelmed with his workload. It will be interesting to see if Brandon Backe can build up the durability to be able to pitch a consistent 200 inning season.


Daily Graphing – Jon Garland

Guess what? Another White Sox player. I keep expecting them to stop winning, but it just isn't happening! Anyway, onto Jon Garland who had a career high 18 wins and a career low 3.50 ERA. He doesn't exactly have overpowering stuff so perhaps we need to put him in the category of crafty lef… righty?

K9

If you take a look at his strikeouts per 9 innings, you'll see he's been consistently unable to strike batters out. He's made up for this by limiting his walks to just under 2 per game.

BB9

Just goes to show what keeping runners off base will do for you. This isn't the only thing Jon Garland has going for him. Remember just a second ago when I called him a crafty righty? That's because batters can't seem to get hits off him even when they do make contact.

BABIP

His Batting Average on Balls in Play (BABIP) from year to year remains remarkably low, and this season it was his lowest ever. Actually, since he's entered the league in 2000, he has the lowest BABIP of any right handed starter. The only pitcher who has a lower BABIP than him is Barry Zito (that doesn't surprise me).

The skeptic in me says there's no way Jon Garland can repeat last season, but I have to say as long as he can keep his walks down like he did this year, there's no reason he can't continue to be a reliable inning eater.