Daily Graphing – Kevin Millwood
Did you know Kevin Millwood holds one of the more annoying records among active players? He has the least amount of wins per start of any pitcher with an ERA under 3 in a single season. It's fun to invent records! The reason for this lack of wins is that the Indians gave him only 85 runs to work with, a mere 2.8 per start. The only pitcher to have less run support than him and have a winning record in 2005 was Roger Clemens, and he needed a sub 2 ERA to do it. So now that Kevin Millwood has filed for free agency, is it realistic for teams to expect another sub 3 ERA from him?
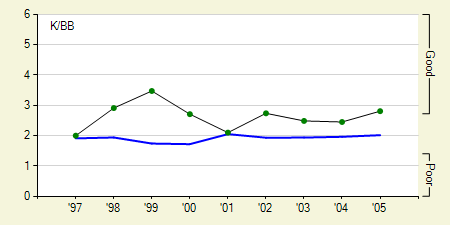
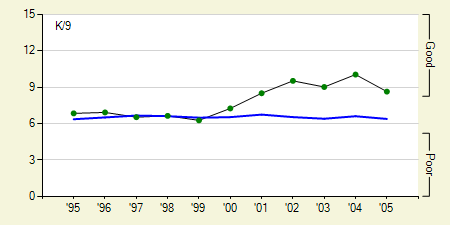
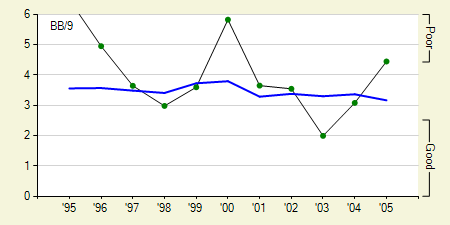
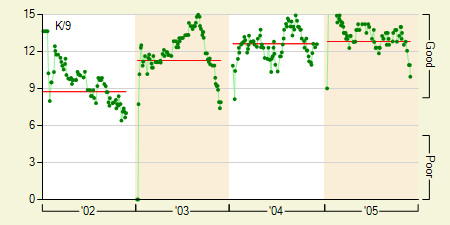
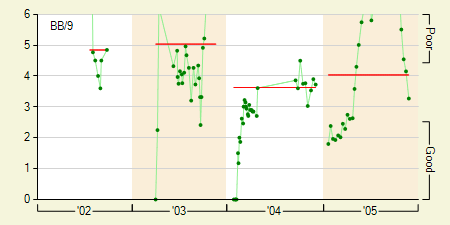
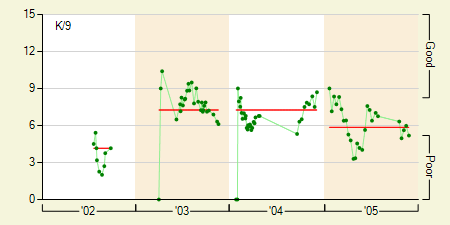
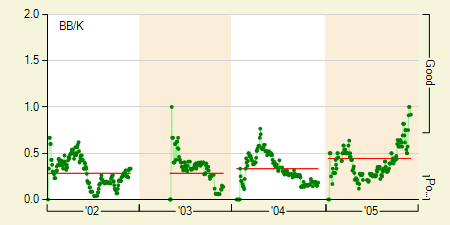
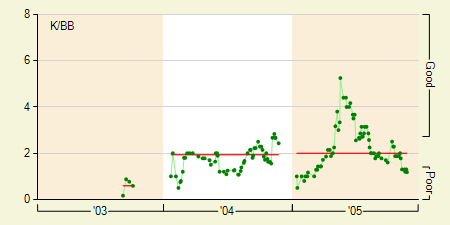
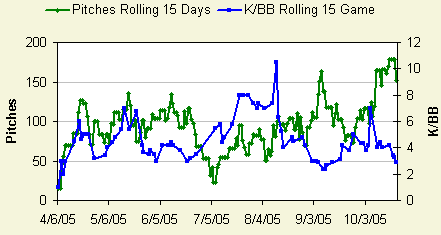
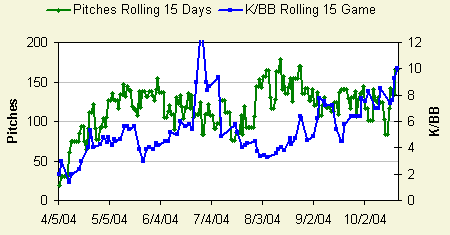
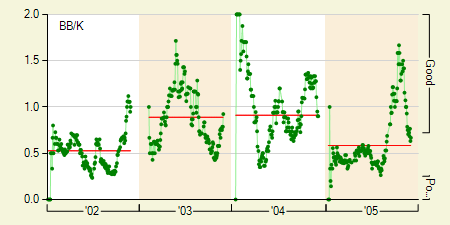
There were three places he made improvements this year, the first being his walk rate. This was slightly offset by a drop in his strikeout rate, but overall his strikeout to walk ratio was up on the year, but not by much. So why such a big difference in his ERA from 2004 to 2005?
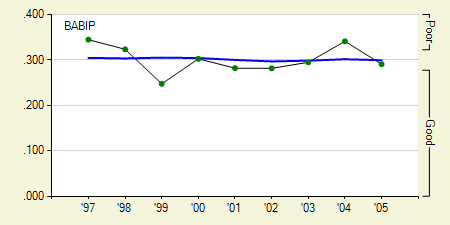
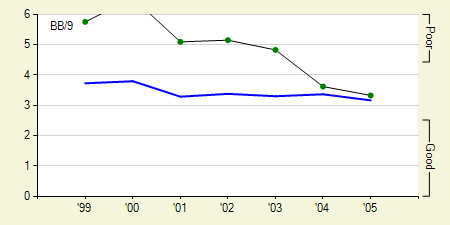
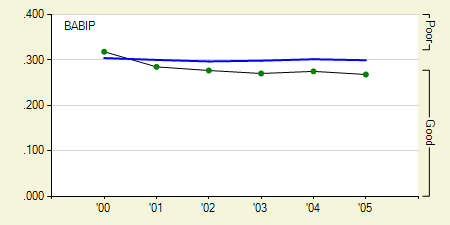
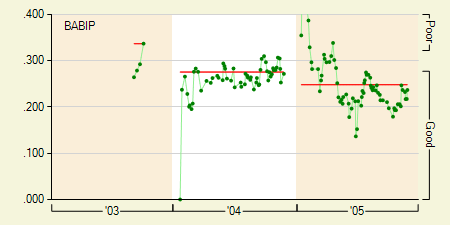
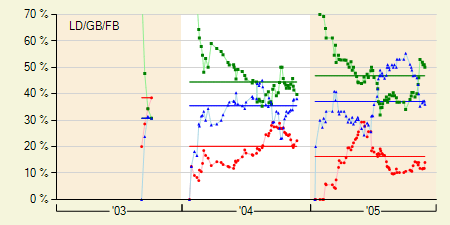
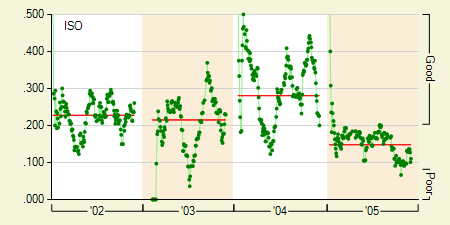
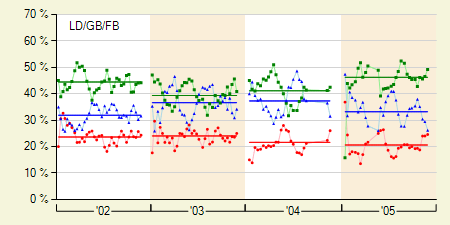
His Batting Average on Balls in Play (BABIP) was dubiously high in 2004. As you can see it has dropped back down to a more normal level this year. There was also a slight rise in his percent of ground balls induced, but it's not such a large rise that it alone could be the cause for his good season.
Despite the improvements in walks, ground balls, and BABIP, I think it would be difficult for him to repeat his 2005 season. However, I do think that he'll be able to keep his ERA well below 4, and chances are he'll have better run support which will mean more wins. Kevin Millwood may not quite be the pitcher teams are looking for as an ace, but he's more than capable of being any team's second starter.