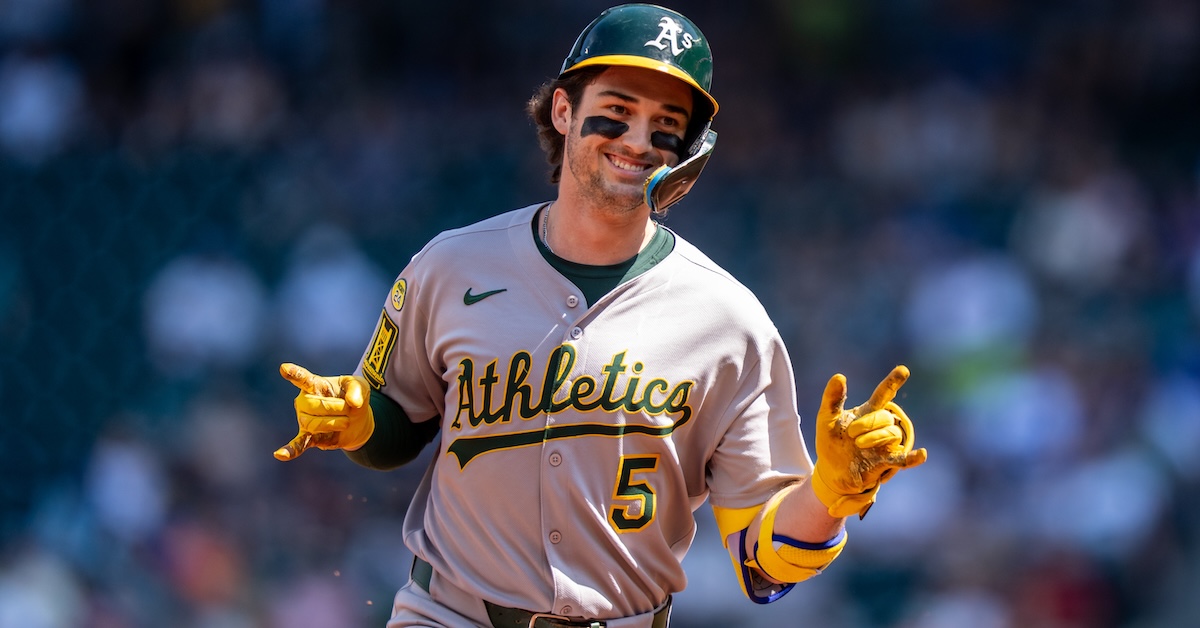
Life is moving fast for Jacob Wilson. The 23-year-old shortstop got married in December, and on Friday, he agreed to a seven-year, $70 million contract extension to stay in West Sacramento. (Well, he’ll be in West Sacramento for two seasons, anyway, and then after that it’s a bit unclear where he’ll be staying, but wherever it is, it’ll be with the Athletics.) Wilson was under team control for five more seasons, but the deal, first reported by ESPN’s Jeff Passan, adds two more years to that total, with a team option for an eighth. If the A’s exercise that option, Wilson will reach free agency for the first time after the 2033 season, when he’ll be 31.
Wilson is coming off an eye-opening rookie campaign. Despite missing a month during the summer after a pitch fractured his forearm, he put up 3.5 WAR, a 121 wRC+ and a .311 batting average. He earned an All-Star nod and picked up an MVP vote, and had he given in to what must have eventually been very strong temptation to poison teammate Nick Kurtz, he could have even taken first place in the Rookie of the Year voting. However, that doesn’t mean he’s a four-win player going forward.
It’s not impossible that Wilson could keep running a batting line that’s 20% better than the league average, but it would be foolish to go into the 2026 season with that expectation. He’s cut from the same cloth as Luis Arraez and Steven Kwan, a pure contact hitter who swings slow and squares the ball up, eschewing both power and patience. Like many hitters who can hit anything, he tends to swing at everything. As a result, he never walks or strikes out, which means he really needs the ball to find grass. In 2025, it did just that. Wilson’s .311 batting average was 34 points above his expected mark, which tied him for the biggest gap among all qualified players. Read the rest of this entry »
One of the fun parts of writing about baseball is the image services. We use Imagn Images, which is owned by USA Today. Like all image services, it licenses pictures taken by professional photographers all over the world to news organizations without their own photographers. That very much includes FanGraphs. We’re not photographers. I’m definitely not a photographer. Here’s the most recent picture I took. It’s a bunch of dusty foam acoustic panels, and I think you’ll agree that the composition is garbage.
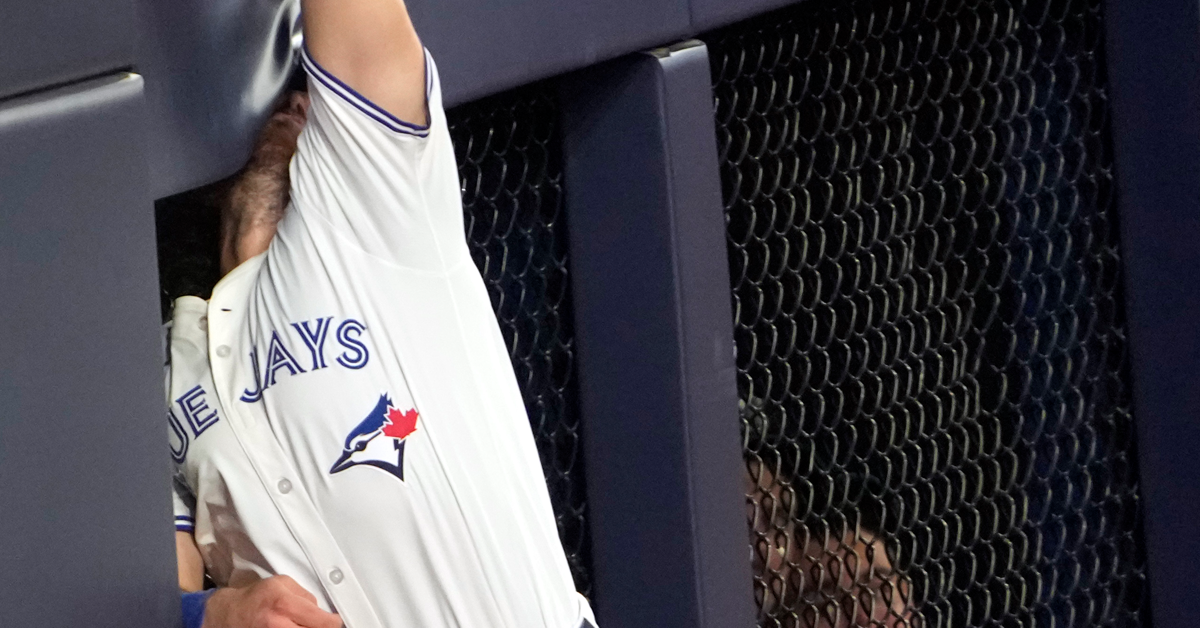
Luckily, the image service allows us to use pictures from actual talented photographers. These people take superlative action shots, and then we grab a convenient one for the top of each article. The system works, but it leaves so, so many cool pictures unused. Today, I’d like to highlight one category of pictures that is a particular favorite of mine: Outfielders smushing themselves into the wall as they try to make a leaping catch. As subgenres go, it’s a delight, and so we’re going to honor the best it has to offer. Read the rest of this entry »
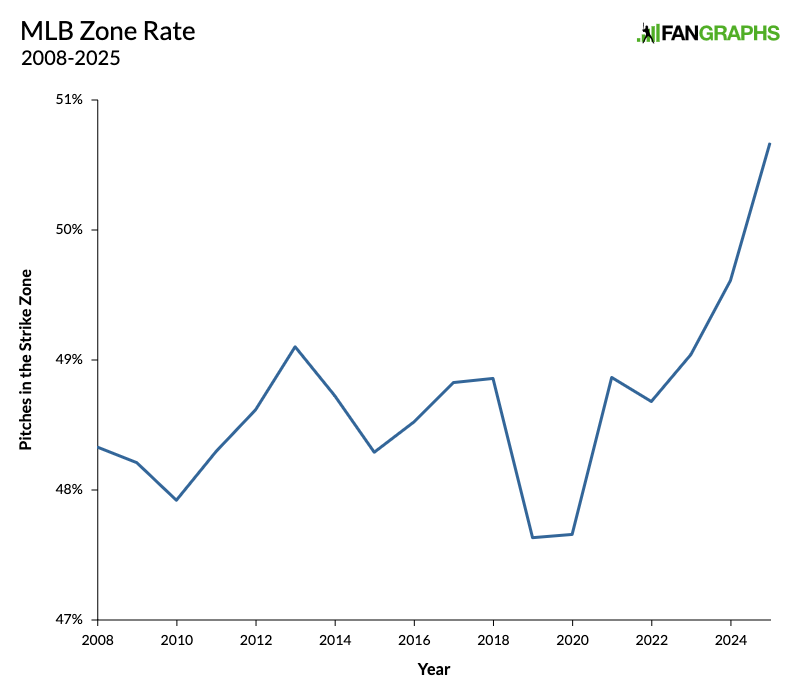
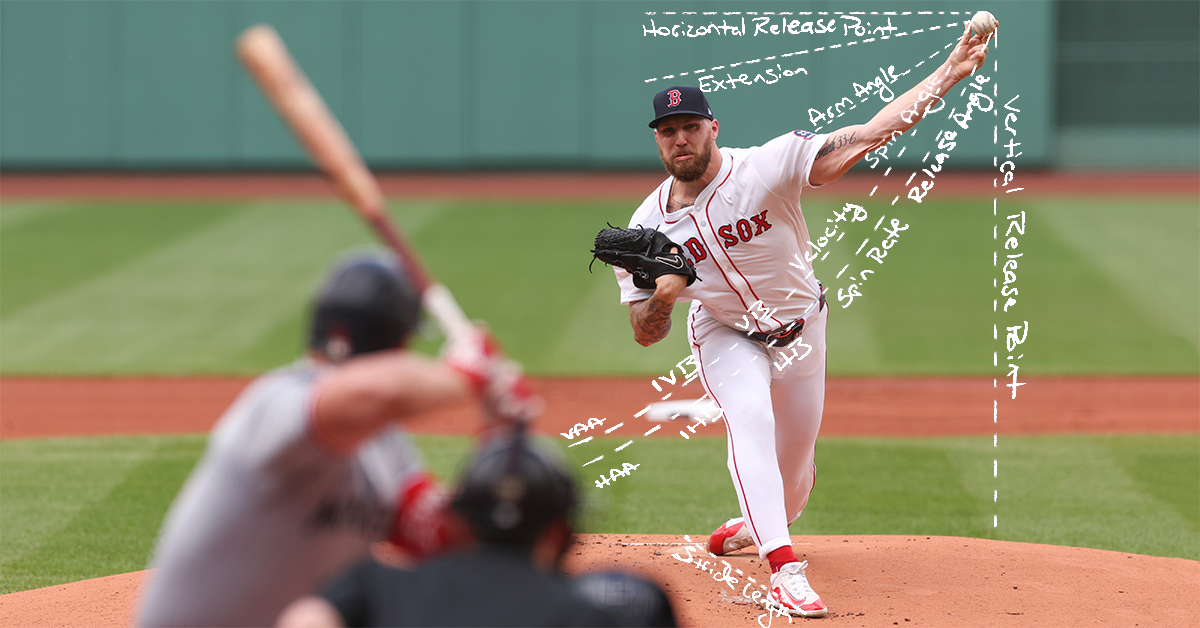
Let’s start with a thought experiment, then we’ll get to the guy in the picture up there. Say you’ve got an unhittable fastball. Every time an opposing batter swings at it, they miss. With such a pitch, you’d want to hit the strike zone every time. Only good things can happen in the strike zone. Either the batter takes and you earn a called strike, or they swing and you earn a swinging strike. Outside the zone, you’d run the risk of throwing a ball because the batter lays off it.
Now, say you’ve got an extremely hittable fastball. Not only does it never generate a whiff, but every time the batter swings at it, they also hit a home run. You’d never want to throw that pitch in the zone. You wouldn’t want to throw it much at all. Maybe you’d use it as a waste pitch to change the batter’s eye level, just every once in a while, and so far outside the zone that they wouldn’t even think about swinging at it. But that’s it.
Those are extreme examples, but my point is to introduce the concept of an ideal zone rate. Every pitcher (and every pitch) in baseball lives somewhere between those two extremes. Some pitchers should live in the zone and some should avoid it. All sorts of factors inform that ideal zone rate: how likely the pitch is to earn a whiff, how likely it is to earn a chase, how hard it tends to gets hit, whether it tends to gets hit in the air or on the ground, how it interacts with the rest of your repertoire, how it performs in different locations, how well you’re able to locate it, how confident you feel in it, the count, batter, situation, and so on, and so on.
Lately, the calculus has shifted somewhat. The zone rate has been rising because pitchers have been instructed to aim down the middle and trust in their stuff. In 2024, 49.6% of all pitches were in the strike zone and 26.5% were specifically in the heart zone (the area at least one baseball’s width from the edge of the zone). Both of those numbers were the highest rates we’d seen since the start of the pitch tracking era in 2008, and both of those numbers were surpassed in 2025, when for the first time ever, more pitches hit the strike zone than missed it. Across baseball, the ideal zone rate has increased.
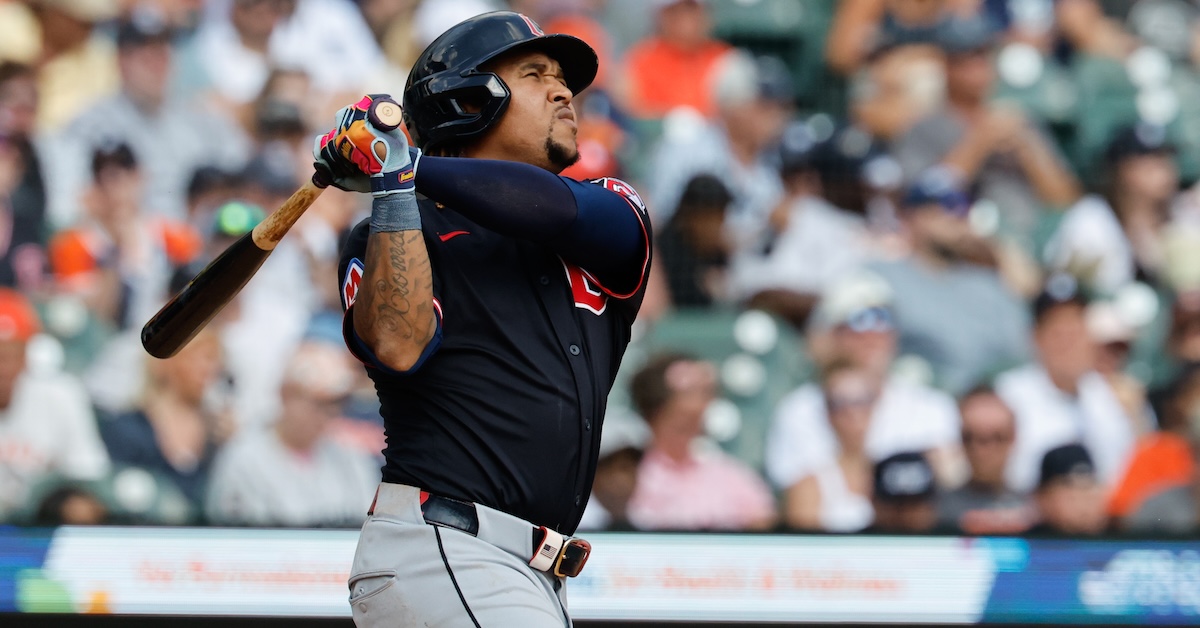
One day, José Ramírez will get old. One day, he’ll dodder out to the grass in front of the pitcher’s mound on the arm of an adorable grandchild and lollipop the ball into the dirt in front of home plate to the warm cheers of the Cleveland faithful. That’s sure to happen at some indeterminate point in the future. This weekend, however, the Guardians expressed their belief that Ramírez’s inevitable decline is a long way off, inking the 33-year-old future Hall of Famer to a seven-year contract extension that will keep him in the fold through the 2032 season. When the extension expires, Ramírez will be 40.
We’ll break down all the numbers and the dollars, but the biggest story here is the most obvious one. This is great news for anybody who loves Ramírez, the Guardians, or baseball. Ramírez has full no-trade rights, and there’s every reason to expect him to stay for the rest of his career. It’s time to talk about statues and plaques and how nice it is that we’ll never have to know just how wrong it would feel to see him in a jersey that doesn’t say Cleveland on it. This is the third extension Ramírez has signed. The first came in 2016, and it bought out his arbitration years plus two option years. The second came in 2022, and, like this one, it bought out the final three years of the previous extension. Ramírez wanted to stay in Cleveland, and with those first two extensions, he forfeited tens of millions of dollars on the open market to do so.
This extension is slightly more complicated, and the details matter quite a bit. Ramírez was already signed though the 2028 season as part of the previous seven-year extension, so it’s not as if there was a pressing need to get this done. He was owed $69 million over the next three years. This deal reworks his compensation over that period and adds four more years. Over the next seven seasons, Ramírez will earn $25 million per year, with $10 million per year deferred. (Each of those deferrals lasts 10 years, and then pays out $1 million per year for 10 years. So he’ll get $1 million in 2036, $2 million in 2037, and so on until he gets his final $1 million payment in 2051.) The deal also came with perks like increased bonuses for awards and high finishes in the MVP voting, an extra hotel room on road trips, and use of a private jet to and from the All-Star Game plus one extra time per year. Read the rest of this entry »
One of the reasons I’ve enjoyed tracking We Trieds over the past year is that there’s so much gray area involved. When a team gets the word out that it was also interested in a player who signed with another team, that information takes a circuitous journey. Its source is indeterminate. It’s usually laundered through one or several reporters. When it finally makes its way into the discourse, it emerges on social media, slips out during a podcast, or appears in boldface at the top of a sports section. You’re never quite sure whether the phrasing comes from the reporter or the source or some combination of the two. Most importantly, you never know how much truth is behind it.
The Mets “had some interest” in Pete Alonso, “showed interest” in Raisel Iglesias, “checked in on” Robert Suarez, and “made a reasonable try” for Tyler Rogers. Which player did they want the most? Which player did they expend the most effort to land? Even if you have strong opinions about what all of those words actually mean, you can’t ever be sure. The absence of hard facts leaves plenty of room for interpretation and silly jokes. Today, however, we’re going to focus on two We Trieds that seem, if anything, too real. Will we still make stupid jokes? Yes, we will. We will make them extra stupid. That’s not just our right; it’s our sacred duty. Read the rest of this entry »
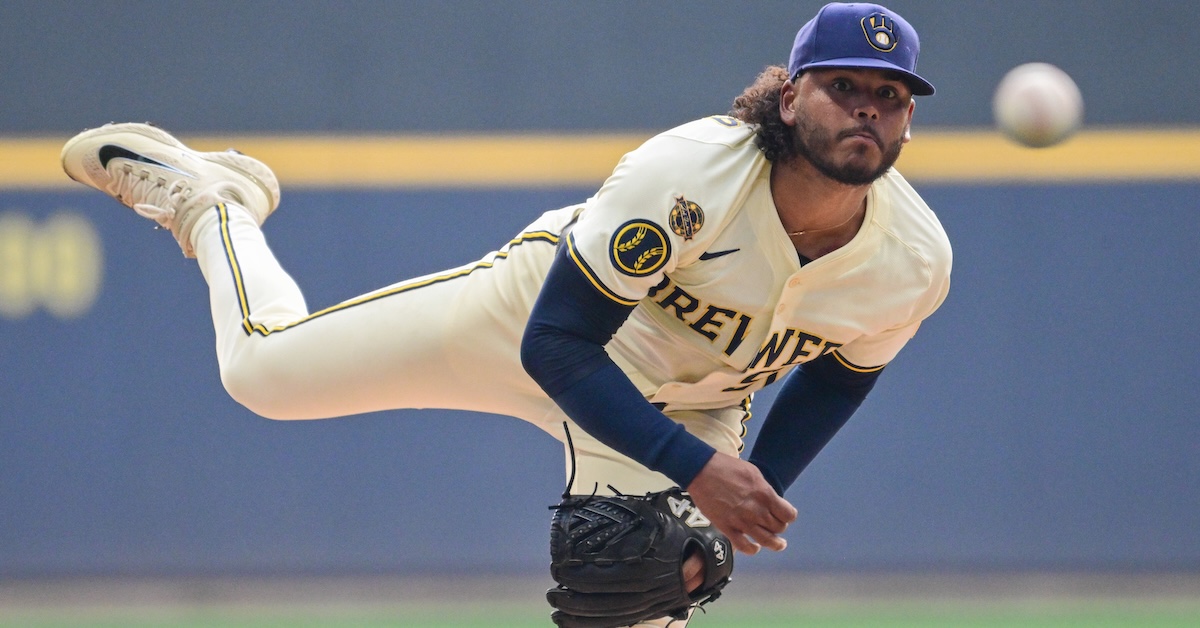
This one may be a little too one the nose. On Wednesday evening, the Brewers and Mets agreed to a trade that sent Freddy Peralta and Tobias Myers to the Mets in exchange for two top 100 prospects, Jett Williams and Brandon Sproat. That’s right, the Brewers got cheaper and younger by selling their best pitcher for prospects, the Mets flexed their financial muscle, and president of baseball operations David Stearns acquired Freddy Peralta. Welcome to every single day.
Peralta may not be your idea of a surefire ace, but he was the unquestioned leader of the Brewers rotation, their Game 1 starter in the playoffs for each of the past two years. As salary dumps go, this one is particularly depressing. Peralta is due just $8 million in his walk year, a hair more than the Angels will be paying Anthony Rendon to clear out of Anaheim as soon as possible, if you please. For Myers and the wildly underpaid Peralta, the Mets surrendered the prospects who ranked 31st and 63rd overall in our Top 100 update back in July. The Brewers did what they do, avoiding expenditures of any kind, finding young players, and trusting that they can keep creating aces out of whole cloth. Meanwhile, the Mets have increased their CBT tax hit from preposterously large to ludicrously large in order to reinforce a rotation that still ranks just 15th on our Depth Charts.
Brendan Gawlowski wrote about Sproat and Williams in a separate article, so our focus here is on the major league side of things, and we’ll start with the headliner. In February 2020, right before the world started exploding, Peralta signed a five-year, $15.5 million extension with two club options that could push the total to $30 million. He was, at that point, a 23-year-old with a career 4.79 ERA and 3.96 FIP and more relief appearances than starts. “We are happy to announce that we have reached a multi-year extension with Freddy that can keep him in a Brewers uniform for the better part of this decade,” said Stearns, then Milwaukee’s president of baseball operations. That prediction came true by the slimmest of margins.
Peralta pitched in relief in 2020, running a 3.99 ERA and an encouraging 2.41 FIP. He broke out in 2021. Over the past five seasons, Peralta has put up 14.8 WAR and gone 54-34 with a 3.30 ERA and 3.65 FIP. Despite dealing with shoulder injuries earlier in his career, he’s pitched at least 165 innings in each of the last three seasons. He anchored the rotation in 2024 when Corbin Burnes got traded and Brandon Woodruff got hurt. By my count, the Brewers extracted roughly two-thirds of a win for each million they paid Peralta. At that rate for their entire roster, the Dodgers would expect to win 208 games this season.
Peralta’s $8 million salary was the fourth-highest on the Brewers, but it will now slot in as the 14th-highest on the Mets. The galling part isn’t just that the Brewers couldn’t swallow the $8 million this year. Trading him means there wasn’t even a thought that they might be able to extend him, or at least that they might be able use a really good pitcher in 2026 and then just deal with losing him in 2027. After all, this is a team that just finished with the best record in baseball and made it to the NLCS. No matter. Milwaukee is taking the cash and the prospects and betting that Woodruff will finally get healthy (and that his alarming drop in velocity isn’t a portent of bad things to come).
After this year (and just in time for a possible work stoppage), Peralta will be entering his age-31 season and finally have the chance to make what he is worth on the open market, unless the Mets lock him up to another extension. This certainly seems like the kind of trade that ends up that way, especially when you consider that Stearns must like Peralta an awful lot, given that he has now traded for him twice and extended him once. Peralta won’t turn 30 until early June, and he just put up the highest fastball velocity of his career. Sproat was our top-ranked prospect on Eric Longenhagen’s updated Mets list from last June, and Williams came in at sixth. In his piece on the Brewers’ return, Brendan wrote that both players “are near-ready, 50-FV contributors and slot into Milwaukee’s farm system as the club’s third- and fourth-best prospects, respectively. Sproat projects as a mid-rotation starter, while Williams is a middle-of-the-diamond player with an as-yet undetermined defensive home.” That’s a serious haul. Keeping Peralta for a while would certainly take some of the sting out of losing them.
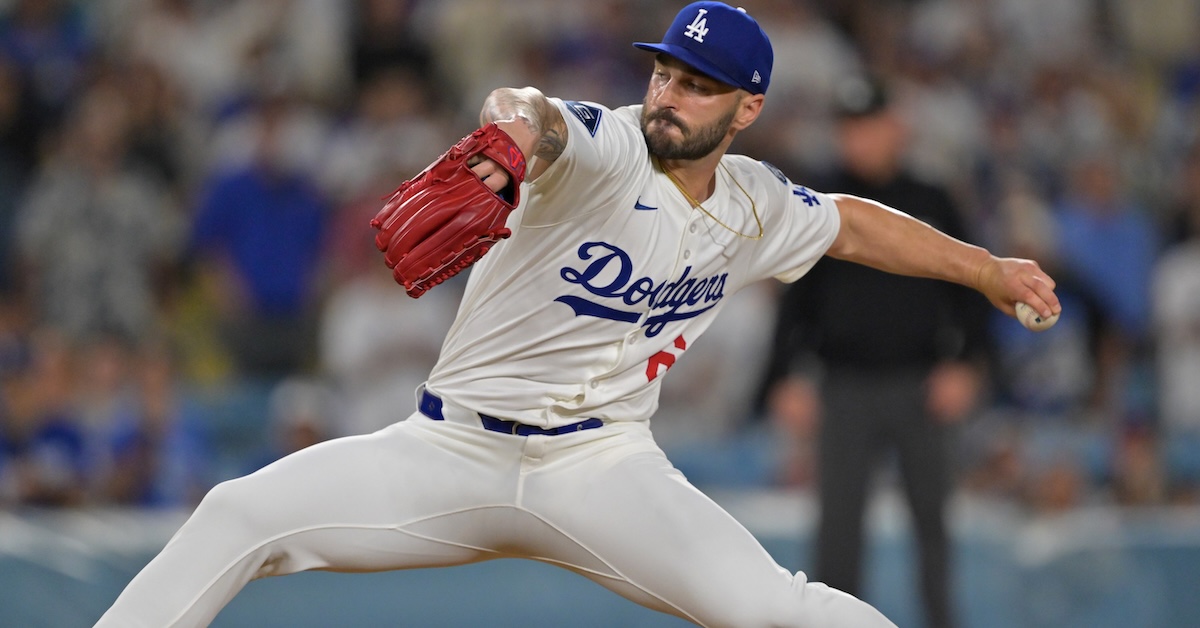
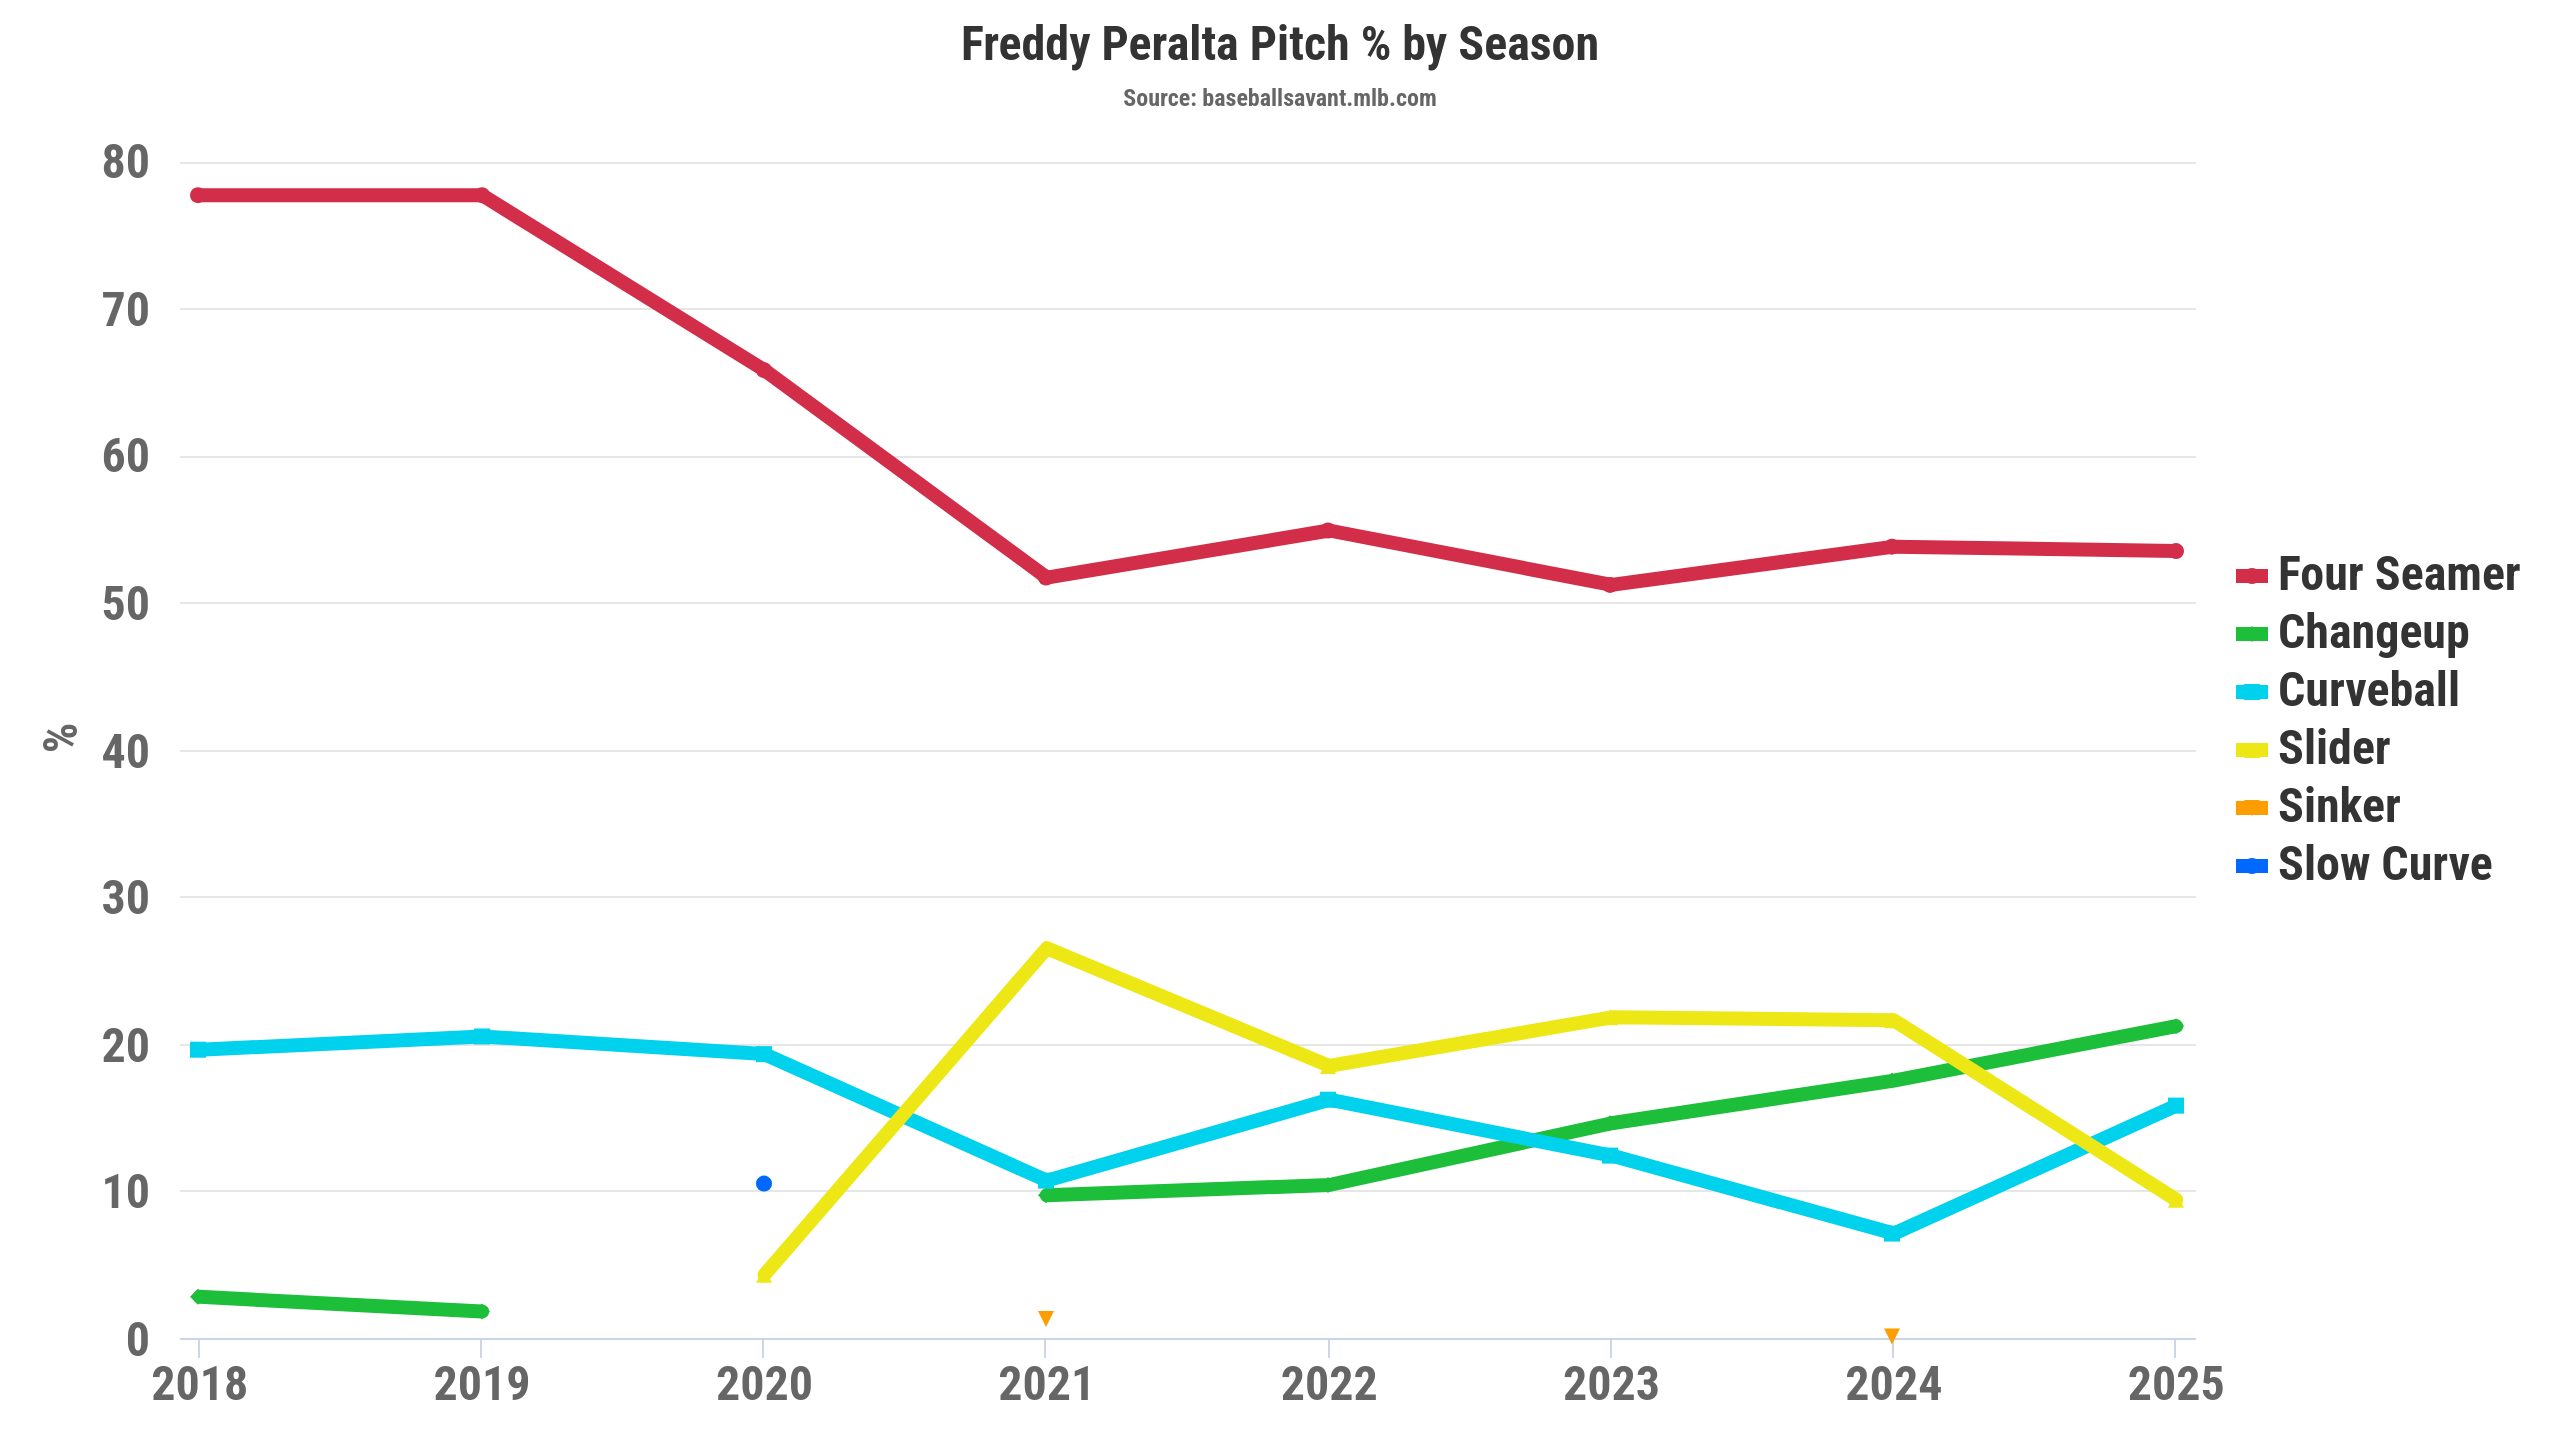
Peralta throws a four-pitch mix: four-seamer, changeup, curveball, and slider. He leads with the four-seamer, throwing it just over half the time to both righties and lefties. As Lance Brozdowski noted in his write-up of the trade, it’s a weird pitch (complimentary). It comes from a low release point not because of a low arm angle, but because he’s only six feet tall and he has a huge stride that brings him a long way down the mound. That huge stride also means huge extension. So even though Peralta’s 94.8 mph velocity put him in just the 57th percentile (among pitchers who threw at least 100 four-seamers in 2025), his 95.2 mph perceived velocity put him in the 74th percentile. A flat fastball with above-average velocity is a great combination, but it’s worth noting that Peralta really needs every bit of his stuff.
He hit the strike zone just 45% of the time in 2025, the lowest rate among all qualified pitchers. He ran the third-lowest mark in 2024 and the 13th lowest in 2023. Over the past five years, among pitchers who have thrown at least 2,000 pitches, his 46% zone rate puts him in the ninth percentile. That’s great if you can get away with it, as pitches over the plate are the ones that get hit. Peralta gives up too many walks, but he runs average chase rates and superlative whiff rates, allowing him to offset all those walks with tons of strikeouts and lots of weak contact. It’s a cocktail that some advanced ERA estimators, like DRA, absolutely abhor, but he’s got a long track record of success with it.
If and when Peralta’s stuff stops fooling batters, though, this trick could fall apart in a hurry. If he can’t induce chases, he’ll have to come into the zone. Once he’s in the zone, he’s probably going to allow more hard contact, and if he’s not inducing chases, he’s probably not going to induce as many whiffs either. That’s not to say that he couldn’t learn a new approach, and the good news is that this potentially swift decline doesn’t seem imminent. As you know, his four-seamer averaged 94.8 mph in 2025 (and played even faster), but his fastball velocity has actually been trending up over the past few seasons. It performed well even in 2022, when it averaged just 92.9 mph. That’s a reassuringly large margin for error. On the other hand, the inefficiency of his approach means that he throws tons of pitches; 8,991 over the past three years, to be exact. That’s the fifth most in the game, and it’s fair to wonder whether he might one day, you know, get tired.
Peralta halved his slider usage in 2025, throwing it just under 10% of the time. He didn’t really throw it to lefties at all, and against righties, he threw all three of his non-fastballs roughly 16% of the time.
Brozdowski posited that Peralta lost feel for his slider, noting its inconsistent amount of horizontal break. It has shifted so much that in some years, some pitch classifications split it up into a slider and a sweeper. Regardless, Stuff+ and StuffPro both regard the pitch as Peralta’s best, and Brozdowski hypothesized that the Mets will try to help him figure it out and return it to its place of prominence. Even if he doesn’t find another gear, he still slides in as the top pitcher in a Mets rotation that completely fell apart in the second half in 2025, and projects as average in 2026. That’s not to say it’s without upside.
The Mets have several starters whose names any baseball fan will know. It starts with Nolan McLean and Jonah Tong, who made their debuts in 2025. McLean looks ready to contribute right away in 2026. Kodai Senga has a career 3.00 ERA and 3.82 FIP in MLB. After a shoulder capsule strain and a calf strain cost him nearly the entire 2024 season, his velocity dropped and his strikeout rate cratered last year, when he also dealt with a hamstring strain. As a result, the projections peg him for an ERA that’s dangerously close to 4.00. But if he finds his old form, he’s a star.
In his first season as a starter, Clay Holmes posted a solid 3.53 ERA, but his 4.11 FIP told a different tale, and the peripherals were scary. The velocity of his sinker, his most-used pitch, fell by 2.9 mph as he transitioned from high-leverage reliever to starter. His strikeout rate, which had averaged nearly 25% to that point in his career, dropped to 18%. Holmes is entering his age-33 season, and it’s hard to know how much improvement to expect from him with one year of starting experience under his belt.
Despite underperforming his peripherals in a major way in 2024, David Peterson seems solid as ever, and he’ll make $100,000 more than Peralta in his final year of arbitration. An oblique strain blew up Sean Manaea’s 2025 season, limiting him to 12 ugly starts, but he’s just one year removed from a 2024 season in which he earned a Cy Young vote. That’s six names and nearly as many question marks, but this rotation certainly isn’t devoid of talent. It’s not hard to envision this staff being good, and it’s not hard to envision it being quite bad. If nothing else, Peralta adds some much-needed stability.
Tobias Myers is 27, and across his two big league seasons, he has made 31 starts and 18 relief appearances, putting up a 3.55 ERA and 3.92 FIP. An early-season oblique strain cost Myers some time in 2025, and he got sent down after a rough start. However, he came back up in a relief role in July, and over the last three months of the season, he posted a 2.64 ERA and 3.49 FIP. With a 93.5 mph fastball, his stuff grades out as roughly average, and he doesn’t strike out many batters. He also had the odd distinction of tying for the splitter that had the most induced vertical rise in baseball at 10.5 inches.
Myers throws six pitches: a four-seamer, cutter, slider, splitter, changeup, and curveball. When you look at his extremely steep 61-degree arm angle and the huge rise on his four-seamer, you start to wonder why he doesn’t embrace this North-South profile and throw his curveball much more often. He was blocked in Milwaukee, and if all goes to plan, he’s likely to be blocked in New York too, and maybe he’s shown all that he has to offer. Still, though it might not be the smartest thing in the world to assume that some other team is going to do a better job of developing a pitcher than the Brewers, it’s fair to say that Myers doesn’t seem like a finished product.
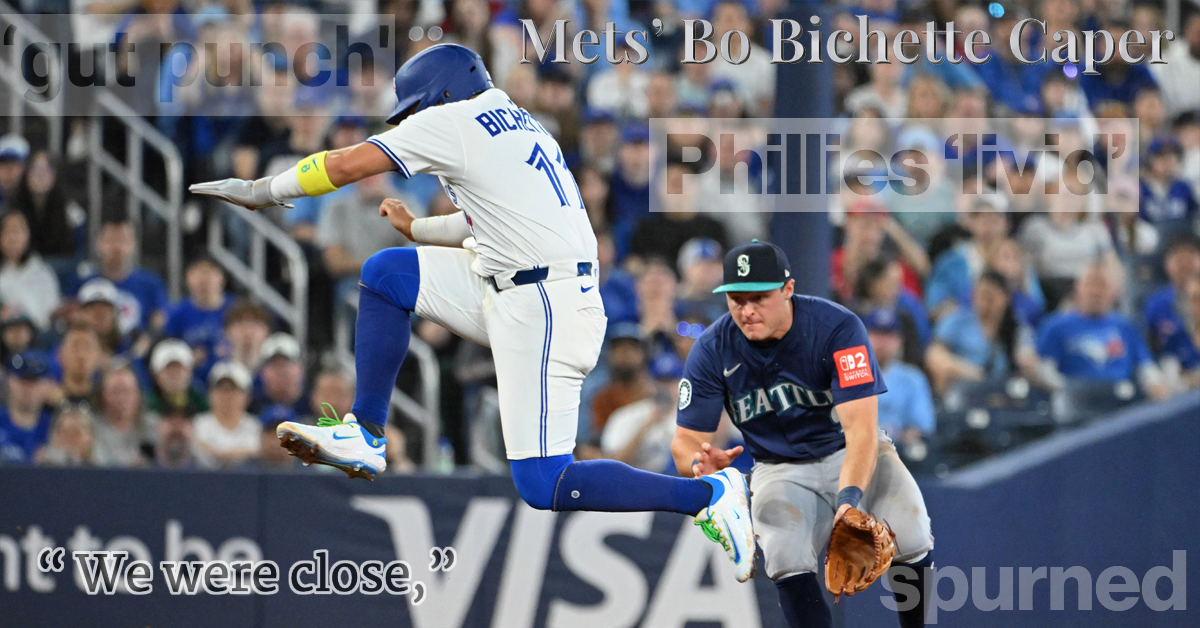
The Mets spent the beginning of the offseason upgrading their bullpen and replacing Pete Alonso. Over the past several days, they’ve reminded everyone just how much of a juggernaut they really are. What’s $8 million (and the resultant $8.8 million luxury tax hit) to a team that just snatched Bo Bichette away from the Phillies for (in theory) three years and $126 million? It’s entirely possible that the Brewers will turn Sproat into their latest ace, and that in a year or two he’ll start a playoff game against the Mets, just like Peralta did in 2024. But the Mets are trying to win this season, and now that he’s not in Milwaukee, David Stearns has the luxury of leaving tomorrow’s problems for tomorrow.
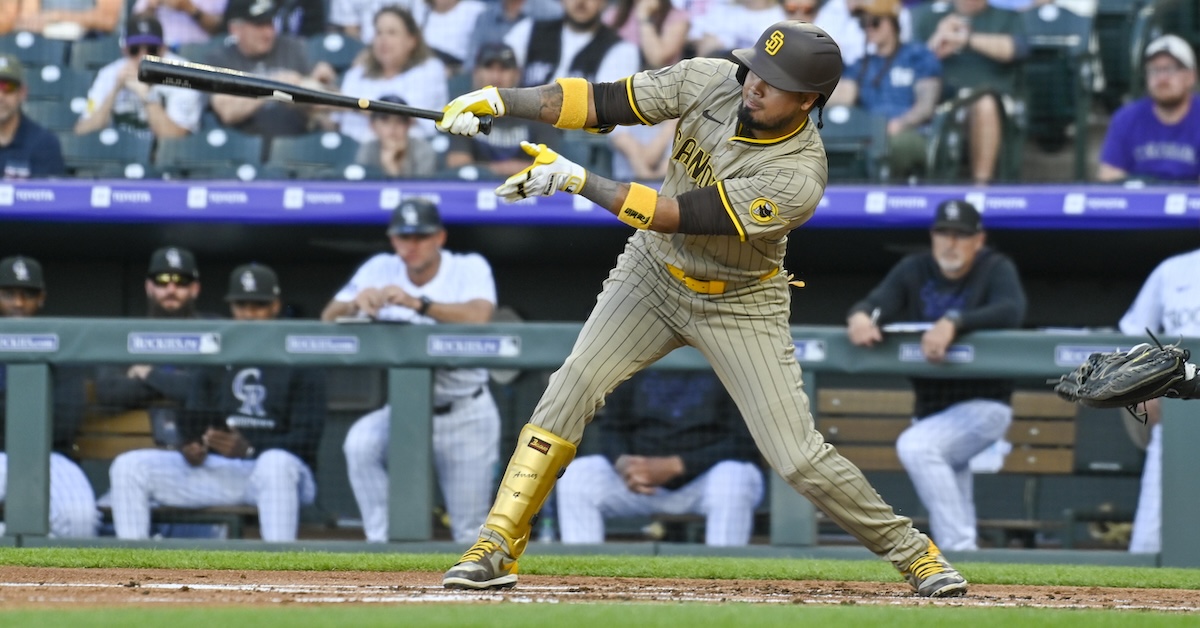
In early November, MLB Trade Rumors and Baseball Prospectus released their top 50 free agents lists, which included guesses about where each player would end up. Our focus in this article is on Luis Arraez, and in those two lists, seven very smart people and one random number generator made their best estimations about his likeliest destination. Only two of those experts picked the same team for him. The next week, MLB.com’s Mike Petriello broke down a whopping seven potential landing spots for Arraez. Only one of those teams was on either of the two previous lists. Lastly, just this weekend, a Fox Sports article with no byline explained why three teams would make the best fit for Arraez, and only one of those teams had any overlap with the previous three articles. By my count, that’s eight different experts, one robot, and one I-don’t-know-what making a total of 18 predictions. Somehow, those 18 predictions included 15 different landing spots for Arraez. That’s half the league! Only three teams got multiple votes, and no team got more than two. We’ve got a genuine mystery on our hands.
To some degree, all of this is understandable. Most projections have Arraez signing for either one year or two with an average annual value of $11 or $12 million. That means even the stingiest teams can afford him. And although Arraez is a poor defender who only projects for roughly 1.5 WAR (depending on your projection system), he’s never once put up a below-average season on offense. With the possible exception of the Dodgers, there is no such thing as a team that couldn’t find a spot for a hitter of Arraez’s caliber. ZiPS is slightly higher on Arraez than most systems, projecting him for 1.8 WAR in 2026. That’s more than we have projected in our Depth Charts either at first base, DH, or both for 21 different teams. Everybody can afford him. Almost everybody could use him. He really could end up anywhere.
While I don’t have any special insight about where Arraez will end up, I do have a strong preference. I want him to sign with the Rockies, and I want this for a very simple reason. I want to see Luis Arraez be the most Luis Arraez he can be. His skill set is unique in today’s game, and Coors Field is the perfect environment to let him flourish. Read the rest of this entry »
Before we get started, I need you to promise to hold on until the end here. I have buried the lede. The crux of this article is in the last two graphs, all the way at the bottom. I put them there on purpose because I want the data to tell you a story, so I need you to see this story through to the end. I think it’s worth it.
Last Tuesday, Ben Clemens wrote an article titled, “They Don’t Make Barrels Like They Used To.” Sadly, it was not a scathing takedown aimed at the shoddy craftsmanship of modern-day coopers. It documented the steady decrease in the value of barrels over the course of the Statcast era. In 2025, barrels were worth roughly 250 fewer points of wOBA than they were in 2015. That’s a staggering loss – the entire career wOBA of Pepe Frias up in smoke – and Ben broke down several culprits for the theft, along with one other factor: intention. “Tell hitters that barrels get them paid,” Ben wrote, “and they might start to change their behavior in a way that produces less valuable barrels, squared up to center field or in other ways that are easier to produce but less likely to land safely.” He attributed this to Goodhart’s Law: “When a measure becomes a target, it ceases to become a good measure.”
This law has a sports-specific corollary that you’re probably familiar with. I’ve previously referred to it as the Competitive Advantage Life Cycle in the context of catcher framing:
Teams realize the immense value of a skill.
An arms race ensues as they scramble to cultivate it.
The skill becomes widespread across the league.
Since the skill is more evenly distributed, it loses much of its value.
The second we gained the ability to calculate the value of catcher framing, everybody started working on it. The terrible framers either got better or got run out of the sport. Players who were excellent at framing but worse at other parts of the game suddenly found more playing time because their skills were appreciated. Lastly, as the average framing level rose, the rest of the league started catching up to the very best framers. This graph is three years old now, but it shows that convergence very clearly.
The terrible framers are gone, and the great framers don’t stand out as much as they used to. Everybody’s a bit closer to the new, tougher standard, so framing is more important than it’s ever been, but also less valuable. All this got me thinking about one of the oddest measurement tools we have these days: pitch modeling. Read the rest of this entry »
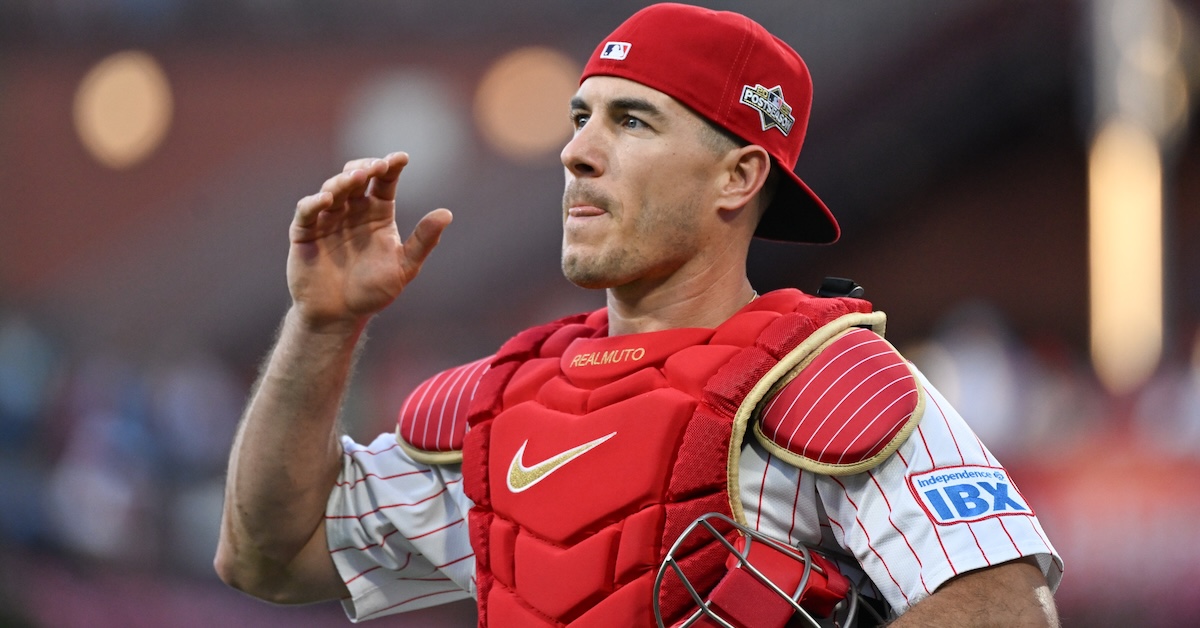
Well, that’s a relief. On Friday afternoon, the Phillies, spurned by Bo Bichette, got swept up in the tidal wave of hot stove transactions, agreeing to a three-year, $45 million deal (plus $15 million in incentives) to keep J.T. Realmuto in Philadelphia, according to Ken Rosenthal and Matt Gelb of The Athletic. You may have your qualms about rebounding from a rejection by signing a catcher three years into his decline phase for another three years, but consider what other options the Phillies had, and then consider how weird it would have felt to watch Realmuto playing in another uniform after all this time. It’s probably too many years, and that’s not great, but look at everything else that’s going on in the world right now and realize how much nicer it is to spend a moment thinking about something that’s merely not great.
Before we dive into the here and now, let’s take this chance to remind ourselves just how special a career Realmuto has had. He debuted with the Marlins in 2014 and blossomed into a star in 2017, combining excellent defense with a great bat and an exquisite baserunning prowess unbefitting a backstop. (He currently ranks 23rd all-time among catchers with 104 stolen bases. If we limit ourselves to 1901 and later, he moves up to 11th.) Such things were never meant for Miami. In February 2019, after he’d put up two four-win seasons and earned an All-Star nod and a Silver Slugger, the Marlins traded him to Philadelphia for a blockbuster package that netted them 2.0 total WAR and $250,000 in international bonus pool money. Realmuto got even better the next season.
From 2017 to 2022, Realmuto wasn’t just the best catcher in baseball; there was an ocean between him and the rest of the competition. He led all catchers with 28.2 WAR. Yasmani Grandal, in second place, had just 19.6. Of the 207 catchers who played during that stretch, Grandal and future Hall of Famer Buster Posey were the only ones whose WAR total Realmuto didn’t double. Over that stretch, he tops our leaderboards at the plate, on the basepaths, and on defense, and nobody else is even close. Realmuto has earned two Gold Gloves, two Silver Sluggers, three All-Star nods, and MVP votes in two seasons. He has a career 104 wRC+ in the playoffs. It’s great that the Phillies have held onto him. He’ll reach 200 career home runs in Philadelphia. He’s the team’s longest-tenured position player, ahead of Bryce Harper by roughly a month and trailing only Aaron Nola on the pitching side. He’s a grinder, the heart of a Phillies team that has been at the top of the league for years now. Still, you know the problem as well as I do.
It’s not 2022 anymore, and Realmuto has got so, so many miles on his knees. He has caught at least 125 games seven different times, and led the league in innings caught in three of the last four seasons. He ranks seventh in innings caught since 2002. Two of the guys ahead of him played through their age-39 seasons. One is a manager now.
Realmuto started looking human in 2023, and he missed a couple months due to a meniscectomy in 2024. Over the past three years, he’s run a perfectly average 100 wRC+. That’s still plenty good for a catcher, but it dropped to 94 in 2025, and advanced numbers like DRC+ have him even lower. Although he hit the ball just about as hard as ever, his bat speed took a very scary dive from the 70th percentile in 2024 to the 47th in 2025, and his barrel rate followed suit. Realmuto once feasted on four-seamers, but over the past three seasons, he’s put up negative run values against them. He started struggling with cutters in 2024 and sinkers in 2025, meaning he now struggles against any kind of fastball.
He has combined this weaker bat with poor framing numbers, and despite still possessing plenty of speed, he’s even started to take on water in the baserunning department. Put it together, and Realmuto has recorded almost exactly 2.0 WAR in each of the past three seasons. Despite all the doom and gloom I just laid on you, that’s not just a useful player, it’s an above-average catcher.
It makes Realmuto the best option behind the plate on the Phillies roster, ahead of Rafael Marchán and Garrett Stubbs. Likewise, it made Realmuto the top-ranked catcher on our Top 50 Free Agents list, where he came in at 30th overall. Wouldn’t you rather have him than Danny Jansen or Victor Caratini, who ranked 38th and 39th? In 2025, you definitely would, but projections pegged Realmuto for a two-year deal with an average annual value of $13 million. Instead, he’s making $15 million for an extra year, which will be, once again, the age-37 season of the guy who already ranks seventh in innings caught this century. Still, there was no better catcher on the trading block, and unless the Tyrell Corporation has started manufacturing them while I wasn’t paying attention, we’ve now exhausted all the ways by which a baseball team can get its hands on a baseball player.
Everything makes sense here. The Phillies are a win-now team that’s already above the highest luxury tax threshold. It’s hard to blame them for holding onto the best catcher available to them, especially when he’s a guy they love – a guy they and their fans are capable of appreciating far more deeply than anybody else is – for a year and a few million dollars more than would be ideal. Three years is not forever, and Realmuto now has an excellent chance at ending his career as a Phillie. It’ll be OK. Try to enjoy your weekend.
The Red Sox have finally done it. On Wednesday afternoon, the Sox became the last team in baseball to agree to terms with a major league free agent and they did so with a bang, nabbing southpaw Ranger Suárez on a five-year deal worth $130 million. Jon Heyman of the New York Post first reported the signing, while Bob Nightengale of USA Today reported the terms. Alex Speier of the Boston Globe reported that the deal contained no deferred money, meaning that the average annual value is a straight $26 million. Setting aside Alex Bregman’s opt-out laden pillow contract and several two-year deals given to pitchers who missed the first while recovering from injuries, this represents the first true multi-year commitment the team has made to a free agent during the tenure of chief baseball officer Craig Breslow. The Red Sox are finally going for it using every means available, and with one of the game’s most consistently good (if not consistently available) starting pitchers on their roster, they are looking more and more like a championship contender.
The Red Sox went into the offseason with one of the game’s greatest starters in Garrett Crochet, but there was a big gap between him and the rest of the rotation, which featured a number of solid pitchers who hadn’t managed to step up and grab the no. 2 spot in Brayan Bello, Tanner Houck, and Kutter Crawford. Boston upgraded through trades for Sonny Gray and Johan Oviedo, and according to our depth charts, they projected to have the best rotation in the game even before signing Suárez (the Phillies, even without Suárez, rank fourth).
Still, this is a different caliber of move, the effects of which seem likely to cascade down the roster. It represents a major commitment in both years and dollars, and according to RosterResource, it pushes Boston just over the second luxury tax threshold. All of a sudden, Bello and Co. are likely jockeying for the fourth or fifth spot in the rotation rather than the second. The Red Sox also boast Patrick Sandoval, who missed the 2025 season recovering from internal brace surgery, and Kyle Harrison, who came over in the Rafael Devers trade and projects for an above-average line in 2026. We’ve now named nine different viable big league starters, before you even get to coveted prospects like Payton Tolle and Connelly Early, who debuted in 2025. That’s a lot of depth to deal from, freeing Boston up to trade a starter and maybe some of its outfield surplus to reinforce a particularly weak infield. Read the rest of this entry »