The 2025 Season Is O’s-ver

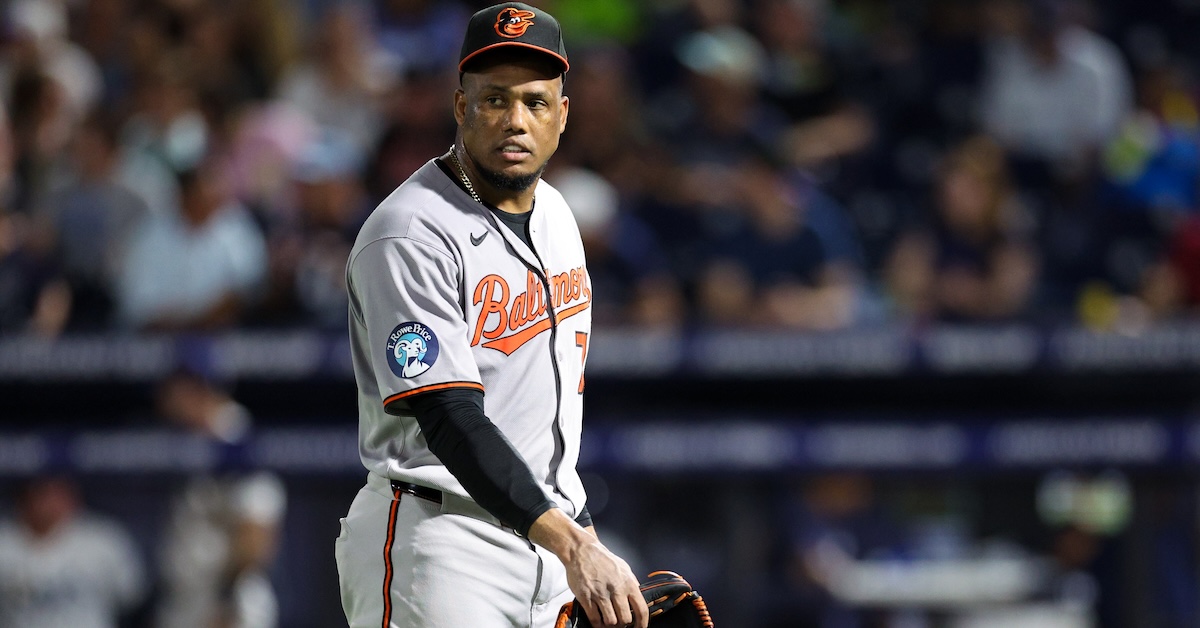
At the end of April, I wrote about whether the Baltimore Orioles could salvage the 2025 season after a dreadful start. Their record stood at 11-17, a decent-sized hole to be sure, but it wasn’t deep enough to be considered a grave. Baltimore still had a chance to turn things around and make a playoff run, so long as the team started winning quickly. Now, nearly two months later, the O’s are 10 wins under .500, and considering we’re one week away from July, the mathematical task to get back into the race is daunting.
The Orioles have actually played better baseball lately, which highlights the fundamental problem with getting to play meaningful games in October. I’d call May 24 their nadir, when the first loss of a doubleheader dropped them to a 16-34 record, just barely ahead of the White Sox, and a 110-loss pace. Charm City has seen some abysmal teams, but only two years of Baltimore baseball featured at least 110 losses; those were 2018 and 2021, during the franchise’s notoriously painful rebuild. Even the 1988 Orioles, who infamously started the season by dropping 21 straight games, recovered enough to manage 54 wins! Beginning with the second game of that May 24 doubleheader, Baltimore has put up a solid 18-10 record. While that sounds promising, it’s actually kind of bad news when we’re talking playoffs. Those 28 games represent just under a fifth of an entire season, and playing really well over this stretch was only enough to increase the team’s playoff probability from 1.5% to 4.4% using the FanGraphs Depth Charts odds, and from 2.6% to 5.0% in the ZiPS projected standings. Read the rest of this entry »