Believe it or not, we’re almost 10% of the way through the 2024 season. While baseball always offers myriad surprises, especially this early, one of the ones that most intrigues me is the success of the Kansas City Royals, who stand at 10-6, just a half-game behind the Cleveland Guardians in the AL Central. Naturally, as the resident spoilsport of the baseball analytics community, my job is to dig into the unexpected and see if it has some meat on its bones. And the Royals winning the division would definitely count as unexpected. Justin Mason was the only member of our staff to pick them to win the Central before the season started, while our playoff odds had KC with about a 1-in-14 chance to stand atop the division; ZiPS was even lower, pegging them at a 5.9% chance of taking the division. Read the rest of this entry »
How would the Norfolk Tides do if they played in the majors? That might sound like an odd question, but it’s one that I’ve been asked four times in the last week. It even came up on Reddit. What’s driving this curiosity isn’t a sudden surge in rabid Tides fandom, but rather the heavy concentration of offensive talent the Orioles have in Norfolk, which until today, included one of the favorites for AL Rookie of the Year, Jackson Holliday. And since I’m one of a handful people with the exact tools of nerdery to answer this query, I couldn’t let it go unanswered. Read the rest of this entry »
A month after signing starting pitcher Brayan Bello to a six-year extension, the Boston Red Sox are at it again, this time extending rookie center fielder Ceddanne Rafaela on an eight-year deal worth $50 million. If Rafaela sticks in the majors long enough this season to earn a year of service time, this extension will prolong his free agent eligibility for two years; either way, he’ll be paid a guaranteed salary through the 2031 season.
How you feel about Rafaela comes down to just what you think about his defense. Eric Longenhagen and Tess Taruskin rated Rafaela as the only prospect on THE BOARD last year with a 70 present value for defense and the only one with a future value of 80. They were hardly alone in their praise for his glove, either, as other outlets such as Baseball Prospectus and MLB Pipeline also gave complimentary reviews to his leathercraft.
While prospect writers have occasionally missed on the eventual defensive performance of prospects – Gregory Polanco comes to mind – Rafaela certainly hasn’t shown anything in his limited time in the majors that refutes these views. Measuring minor league defense, as opposed to viewing it, is fraught with obvious peril, but the defensive estimates that ZiPS uses for minor leaguers also love his glove. ZiPS uses a Total Zone-esque measure from Gameday hit locations, similar to Sean Smith’s methodology from nearly 15 years ago. Yes, we’d prefer to have something like OAA or DRS or even UZR for minor leaguers publicly available, but we don’t, so we have to generally be more conservative about conclusions drawn from the data. But for what it’s worth, these estimates, which I call zDEF, had Rafaela as an elite defensive center fielder in the minors in 2023.
Incidentally, zDEF had Rafaela at +3 as a shortstop total for his minor league career, so if the circumstances warranted it, it wouldn’t necessarily be the craziest thing to see him follow in the footsteps of another former Red Sox prospect, Mookie Betts, and move back to shortstop at some point, though that certainly is not why Boston signed Rafaela long term.
Let’s run the eight-year ZiPS for Rafaela.
ZiPS Projection – Ceddanne Rafaela
Year
BA
OBP
SLG
AB
R
H
2B
3B
HR
RBI
BB
SO
SB
OPS+
DR
WAR
2024
.258
.299
.424
517
78
134
28
9
13
77
24
134
20
101
8
2.2
2025
.254
.296
.413
520
74
132
26
6
15
63
25
133
18
97
8
2.2
2026
.258
.300
.423
527
77
136
27
6
16
65
26
128
18
101
8
2.4
2027
.258
.304
.424
528
79
136
27
5
17
67
28
124
17
102
8
2.5
2028
.258
.306
.425
527
80
136
27
5
17
67
30
120
16
103
8
2.6
2029
.258
.307
.423
523
80
135
27
4
17
66
31
117
14
102
7
2.5
2030
.256
.306
.416
515
78
132
26
4
16
64
31
114
13
100
7
2.3
2031
.256
.306
.418
500
75
128
25
4
16
62
30
112
12
101
7
2.3
All told, ZiPS would happily offer him an eight-year, $67 million — $17 million more than what the Red Sox gave him.
One thing to take into consideration: So long as Rafaela’s glove is excellent, he doesn’t need to take a big offensive step forward to be worth his contract. ZiPS has Rafaela hitting for a skosh more power, enough to get his OPS+ and wRC+ into the 100 range during his peak years, but not sufficient to make him a superstar. As a result, his projections keep him in the solidly above-average territory – he’ll likely have an All-Star appearance or two during an up year – but comfortably below star status. These offensive numbers make him slightly better offensively than the inevitable comp given for him, Jackie Bradley Jr., who put up a 93 OPS+ over parts of eight seasons in Boston and was a few runs better defensively than Rafaela’s projections. Suffice it to say, if ZiPS’s natural conservatism with minor league defensive numbers ends up lowballing Rafaela, he’d be a steal at this price and put up WAR numbers in the range of Kevin Kiermaier’s best years.
As an offensive player, Rafaela remains a work in progress. In nine games this season entering Tuesday, he’s hitting .233/.286/.400 with two triples and an 85 wRC+. He’s actually gotten better at making contact, going from a 69% contact rate at Triple-A last year to 73% in the majors so far. Admittedly, this improvement has come in a small sample — he’s made just 124 big league plate appearances combined between his 2023 late-season debut (72.1% contact in 89 PA) and this year (76.3% in his 35 PA) — but it is still encouraging.
That said, he remains far too aggressive at the plate, especially when you consider his specific profile as a hitter. Unlike his teammate Rafael Devers, who also swings at a pretty high rate of pitches out of the zone, Rafaela doesn’t hit the ball particularly hard; Devers has power to spare, so even though he doesn’t make as much hard contact on pitches out of the zone — his average exit velocity drops to 85.5 mph, down from 94.9 mph on in-zone pitches — he can still do damage. Rafaela doesn’t have that luxury. Instead, he is a speedster (ranking 28th in sprint speed this season among 202 qualified players) who plays his home games at Fenway Park, one of baseball’s best parks for batting average. He should be incentivized to have a more contact-oriented game than most other batters. His contact skills appear to be improving, but he won’t get the most out of his game if he keeps chasing pitches that’s he unlikely to hit.
The Betts trade and the departure of Xander Bogaerts are still, rightfully, pain points for Boston fans. But since then, the Red Sox seem to be making a better effort to retain the players they develop, first with the Devers extension in January 2023 and now with Bello and Rafaela. Ultimately, winning is the only thing that will make things better in Boston. Keeping Rafaela in town should be an important step toward that.
Last Friday, my colleague Michael Baumann (the one who doesn’t throw 97 mph) mused that the Orioles’ having an ace was a pretty sweet thing. I can’t help but concur with that thesis, considering I’ve long been saying that one of Baltimore’s missing ingredients was an inarguable no. 1 starter. Nor can I quibble with anything related to Corbin Burnes; I picked him to win the AL Cy Young, after all, and his debut with the O’s was a masterpiece of cruelty to hitters. But what if they already had an ace? Grayson Rodriguez spent a drizzly Saturday doing his best to show why that may be the case.
One can argue that I chickened out a bit about Grayson Rodriguez a few weeks ago when I did not pick him as one of my pitcher breakout choices. In truth, I kind of felt it was cheating since he’d already flashed some utter dominance late last year when he had a 2.58 ERA and a 2.76 FIP in 76 2/3 second-half innings, similar to the star-making stretch that Tarik Skubal enjoyed. ZiPS didn’t go all-in on Rodriguez in the preseason, mainly because there’s always a great deal of downside risk in a young pitcher (or an old pitcher or a pitcher in his prime or a pitcher in a box or with a fox or in a house or with a mouse).
After a rather middling spring, I was eager to watch Rodriguez in a regular season game this year to see how he continued to progress with the things that stymied him when he was first called up in 2023. The first few months of his rookie season, he had a kitchen sink approach, just throwing out all five of his pitches (fastball, changeup, curveball, slider, and cutter) with the apparent hope of baffling major league hitters with variety. Instead, hitters would wait him out, an effective strategy; he was throwing just over 50% first-pitch strikes at the time of his demotion in late May. The result was too many walks and too many at-bats that ended with a batter waiting for something to crush and then proceeding to do exactly that.
Upon returning to the majors after the All-Star break, Rodriguez’s portfolio had gotten another passthrough at the copy desk. The cutter, against which opposing hitters had slugged nearly .900 through May, was almost entirely edited out, and the focus was on primarily getting the fastball-change combination working before mixing in the curves and sliders. Rodriguez walked as many batters in the second half as he did in the first half despite throwing almost twice the innings. The culprit there was the reversal in his first-strike rate; he went from 54.5% in his first stint to 66.8% after his return. To contextualize the significance of that change, 54.5% would have been the second-worst seasonal number among the 44 ERA title qualifiers in 2023, while 66.8% would have been the sixth-best first-pitch strike percentage.
His first start of 2024 was a lot like his second-half starts last year. Rodriguez got off to 0-1 counts as if it were child’s play (77%) and heavily relied on his fastball and changeup. He enticed Angels hitters to swing at nearly two-thirds of his changeups — and they whiffed against 60% of them. The curveball had the identical contact percentage. The end result? Six innings, one run on four hits, one walk, one home runs, and nine strikeouts, matching his major-league high from a start last April against the Tigers.
The only real blemish to his record came in the fourth inning on Saturday, when he threw a first-pitch slider/cutter to Taylor Ward, who casually clubbed it for a solo home run. Rodriguez’s offering — which the broadcast tracked as a slider and Statcast deemed a cutter — did not have the sharpness of his main three pitches, and the fact that there was some disagreement about what pitch it actually was should tell us something about its ineffectiveness. Whatever you call it — and we won’t be combining the two names here — three of the seven he threw were put into play with exit velocities above 100 mph.
Now, the Angels are no doubt one of the weaker teams in baseball and Rodriguez’s start would have been more impressive against the Dodgers or Astros, but it was a continuation of what he accomplished in the second half last year.
So, what’s next for Rodriguez?
Compared to other low-payroll teams, the Orioles have not done a good job signing their best young players to long-term contracts. In fact, no player in Baltimore has a guaranteed deal beyond this season except for Félix Bautista, who’ll make $1 million in 2025. I’d argue that the two best starting pitchers the O’s have developed in the last 30 years were Mike Mussina and Kevin Gausman. The team low-balled Mussina after he had previously taken a hometown discount and the latter, well, they never really figured out what to do with him. Why not get serious about offering Rodriguez a long-term contract before he gets really expensive?
Let’s go back to the preseason projections. Even with ZiPS not fully on board with Rodriguez’s performance in the second half, the long-term projection and the projection percentiles were still about what you’d expect them to be for a talented young pitcher with massive upside.
ZiPS Projection – Grayson Rodriguez
Year
W
L
ERA
G
GS
IP
H
ER
HR
BB
SO
ERA+
WAR
2024
7
6
4.07
28
28
141.7
126
64
19
44
153
101
2.0
2025
7
6
3.98
28
28
142.3
125
63
18
42
149
103
2.1
2026
7
6
3.99
28
28
146.7
129
65
19
41
150
103
2.2
2027
7
7
4.02
29
29
147.7
129
66
19
41
149
102
2.2
2028
7
7
4.06
29
29
148.7
131
67
19
40
147
101
2.1
2029
7
7
4.15
28
28
145.3
130
67
19
39
140
99
1.9
2030
7
6
4.12
27
27
139.7
125
64
18
38
133
99
1.8
2031
6
6
4.19
26
26
133.3
119
62
17
37
126
98
1.7
ZiPS Percentiles – Grayson Rodriguez
Percentile
ERA+
ERA
WAR
95%
148
2.76
4.6
90%
134
3.06
3.9
80%
117
3.49
3.1
70%
110
3.74
2.7
60%
105
3.91
2.3
50%
101
4.07
2.0
40%
96
4.25
1.7
30%
91
4.49
1.3
20%
87
4.69
1.0
10%
81
5.03
0.5
5%
78
5.25
0.1
ZiPS suggests an eight-year, $57 million contract to buy out two years of free agency, and I think given the upside, you can certainly go higher than that. Just for fun, I took the ZiPS updated projection (with his first start) and the 70th percentile projection for the 2024 season and re-ran the long-term projection to get a not-too-aggressive estimate of what it could look like.
There’s a 30% chance that his projection next year will be as good as this or even better. A 3.6 WAR projection for a pitcher is nothing to scoff at; it would have ranked 11th in the ZiPS projections for pitchers this season.
The new O’s owner, David Rubinstein, has excited a lot of people in Baltimore with how he’s talked about the team. But even better than words would be action, and what better way to show a change from the late-stage Angelos era than to actually ensure that one of the team’s best young talents stays in Charm City past his free agent eligibility? It doesn’t necessarily have to be Grayson Rodriguez, but the team should consider him a serious option for an extension. If he develops like scouts and computers believe, he’ll surely be worth it.
The Minnesota Twins had a strong start to the season, taking two of three games against the Kansas City Royals. But the positive results came with the unfortunate revelations that Royce Lewis will miss at least the next month, and likely longer, with a severe right quad strain, and right-hander Anthony DeSclafani will miss the entire season after undergoing flexor tendon surgery.
If you want to know why the Twins finally defused all the jokes last fall by winning their first playoff games in more than two decades, Lewis is one of the best answers. After nearly four years of injuries kept him mostly off the diamond, Lewis finally returned last May, though he landed on the IL twice more in 2023; an oblique strain in early July cost him about month and a half, and a hamstring strain in the middle of September prematurely ended his regular season. Still, he raked whenever he was healthy, slashing .309/.372/.548 with a 151 wRC+ and 2.4 WAR in just 58 games (239 plate appearances). His flow of pure, unadulterated awesomeness continued in the postseason as he hit four homers in six games.
With the preseason hope that Lewis would get 581 plate appearances (per our Depth Charts), that was enough to project the Twins to rank fifth at third base in our positional power rankings. He got through the spring healthy and was in the Opening Day lineup for the first time ever, batting third and playing third. His 2024 debut was his career in microcosm: He blasted a no-doubt dinger in his first plate appearance, lined a single his second time up, and got hurt before he had a chance to bat again; that injury occurred almost immediately, while he was rounding second when the next batter, Carlos Correa, hit a double. Read the rest of this entry »
After all the rumors and money and projections, here we are, back at 0-0, with every team having at least some theoretical level of hope for the coming season. Beginning Thursday, actual games will turn these projections to shreds, but this is the best algorithmic projection I have the ability to make for 2024. Just a note that I have not committed an act of decimal cheating; ZiPS does not know that the Padres and Dodgers are 1-1.
The methodology I’m using here isn’t identical to the one we use in our Projected Standings, meaning there naturally will be some important differences in the results. So how does ZiPS calculate the season? Stored within ZiPS are the first- through 99th-percentile projections for each player. I start by making a generalized depth chart, using our Depth Charts as a jumping off point. Since these are my curated projections, I make changes based on my personal feelings about who will receive playing time as filtered through arbitrary whimsy my logic and reasoning. ZiPS then generates a million versions of each team in Monte Carlo fashion (the computational algorithms, that is — no one is dressing up in a tuxedo and playing chemin de fer like James Bond).
After that is done, ZiPS applies another set of algorithms with a generalized distribution of injury risk that changes the baseline PAs/IPs for each player. Of note is that higher-percentile projections already have more playing time than lower-percentile projections before this step. ZiPS then automatically (and proportionally) fills in playing time from the next players on the list to get to a full slate of plate appearances and innings. The model’s had a lot of updates since the pre-spring projections, so probabilities may have moved slightly more than you might have expected from the changes in wins.
The result is a million different rosters for each team and an associated winning percentage for each of those million teams. After applying the new strength of schedule calculations based on the other 29 teams, I end up with the standings for each of the million seasons. This is actually much less complex than it sounds.
The goal of ZiPS is to be less mind-blowingly awful than any other way of predicting the future. The future is tantalizingly close but beyond our ken, and if anyone figures out how to deflect astrophysicist Arthur Eddington’s arrow of time, it’s probably not going to be in service of baseball projections. So we project probabilities, not certainties.
Over the last decade, ZiPS has averaged 19.7 correct teams when looking at Vegas preseason over/under lines. I’m always tinkering with methodology, but most of the low-hanging fruit in predicting how teams will perform has already been harvested. With one major exception, most of ZiPS’ problems now are about accuracy rather than bias. ZiPS’ year-to-year misses for teams are uncorrelated, with an r-squared of one year’s miss to the next of 0.000562. Now, correlations with fewer than 20 points aren’t ideal, but the individual franchise with the highest year-to-year r-squared is the Mariners at 0.03, which isn’t terribly meaningful. If you think that certain franchises have a history of predictive over- or underperformance, you thought wrong, and I’d bet it’s the same for the other notable projection systems.
If you want to check out the pre-spring projections, which talk about the biggest things to happen up to that point, here are the links to the AL and NL projections. Since it has been requested, for these official 2024 projections, I’ve also added 80th and 20th percentile win totals to the standings tables.
ZiPS Projected Standings – AL East
Team
W
L
GB
Pct
Div%
WC%
Playoff%
WS Win%
80th
20th
Baltimore Orioles
91
71
—
.562
37.2%
34.8%
72.1%
8.8%
99.0
82.2
New York Yankees
87
75
4
.537
24.1%
35.2%
59.3%
5.2%
95.8
78.7
Toronto Blue Jays
87
75
4
.537
22.4%
35.9%
58.3%
5.0%
95.3
78.7
Tampa Bay Rays
83
79
8
.512
11.9%
29.2%
41.1%
2.3%
91.1
74.4
Boston Red Sox
77
85
14
.475
4.4%
17.5%
22.0%
0.7%
85.9
69.2
Since the last set of projections, the movement here can mostly be attributed to starting pitching. Corbin Burnes provides a huge boost to the Orioles, but some of the benefit of his addition is negated because of less optimistic innings totals for the injured John Means and, more significantly, Kyle Bradish. The injury to Yankees ace Gerrit Cole diminishes their outlook a bit, though they still have the American League’s third highest playoff probability. Lucas Giolito wasn’t expected to pitch the Red Sox to the postseason, but his injury makes a Boston playoff berth even less likely.
ZiPS Projected Standings – AL Central
Team
W
L
GB
Pct
Div%
WC%
Playoff%
WS Win%
80th
20th
Minnesota Twins
86
76
—
.531
41.8%
15.7%
57.5%
4.5%
94.1
77.0
Cleveland Guardians
85
77
1
.525
38.4%
16.6%
55.1%
3.9%
93.3
76.7
Detroit Tigers
78
84
8
.481
13.2%
11.6%
24.8%
0.8%
85.8
69.3
Kansas City Royals
73
89
13
.451
5.9%
6.5%
12.5%
0.2%
81.4
65.0
Chicago White Sox
63
99
23
.389
0.6%
0.8%
1.5%
0.0%
71.5
54.8
People might still be shocked to see the White Sox with a 1.5% chance of making the postseason, but one of the things I’ve learned after doing this for 20 years is that people – even the most sophisticated ones – tend to underrate how often improbable things happen. Luckily, with so many years in the books, I’ve had the ability to do a lot of calibration! In most simulations, the division features a fairly tight race between the Twins and Guardians for the title and the Tigers finishing third. And because the Central is relatively weak, a Royals playoff appearance would be unlikely but not unreasonably so.
ZiPS Projected Standings – AL West
Team
W
L
GB
Pct
Div%
WC%
Playoff%
WS Win%
80th
20th
Houston Astros
88
74
—
.543
37.0%
26.2%
63.2%
6.3%
96.5
79.4
Texas Rangers
86
76
2
.531
28.4%
27.0%
55.5%
4.5%
94.4
77.6
Seattle Mariners
86
76
2
.531
27.4%
27.3%
54.7%
4.3%
94.0
77.6
Los Angeles Angels
77
85
11
.475
6.9%
14.7%
21.6%
0.7%
85.6
68.7
Oakland A’s
63
99
25
.389
0.2%
0.9%
1.1%
0.0%
71.6
54.7
The big change here is a slightly more negative distribution of the innings for Astros pitchers, narrowing their lead over the Rangers and Mariners. I appreciate ZiPS’ bringing the M’s just that much closer to the Seattle Mariners .540 meme. The A’s now project to finish a fraction of a win ahead of the White Sox in the AL basement, which is some kind of victory, I guess.
ZiPS Projected Standings – NL East
Team
W
L
GB
Pct
Div%
WC%
Playoff%
WS Win%
80th
20th
Atlanta Braves
95
67
—
.586
62.6%
21.4%
84.0%
15.2%
103.3
86.0
Philadelphia Phillies
85
77
10
.525
17.9%
33.4%
51.2%
3.7%
93.3
76.7
New York Mets
83
79
12
.512
12.9%
28.2%
41.1%
2.3%
91.2
74.0
Miami Marlins
79
83
16
.488
6.3%
20.2%
26.6%
1.0%
87.1
70.4
Washington Nationals
66
96
29
.407
0.3%
2.0%
2.3%
0.0%
74.1
57.4
ZiPS does give the Braves a 1% chance at winning 116 games! Atlanta lost a bit in the probabilities because of some changes in the generalized playing time model that fills in the backups. Even if ZiPS sees the playoffs as a bit less certain for this team than it did six weeks ago, the Braves still have the highest projected win total in the majors. The Marlins took a sizable hit after some negative injury news, a pretty big deal for them since the pitching staff is their source of upside. It sure ain’t the hitting!
ZiPS Projected Standings – NL Central
Team
W
L
GB
Pct
Div%
WC%
Playoff%
WS Win%
80th
20th
St. Louis Cardinals
83
79
—
.512
27.8%
16.0%
43.8%
2.6%
90.7
74.4
Chicago Cubs
82
80
1
.506
27.9%
15.6%
43.5%
2.5%
91.0
74.2
Cincinnati Reds
80
82
3
.494
20.8%
14.3%
35.1%
1.6%
89.0
71.6
Milwaukee Brewers
78
84
5
.481
14.7%
12.6%
27.3%
1.0%
86.8
70.0
Pittsburgh Pirates
75
87
8
.463
8.9%
9.0%
17.9%
0.5%
83.7
67.3
ZiPS loves Pete Crow-Armstrong and is suspicious of Cody Bellinger matching his 2023 numbers, but bringing him back was still enough to push the Cubs into a near-statistical tie in what was already projected to be a very close race. The Brewers took a hit with the loss of Burnes, and as a result, they slightly boosted the projections for the other four teams in the division.
ZiPS Projected Standings – NL West
Team
W
L
GB
Pct
Div%
WC%
Playoff%
WS Win%
80th
20th
Los Angeles Dodgers
93
69
—
.574
49.3%
29.7%
79.0%
11.9%
101.1
84.2
Arizona Diamondbacks
86
76
7
.531
20.5%
34.9%
55.5%
4.4%
94.4
77.8
San Francisco Giants
85
77
8
.525
17.2%
32.1%
49.4%
3.4%
93.2
76.1
San Diego Padres
83
79
10
.512
12.7%
28.5%
41.2%
2.3%
91.3
74.0
Colorado Rockies
67
95
26
.414
0.2%
1.9%
2.1%
0.0%
74.5
59.0
The NL West contenders fighting with the Dodgers – which means the three other teams that are not the Rockies – all received a boost because, since the pre-spring projections, they each added one of the top starting pitchers available, either in free agency or via trade, this offseason. The Diamondbacks, Giants, and Padres are better after having acquired, respectively, Jordan Montgomery, Blake Snell, and Dylan Cease, but the moves haven’t changed the relative positions of these teams in the projected standings. Even so, these deals — along with San Francisco’s signing of Matt Chapman — have created more scenarios in which the Dodgers can be bested for the divisional title, though they remain the favorites.
One thing you see a lot on social media, especially from sites that repost these projections, is outrage that “the best team will only have X wins.” The Orioles are projected to have the best record in the AL, at 91-71, but that doesn’t mean that ZiPS projects 91 wins to lead the AL. Those 91 wins represent Baltimore’s 50th percentile performance in those million simulations, and it is astronomically unlikely that all 30 teams hit their 50th-percentile projections. On average, you should expect three teams to hit their 90th percentile, six to hit their 80th, nine to hit their 70th, and so on and so forth. But again, it’s rarely going to be that neat. So here’s the percentile matrix for the number of wins it would take to secure each of the six playoff spots.
After wrapping up our position player rankings with the league’s designated hitters, we turn our attention to the pitchers, starting with the bullpens in the bottom half of the reliever rankings.
One of my favorite jokes, which I’ve probably beaten into the ground at this point, is that there are three teams a year whose fans think they have a great bullpen, while those who root for the 27 other clubs are convinced that their team’s bullpen is the worst in baseball history and the primary reason they aren’t going to win the World Series. Read the rest of this entry »
Earlier today, Michael Baumann gave an accounting of the league’s shortstops. Now we turn our attention to the third basemen.
Welcome to the ultimate tweener position. Like shortstop, the hot corner was a glove-first position in the early days of baseball, but it has evolved to the point where it’s hard to be competitive if you don’t offer something with both the glove and the bat. This kind of hybridization has probably hurt third basemen in their quest for legendary status. Baseball’s classic ways of evaluating talent — Triple Crown stats and Gold Gloves/defensive reputation — tend to diminish well-rounded players without a single standout skill to point to, creating a very high bar for third basemen to get attention. Measures like WAR can remedy this problem by putting one estimate on a player’s total contribution, but even with an increased focus on WAR-type measures, eight of the top 20 third basemen by Jay Jaffe’s JAWS who are eligible for the Hall of Fame (and who are without PED whispers) aren’t enshrined in Cooperstown. Contrast that with first base, where only on player in the top 20 isn’t in the Hall (Keith Hernandez). Hitting a bit worse than first basemen and fielding a bit worse than shortstops aren’t great plaudits for your sizzle reel. Read the rest of this entry »
With the start of the season just two weeks away, it’s time for one of my most beloved/hated/dreaded annual traditions: making my picks for breakouts and busts. For those of you who haven’t read one of these pieces in the past, these are my picks for the players who are the most likely to change the general consensus about them over the course of the 2024 season. And since we’re talking about generally low-probability outcomes — this isn’t a list of players with better or worse projections than last year — there’s no exercise with more potential to make me look super smart… or dumb. For every J.P. Crawford or Steven Kwan triumph, there’s an instance of Andrew Vaughn-induced shame.
As usual, let’s start with a quick table of the triumphs and humiliations of last year’s picks:
It was about an average year. Vaughn and Christian Walker were the biggest misses, and Jordan Walker’s lousy defense kept him from being a win. Now on to this year’s picks.
The Breakouts
Spencer Torkelson, Detroit Tigers Spencer Torkelson’s .233/.313/.446 line certainly didn’t knock any socks off, but he was a (relative) beast over the last two months of the season, hitting .244/.329/.526 with 16 homers. Now, I always warn folks to not read too much into monthly splits because there’s a tendency to think that splits coinciding with a good explanation are enough to overcome the small sample size issues, and because the endpoints are selective. The two-month split, however, isn’t why Torkelson’s here. Rather, there was a lot of evidence to suggest that he was underperforming his peripherals for most of the season up until that point. From the beginning of the season through August 8, Torkelson was the biggest zStats underachiever with significant playing time. Using only Statcast data with no information as to actual results, ZiPS thought that in that span Tork should have been an .868 OPS hitter; his actual OPS was .688. His OPS after that day? .921! Remember, Torkelson was a top-five prospect in baseball entering his rookie season in 2022, so even though his first year was a disaster, he’s not some 31-year-old beer leaguer coming out of nowhere.
Patrick Bailey’s Bat, San Francisco Giants
I can’t really call it a full breakout since Patrick Bailey already had an overall breakout season, thanks to defense that crushed even the loftiest of expectations. What puts him here is that people may be sleeping on his bat. No, I don’t think there’s any chance he starts hitting like Buster Posey, but Bailey’s otherworldly defense and lackluster bat (wRC+ of 78) appears to have pigeonholed him as a typical no-hit, all-glove backstop. I think that would be a mistake. Catchers have really weird developmental curves and I can’t stress enough how difficult it is for a catcher to nearly skip the high minors; he only played 28 games above A-ball before debuting in San Francisco. He hit .251/.351/.424 in the minors – again, not star quality but far from a total zero – and even without full developmental time offensively, he wasn’t completely destroyed by MLB pitching. In fact, he showed surprisingly solid plate discipline and power for a prospect with so little experience with the bat. Both ZiPS and our Depth Charts project Bailey to have an 82 wRC+, but I would not be shocked if he finished the season with a mark between 95 and 100, which, if his defense holds up, would make him an elite catcher overall.
Wyatt Langford, Texas Rangers
I don’t have a formal rule about it, but when ZiPS projects a player with little or no MLB experience to lead in a significant stat, I should take it very seriously since ZiPS doesn’t often go nuts about minor leaguers. The last player I can think of is Luis Arraez, who had a 21% chance of hitting .300 for his rookie season, according to ZiPS, which also projected him to have the highest batting average in baseball by 2020. ZiPS thinks Wyatt Langford is going to lead the majors in doubles and be one of the best offensive rookies in recent years. He was one of the few college hitters that ZiPS saw as nearly ready for the majors in 2023, and it liked him more than similarly advanced hitters Nolan Schanuel and Dylan Crews. Since ZiPS is my sidekick – or maybe it’s the other way around – I gotta have its back!
Anthony Volpe, New York Yankees Anthony Volpe had a solid rookie season, but given his elite prospect status, it was a mild disappointment that he was only league average. Because of this, I think people are now underselling his offensive upside. He hit for a lot of power for a 22-year-old shortstop (21 home runs, .174 ISO). He also stole 24 bases on 29 tries, including successfully swiping each of his first 15 attempts, and was worth 3.5 base running runs. Two of his biggest problems were that he didn’t get on base enough (.283 OBP, 8.7 BB%) and struck out too much (27.8 K%), but these weren’t issues for him in the minors, and some of his fundamentals here are promising — he actually gets off to fewer 0-1 counts than most players with his strikeout rate. All of this suggests that he should figure things out with more major league experience. ZiPS also thinks he should have had a .312 BABIP given his Statcast data, instead of his actual mark of .259, which indicates that some of his woes were likely do to bad luck.
Keibert Ruiz, Washington Nationals
As with Volpe, I think Keibert Ruiz’s low BABIP, especially his .223 BABIP in the first half, made his season look a lot weaker than it was. ZiPS saw a .270 BABIP as a more reasonable number for him as a hitter in the first half, and that number continued to rise in the second half; he had a .285 zBABIP by the end of the season. Giving Ruiz back some of the batting average makes his actual .226/.279/.360 first-half line look a lot less abysmal and his .300/.342/.467 one in the second half look less like a fluke. In fact, except for a bit more power, most of the difference between his first half and second half was BABIP, so the halves weren’t quite as different as they appeared. Overall, his zStats line of .274/.330/.445 reflects a much more advanced hitter than we saw overall in 2023.
As I reminded people with Bailey, catchers tend to have a weird developmental pattern, and Ruiz has been no exception. Ruiz was a top prospect for a long time before hitting the Double-A wall, and his standing fell quite a bit in the eyes of prospect watchers. But he re-established himself as a top prospect to a degree that he was a huge part of Washington’s return when it traded Max Scherzer and Trea Turner to the Dodgers in 2021. I think people forget how young he still is at 25, and being older is not as big of a deal for a catching prospect than for someone at any other position.
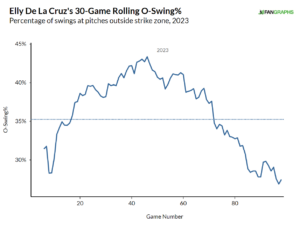
Elly De La Cruz, Cincinnati Reds Elly De La Cruz is a common breakout pick for obvious reasons, but I’m including him here specifically because his plate discipline wasn’t as bad as it looks from the raw stats. ZiPS actually thought, from his plate discipline data, that his strikeout rate should have been more like 27% instead of nearly 34%, enough to knock off 27 strikeouts. And given that he should be a high BABIP player, because he was the fastest man in baseball last year, putting more balls in play would benefit him more than it would most players. Overall, his zStats line last year was .273/.323/.449, compared to his actual line of .235/.300/.410, meaning the holes in his game aren’t quite as deep as his reputation would suggest.
And if you don’t buy that, he did show better plate discipline as the season progressed. I’ll again warn of the dangers of storylines that coincide with splits, but things like offensive swing percentage stabilize very quickly, mitigating some of the sample size issues. I don’t think it’s a stretch to look at the graph below and conclude that De La Cruz got caught up in the hype of his initial success and became too aggressive. As a result, he started struggling before coming to realize that he had gotten away from the approach that made him such a dynamic player in the first place.
Dominic Canzone, Seattle Mariners
One should be suspicious of Pacific Coast League stats, but Dominic Canzone’s .354/.431/.634 line last year was good even by PCL standards, enough for a 151 wRC+ in the league. However, that success didn’t follow him to the majors. He probably doesn’t have a lot of upside, but the rate of his improvement over the last couple of years suggests that there’s a chance he could have a nice little Geronimo Berroa-esque run.
Tucupita Marcano, San Diego Padres
This one is kind of a stretch because I don’t see an obvious path for Tucupita Marcano to get much playing time. He hasn’t hit at all in the majors yet, but he’s also had a weird minor league career; he’s still just coming off his age-23 season and has made some progress at translating his minor league plate discipline to the majors. ZiPS isn’t in on him, but Steamer is, and if he can managed his 94 wRC+ Steamer projection, along with a decent glove (though more at second base than short) and his speed, he’ll at least be interesting. Gotta have one out there pick, no?
The Busts
Cody Bellinger, Chicago Cubs
I don’t think Cody Bellinger will fall anywhere near the depths of his brutal 2021 season, but there are reasons to be suspicious of last year’s resurgence. He changed some of his mechanics and altered his approach, especially in two-strike counts, to make more contact, and those adjustments should be sustainable. It’s the power numbers that are a bit preposterous, to the degree I can’t think of any comparable player who managed to maintain this amount of power with mediocre-at-best exit velocity numbers. Statcast’s expected slugging percentage knocks 88 points off his actual one, and the ZiPS version (zSLG) is 20 points meaner than that.
J.T. Realmuto, Philadelphia Phillies
This one hurts, especially for a player ZiPS was so excited about in 2015-2016 before his breakout. But the decline in J.T. Realmuto’s offensive numbers in 2023 is supported by the drop in his peripheral numbers; he was just a bit worse at everything last year. He’s also a catcher entering his mid 30s. This is a gut thing more than a projection thing, but I suspect any kind of a leg injury would be a bigger deal for a surprisingly quick player like Realmuto, whose offensive stats already reflect his speed, than for your typical catcher.
Isaac Paredes, Tampa Bay Rays Isaac Paredes is a good hitter, but is he really a 140 wRC+ guy? In both Statcast and ZiPS, Paredes had an even larger disparity between his actual power numbers and his peripherals than Bellinger. That said, there’s some good news, because unlike Bellinger, Paredes has done this before. There were 20 hitters in 2022 that hit at least five more homers than zHR expected, and 18 of them went on to hit fewer home runs in 2023. Paredes was one of the two who hit more (the other was Pete Alonso). Because Paredes has such a low hard-hit percentage, I’m not completely on board yet.
Lane Thomas, Washington Nationals
One thing about Cinderella stories is that people tend to overrate them after the ball. Most of these stories don’t involve permanent stardom; Joey Meneses and Frank Schwindel are two example of people getting too excited about an older breakout guy. Unlike Schwindel, Lane Thomas is probably still a league-average player, on the level of his 2021 and 2022 seasons, but I’d be shocked to see him hit 30 homers again. He’s probably a stopgap center fielder/fourth outfielder type, and I’m seeing him surprisingly high in some fantasy rankings.
Dominic Fletcher, Chicago White Sox
I was pretty shocked to see the White Sox trade Cristian Mena for Dominic Fletcher, even with the assumption that ZiPS is being too exuberant about Mena in ranking him at the back of the top 50 prospects. If you evaluate him the way our prospect team does, a fourth outfielder for a 45 FV prospect is quite a rich gain. And it’s looking like the Sox will give Fletcher a pretty good chance at getting the majority of the playing time in right field. It’s not as bad as the team’s irrational excitement about Oscar Colás last year, but there’s just not a lot of support for Fletcher’s maintaining his .301/.350/.441 line from his brief stint in the majors. That’s ridiculously higher than his zStats slash line of .249/.290/.376, which works out to a difference of 125 OPS points.