Rays, Dodgers, Braves Top List of Playoff Teams with Bad Injury News

Injuries are always unwelcome, but the pumpkin spice season is perhaps the most unfortunate time of year to lose a player to one. A surprise malady at this point in the season can shut a player out of some, if not all, of the postseason, and with no ability to make trades and playoff eligibility freezing at the beginning of September, it’s especially challenging to fill holes on the big league roster. This weekend featured some particularly bad injury news for playoff teams, as a number of players who can’t be easily replaced saw their postseason outlook take a turn for the worse.
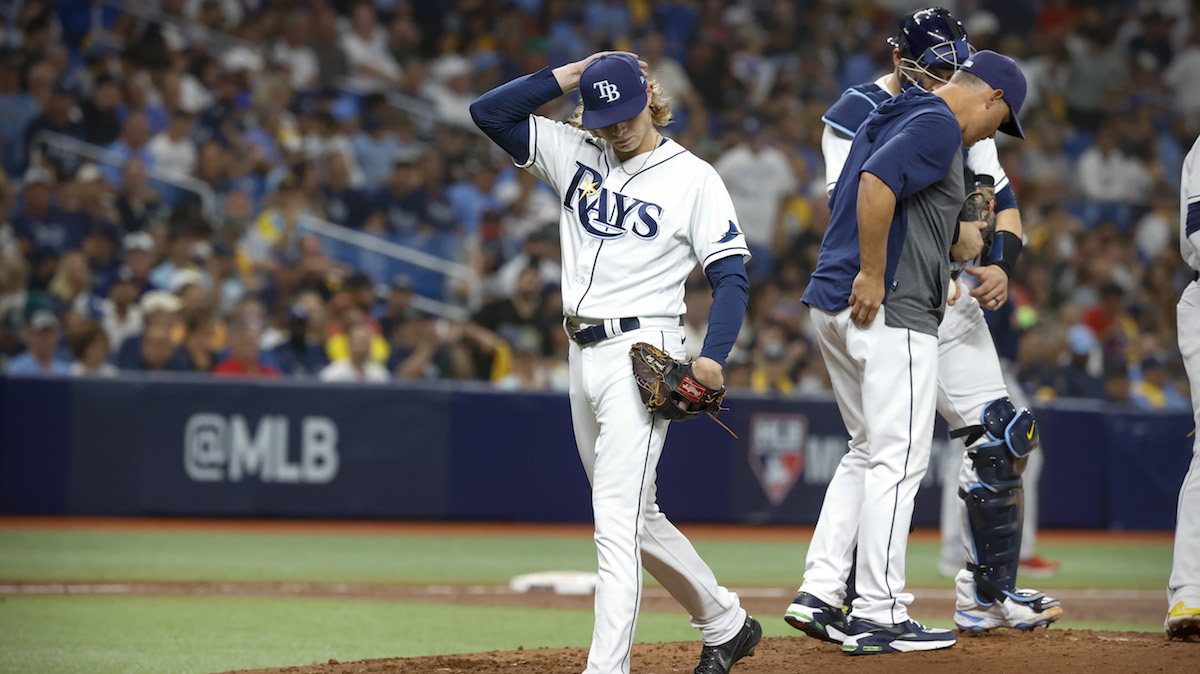
Let’s take stock of what these injuries might mean come October, beginning with the Tampa Bay Rays, who got the worst bit of news. Shane Baz needs Tommy John surgery, and since we’re so late in the season, 2023 is off the table for his return as well. Until this setback, Baz’s recovery from his most recent elbow problem seemed to be going well, and the team had held out hope that they’d be able to get him up to speed enough to at least pitch in relief. With Baz out, the Rays will have to rely more on Tyler Glasnow, who is expected to be activated on Wednesday in his return from a Tommy John surgery of his own.
The bad news in Tampa didn’t stop with Baz. Brandon Lowe’s back problems have ended his 2022 season early. While (hopefully) not as significant as Baz’s injury, Lowe has struggled with back pain for most of the season and recently had a cortisone injection. As with Baz, the hope had been to get him back on the roster in time for the playoffs. Even with his struggles this year, which were due in large part to the aforementioned injury, ZiPS still thinks Lowe’s bat has the most upside of nearly anyone on the team, and the Rays will take a small but significant hit in the postseason projections in his absence. Without Baz and Lowe, ZiPS thinks of the Rays as a .547 team rather than a .553 one, with their solid depth keeping things from being far worse. The full version of ZiPS projects Lowe’s primary replacement, Jonathan Aranda, at a 105 wRC+ for the rest of the season, a significant bump from his 90 wRC+ projection before the season. Read the rest of this entry »


