Author Archive

Will the New “Year of the Pitcher” Crown a New ERA Champion?

Jacob deGrom‘s already microscopic ERA needs even a stronger microscope to spy it after his outing Monday, a six-inning shutout against the Arizona Diamondbacks that lowered his ERA to 0.71. We’re no longer in April, and we’re not even in May, so this new level of dominance can’t be easily ignored as the product of a small sample. Once performance of this magnitude reaches June intact — and 0.71 is deGrom’s second-highest seasonal ERA after the end of an outing — you have to seriously give at least a thought to the prospect of a pitcher making a run at Bob Gibson’s live-ball ERA record.

We had a chance at this happening last year, thanks to the asteriskesque 2020 season and its 60-game slate, shortened as a consequence of COVID-19. I talked about the possibility going into last season, with ZiPS projecting a one-in-four shot of someone catching Gibson’s 1.12. Nobody did it in the end, but Shane Bieber’s 1.63 was the one of the best ERAs for a qualifying pitcher since Gibson’s in 1968. Bieber and Trevor Bauer, the two pitchers who came closest, fell well short of Gibson but given the relatively high levels of league offense, their efforts were enough to get them the third and fourth spots on the all-time single-season ERA+ ranks.

Catching Gibson in a 60-game season would have been an accomplishment, but not really a full one. Records are naturally set in conditions that benefit players, and Gibson was no exception: 1968 was dubbed the Year of the Pitcher thanks to a league ERA of 2.98, nearly a half-run lower than any season since the spitball was banned. Gibson’s 258 ERA+, which takes into account league offense, still sits atop the leaderboard, but at least it doesn’t utterly wreck the recent field, which consists of Pedro Martinez (243, 1999), Roger Clemens (227, 1997), and Zack Greinke (227, 2015) among others.

But since 2021 is a full 162-game season, catching a 1.12 ERA would feel a lot less like sneaking in through a loophole. A significant drop-off in league offense (to a 4.02 ERA) could be credited for an assist, but it’s not a number that is unfair relative to baseball history. So, can he do it?

deGrom has missed a few starts so far in 2021, with no apparent ill results to his performance, and the Mets have been cautious with his pitch totals; he’s averaged fewer than 70 pitches in his last three starts. That’s beneficial to his chances, as no star pitcher has a long-term ability to keep their ERA that low, even Gibson; just clearing the one-inning-per-team-game requirement optimizes things. deGrom will likely end up with around 30 games started this season, so a good place to begin in gauging his odds is to see if anyone’s come close to 1.12 in a span of 30 games starts, crossing over seasons, since 1920. I’m only listing unique 30-game runs since there is naturally quite a bit of overlap in runs:

Best ERA for Qualifying Pitchers in 30-Game Spans (Since 1920)
Pitcher Year(s) W L ERA IP
Bob Gibson 1967-1968 20 6 0.94 267.0
Jake Arrieta 2015-2016 25 1 1.13 215.0
Roger Clemens 1990-1991 22 4 1.30 228.3
Carl Hubbell 1933-1934 17 8 1.30 215.3
Clayton Kershaw 2015-2016 19 3 1.32 225.3
Dwight Gooden 1985 22 1 1.33 243.3
Pedro Martinez 1999-2000 20 4 1.34 221.0
Luis Tiant 1967-1968 20 6 1.34 228.7
Vida Blue 1970-1971 21 3 1.36 244.7
Jacob deGrom 2018-2019 10 9 1.40 205.0
Dean Chance 1964 17 6 1.40 225.7
John Tudor 1985-1986 23 1 1.41 242.0
J.R. Richard 1979-1980 19 6 1.44 225.7
Bobby Shantz 1951-1952 26 4 1.44 262.3
Max Lanier 1943-1944 17 5 1.47 202.7
SOURCE: Baseball-Reference

Gibson’s best 30-game span was even better than his 1.12 ERA, dipping under one. J.R. Richard’s presence on this list is especially cruel, as his 30-game span ended with the final game of his major league career. Before Richard’s next start, he suffered a stroke caused by a blood clot, and while he attempted a comeback a few years later in the minors, he was no longer the same pitcher.

Nobody catches 1.12 on this list, but many come close enough that the result is at least plausible. Jake Arrieta was only a run from accomplishing the feat. deGrom himself appears on this list, his 30-game span running from April 21, 2018, through April 3, 2019. His 1.40 ERA over 30 starts comes out to an ERA+ of 266 in a higher run environment (by about a tenth of a run) than 2021 so far. A tenth of a run isn’t a lot, but to break a record like this, every advantage helps. Yes, Mets fans, I see that 10-9 record for deGrom over that stretch.

To get an idea of deGrom’s probability of finishing with an ERA of 1.12 or better, I worked with a technique I’ve used in the past, which “simulates” a season using Monte Carlo algorithms and a smoothed model of a pitcher’s starts based on their projections and historical usage. At 189.2 innings (what he has in the bag, plus the 22 starts of 6.3 innings per start in his depth chart projections), he needs to allow 23 or fewer runs or a 1.23 ERA for the rest of the season. At 162 total innings, he’d have to maintain a 1.30 ERA the rest of the way.

deGrom’s no slam-dunk to catch Gibson, but he’s got a fighting chance, with my model estimating a 3.1% chance to beat a 1.12 ERA, or more precisely, Gibson’s 1.122538 (no cheating with rounding here!). That’s about 31-to-1, a little better than getting the exact number in roulette and roughly the probability of a 20-homer hitter getting a round-tripper in any given at-bat. In other words, it’s more likely than not that he falls short of the feat, but it’s definitely possible and firmly in the realm of plausibility.

Jacob deGrom is having the best run of his career and quickly developing a Hall of Fame case based on Koufax-levels of peak performance. Catching Bob Gibson would be a fantastic sentence on a plaque in Cooperstown. Hopefully, the Mets’ offense has the decency to give him more than 10 wins if it should come to pass!


Marcell Ozuna Slides Onto the Injured List

The Braves are short one outfielder for at least six weeks, with Marcell Ozuna placed on the IL after injuring two fingers on his left hand while sliding into third against the Red Sox on Tuesday night. It wasn’t immediately obvious whether Ozuna would miss significant time, with manager Brian Snitker telling the press that the two-time All-Star was going back to Atlanta for tests, but with Wednesday came the news that his stay on the shelf would be a long one.

Ozuna has gotten off to a poor start in 2021, hitting .213/.288/.356 in just over 200 plate appearances, for a 79 wRC+ and -0.1 WAR — a major disappointment for a player coming off an OPS of 1.067 last season. It wouldn’t be the first time he had a bit of a letdown year after what seemed to be a breakout campaign, as was the case with his two seasons in St. Louis, but at least he hit for enough batting average then to be a league-average player in a corner outfield position.

Atlanta hasn’t received much production from Ozuna, but there were several reasons to think that his overall lines would recover. His power numbers are down from past seasons, but he’s partially compensated for that with some of the best plate discipline of his career. ZiPS thought his BABIP of .244 should have actually been more like .298 from his contact data, and Statcast saw similar underperformance, with an xBA of .268 and an xSLG of .471, both numbers more in line with his typical showing. A repeat of 2020’s 179 wRC+ was always unreasonable, but even with this early slump, his Depth Chart-projected wRC+ was still at the 123 it was back in March.

Ozuna suffered a similar injury in 2019, breaking the middle and ring fingers on his right hand while sliding during a pickoff attempt. It probably won’t assuage the worries of Braves fans that he went from an .847 OPS before that injury to a .729 OPS after returning, but I wouldn’t worry much about this limited precedent. I haven’t found much underperformance in hitters returning from broken fingers, and month-to-month play is quite volatile without any injury-based explanations involved. Short of significantly worse news, I wouldn’t be especially concerned about Ozuna after he returns, probably at or near the All-Star break. At least he can take it as consolation that he broke his fingers doing actual baseball things, unlike Zach Plesac, who suffered a broken thumb taking off his shirt.

Read the rest of this entry »


Dan Szymborski FanGraphs Chat – 5/27/21

12:03
Avatar Dan Szymborski: IT IS CHAT TIME

12:03
J: More likely to be moved by the deadline: Haniger or Seager?

12:03
Avatar Dan Szymborski: Haniger

12:03
CeddyBReady: So, all it took was giving up on hitting righty to get my stuff together.  Can you comment on how a change in handedness will impact the projection for Ceddy Mullins going forward?  Viva la Switchies!

12:03
Avatar Dan Szymborski: It should have some impact in season-to-season. less so in-season since it’s a simpler model

12:06
Avatar Dan Szymborski: You see switch-hitters with platoon splits give it up from time to time

Read the rest of this entry »


Pitcher zStats at the Quarter-Mark

Not everyone is interested in projecting the future, but one common thread in much of modern analytics in this regard is the attempt to describe a volatile thing, such as a play in baseball, using something less volatile, such as an underlying ability. This era arguably began with Voros McCracken’s DIPS research that he released 20 years ago to a wider audience than just us usenet dorks. Voros’ thesis has been modified with new information, and people tend to say (mistakenly) that he was arguing that pitchers had no control over balls in play, but DIPS and BABIP changed how we looked at pitcher/defense interaction more than any peripheral-type of number preceding it.

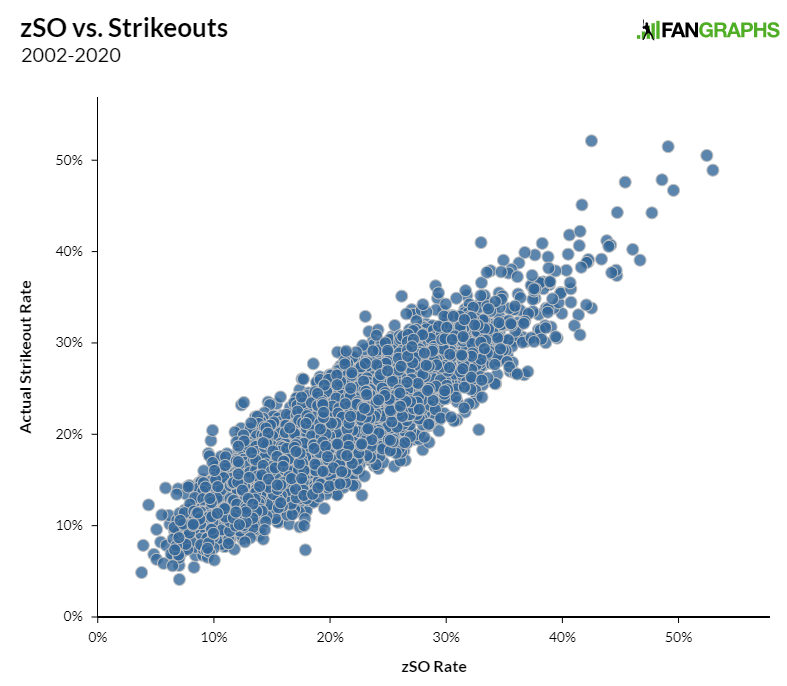
One of the things I want to try to project is what types of performance lead to the so-called Three True Outcomes (home run, walk, strikeout) rather than just tallying those outcomes. For example, what type of performances lead to strikeouts? I’m not just talking about velocity and stuff, but the batter-pitcher interactions at the plate — things like a pitcher’s contact percentage, which for pitchers with 100 batters faced in consecutive years from 2002 has a similar or greater r^2 to itself (0.53) than either walk rate (0.26) or strikeout rate (0.51) does. Contact rate alone has an r^2 of 0.37 when comparing it to the future strikeout rate.

As it turns out, you can explain actual strikeout rate from this synthetic estimate quite accurately, with an r^2 in the low 0.8 range.

Statcast era data works slightly better; the version of zSO which has that data is at 0.84, and the one that predates Statcast data is at 0.80. Cross-validating using repeated random subsampling (our data is limited, as there’s no “other” MLB to compare it to) yields the same results.

Like the various x measures in Statcast, these numbers shouldn’t be taken as projections in themselves. While zSO projects future strikeout rate slightly more accurately than the actual rate itself does, a mixture of both gets a better r^2 (0.59 for the sample outlined above) than either does on its own. Looking at zSO alone as a useful leading indicator, however, gives us an idea of which players may be outperforming or underperforming their strikeout rates so far this season. All numbers are through Wednesday night.

Read the rest of this entry »


The Angels Reinforce Their Bullpen with Hunter Strickland

The Angels made a minor move to bolster their relief corps over the weekend, acquiring veteran reliever Hunter Strickland from the Rays. Strickland has been effective over the first six weeks of the season, with a 1.62 ERA and a 2.83 FIP in 16 innings for Tampa Bay. In return for his services, Los Angeles will give up either cash considerations or a player to be named later.

The Rays love reclamation projects, and Strickland was one of their latest, signing a minor-league deal with the team just before the start of spring training. It wasn’t Strickland’s first time. Once a rotation prospect with the Pirates — he was a Red Sox draftee picked up in the Adam LaRoche trade — he missed the 2011 season due to rotator cuff surgery and was waived by Pittsburgh after a disappointing 2012 season. The Giants moved him to the bullpen, and the big righty with big fastball looked like a future closer candidate. He also came equipped with a big temper, resulting in such incidents and playing the cavalry general for a bullpen charge into the Yasiel PuigMadison Bumgarner incident, yelling at Salvador Perez after an Omar Infante homer in the 2014 World Series, and intentionally hitting Bryce Harper in 2017.

That hot-headedness led to a broken hand that caused him to miss two months in 2018, the unsurprising result of punching a door after blowing a save, and the Giants non-tendered Strickland after that season.

Read the rest of this entry »


Dan Szymborski FanGraphs Chat – 5/13/21

12:04
Avatar Dan Szymborski: THE APPOINTED TIME FOR CHATS HAS ARRIVE

12:04
Jim Leyland Palmer: Who does ZiPS have as the most cromulent current player in the MLB?

12:04
Avatar Dan Szymborski: I dunno. Starlin Castro?

12:04
Avatar Dan Szymborski: He’s not good

12:05
Avatar Dan Szymborski: Well, not REALLY good

12:05
Avatar Dan Szymborski: but he’s acceptable

Read the rest of this entry »


No, We Don’t Need to Worry About the Dodgers

On Tuesday night, the Dodgers were only a Gavin Lux home run away from falling to a .500 record. A .500 record isn’t generally cause for panic, but it would definitely have been a disappointment for the reigning world champions, a team that was expected to steamroll most of the rest of baseball this season. Just to match 2020’s regular season record, the Dodgers need to add another 24 consecutive wins to Monday night’s win over the Mariners.

So how worried should the third-place Dodgers be? Not very.

The Dodgers Aren’t Actually Playing Poorly

Okay, this header isn’t true if we engage in an ultra-literal reading, but in losing 15 of the last 21 games, the Dodgers have only been outscored by a total of seven runs in the aggregate. The team’s overall Pythagorean record puts them at a 94.5 win pace, below the preseason projections, but not alarmingly so. The bullpen had a 4.48 ERA over this stretch, and while there is a relationship between bullpen performance and Pythagorean performance, the relationship is fairly loose.

I went back through history to look at the Pythagorean performances of all teams that underperformed their expected record by at least two wins after 36 games. Over the rest of the seasons, those teams fell short of their Pythagorean records by about a tenth of a run on average. In other words, the discrepancy between expected record and actual record in the early season is mostly noise, as opposed to hiding something sinister about a team’s true abilities. Read the rest of this entry »


Mike Trout, Yasmani Grandal, and Other Early BABIP Outliers

When it comes to early-season dominance or struggles, BABIP tends to be a featured player in many of the odder-looking lines. At the top of the league, you have the already amazing Mike Trout sporting a .519 BABIP, fueling a video game-like 236 wRC+ and a 1.224 OPS. On the flip side, quality players are still looking way up at the Mendoza line, such as Yasmani Grandal (.121 BA, .125 BABIP) or Kyle Tucker (.179 BA, .173 BABIP). Even though the evidence suggests that there’s more variability in BABIP ability among hitters than pitchers, a month of a season is a pitifully small amount of time to establish a new baseline expectation for BABIP. So, who is “earning” their BABIP and who isn’t so far?

Similar to the “x” Statcast stats, the ZiPS calculates “z” stats — I’ll let you guess what the z stands for — as part of its year-end projection model. These aren’t yet used in the simpler in-season model, though that’s in the works. Similar to Statcast, ZiPS estimates BABIP from the component parts: launch angle, exit velocity, speed data (for grounders), and so on. ZiPS also considers the direction a ball is hit, as a player’s pull tendency is a repeatable skill. This last data matters quite a bit. For example, grounders hit up the middle end up as singles about half the time, but grounders hit 15 degrees to the left or right of the second base bag are hits about a tenth of the time.

How does it work? The numbers are still volatile, but if all you have is zBABIP and actual BABIP, zBABIP is historically the better predictor. For all players with 50 PA in both 2020 and ’21, 2020 zBABIP is closer to 2021 BABIP than 2020 BABIP for 65% of players. Historically, the best predictor of actual BABIP, again using only these two stats, is a linear combination of 0.9 zBABIP and 0.1 actual BABIP.

Read the rest of this entry »


Dan Szymborski FanGraphs Chat – 5/6/21

12:03
James: Trent Grisham is good. But is it possible he might be under the radar, star level good?

12:03
Avatar Dan Szymborski: He’s certainly *played* like a star the last 80ish games now. I’m not convinced that he’s quite that good, but he’s certainly proving me wrong.

12:03
Beepollen: So, the Dodgers – what the hell’s going on???

12:04
Avatar Dan Szymborski: I should note they have a 20-12 pythag record, which equates to a 101-win schedule. And that’s going to be far more predictive than their current record is

12:05
James: What is going on with all of the league wide injuries? Pandemic short season related? Pitchers throwing harder than ever? SSS?

12:05
Avatar Dan Szymborski: I haven’t looked at injury rate compared to previous Aprils, but I wouldn’t be surprised if the weird 2020 made things riskier.

Read the rest of this entry »


The White Sox Just Lost Their Most Important Player

The White Sox took a giant blow Sunday when young centerfielder Luis Robert injured his right hip flexor running to first while trying to beat out a grounder to third against Cleveland. As it turns out, the injury wasn’t minor, as he was diagnosed with a Grade III strain — a complete rupture of the muscle involved — and will not be able to resume baseball activities for 12–16 weeks.

Chicago hasn’t officially ruled out Robert for the season, but there’s enough uncertainty that senior VP/general manager Rick Hahn did not give a particularly optimistic assessment of when his return could be.

“But it’s safe to say in terms of projecting his possible return, it’s too soon to know. Quite frankly, we are not going to be able to provide you with an educated projection of that for another 12 weeks or so as we see how he progresses.”

The most serious consequence of Robert’s injury is naturally a painful recovery process for last year’s AL Rookie of the Year runner-up. But the White Sox have more than 130 games to play, meaning there will also be consequences for the team and some pivotal decisions to make.

Losing Robert is particularly unwelcome for the Sox, as he represents the second serious loss at a position at which they’re not terribly deep. In an unfortunately timely look I did last month at baseball’s most irreplaceable players, the ZiPS projections pegged him as the seventh-most crucial player in the majors in terms of effect on the playoff race.

From a straight-up projection standpoint, Robert falls short of most of the names on this list. Just on the Sox, ZiPS thinks Lucas Giolito is a significantly more valuable player overall, at least when he’s not pitching in the morning. But if something should happen to Giolito, Chicago has spare arms to patch up the hole. If the team loses Robert, let’s just say ZiPS does not have a case of Leurymania or Engelalia. The race with the Twins is likely going to be a tight one, and the Royals have shown surprising spunk. The White Sox could ill afford an injury to their center fielder.

Read the rest of this entry »