Greene Is a Go for the Reds

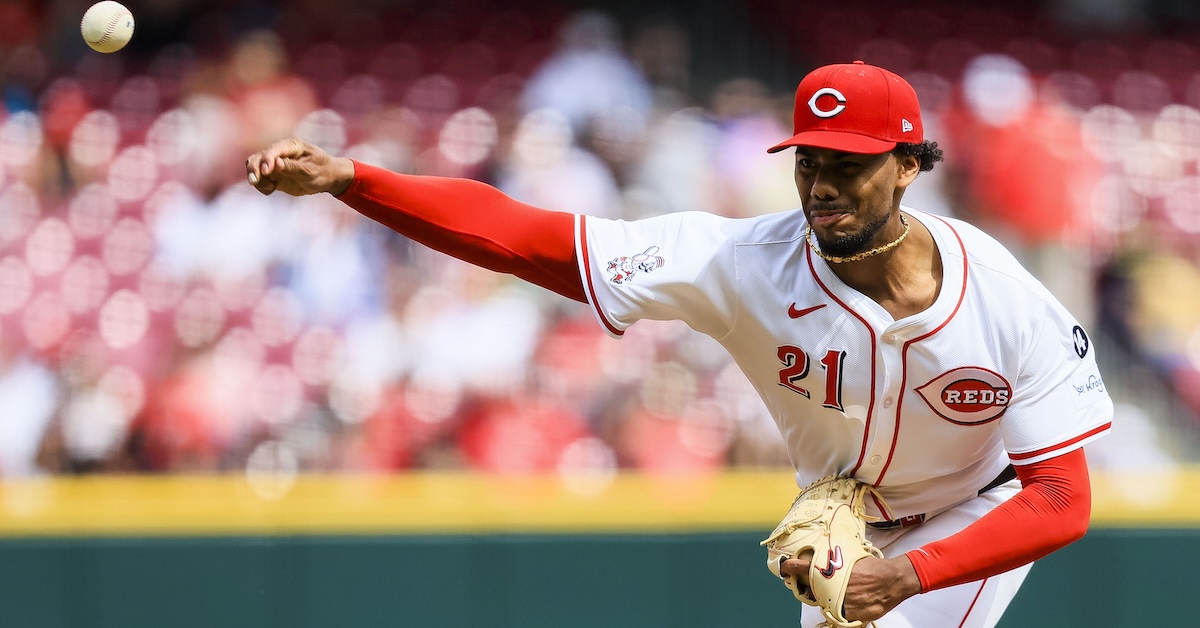
For most of the first two months of the 2025 season, Cincinnati Reds right-hander Hunter Greene looked liked one of the NL Cy Young favorites. Alas, similar to the fate of protagonists in funny YouTube videos, groin injuries came to pass, and after first missing two starts in May before returning for three, Greene has been on the shelf since the start of June. In yet another example of correlation not meaning causation, the Reds played their best ball of the year without their ace, going 33-26 since Greene’s last start. While they wouldn’t make the playoffs if the season ended today, the New York Mets, one of the teams Cincinnati is looking up at, have been reeling since the trade deadline and proceeded to lose seven games in a row. The Reds are just two games behind the Mets in the standings, so now is as good a time as any to get Greene back in the rotation. And would you look at that? He is scheduled to start on Wednesday against the Phillies.
Now in his fourth season, Greene has developed from a gifted, but relatively raw prospect into a bonafide ace. His repertoire is generally unchanged, and he remains a mostly fastball-slider pitcher; the biggest difference is he’s phased out his changeup in favor of a nasty splitter, though he uses that pitch rather sparingly. How terrific is his stuff? Well, if you’re not convinced by watching him for yourself, his three pitches rank so highly in Stuff+ that you might think he were secretly sending Eno Sarris truckloads of exotic beers to try to tip the scales in his favor. Of the 138 pitchers with 150 innings since the start of 2024, Greene’s slider ranks fourth in Stuff+, his splitter ninth, and his fastball 11th. His arsenal has an overall Stuff+ rating of 116 — the highest in the majors. Pitchingbot is not quite that complimentary of Greene, but it also holds him in high regard; his botStf of 57 ranks 21st during that same span (min. 150 innings).
The slider is not only a particularly nasty pitch, but he uses it a bit differently than most starters. Despite having a viable splitter, Greene aggressively uses his slider against lefties. With its velocity and bite, he almost uses it like a cutter that threatens to take out the batter’s lead kneecap. There have been 106 starting pitchers since the start of 2024 who have thrown at least 100 sliders, and none of them has had a more whiffable one in cross-platoon situations than Greene.
| Player | BA | SLG | Contact% |
|---|---|---|---|
| Hunter Greene | .108 | .275 | 52.2% |
| Paul Skenes | .214 | .357 | 53.8% |
| Reynaldo López | .155 | .268 | 54.2% |
| Kumar Rocker | .238 | .524 | 55.6% |
| Freddy Peralta | .229 | .375 | 55.7% |
| Jared Jones | .184 | .355 | 56.0% |
| Tylor Megill | .250 | .286 | 56.2% |
| Dylan Cease | .201 | .335 | 56.5% |
| Spencer Strider | .226 | .484 | 57.0% |
| Eury Pérez | .300 | .500 | 57.1% |
| Tyler Glasnow | .206 | .444 | 57.5% |
| Edward Cabrera | .200 | .200 | 58.2% |
| Jesús Luzardo | .202 | .281 | 58.2% |
| Jacob deGrom | .174 | .326 | 58.4% |
| Reese Olson | .189 | .216 | 59.0% |
| Chris Sale | .174 | .248 | 59.7% |
| Logan Gilbert | .230 | .416 | 60.5% |
| Carlos Rodón | .166 | .307 | 61.4% |
| Reid Detmers | .197 | .355 | 62.6% |
| Hayden Birdsong | .294 | .412 | 62.7% |
| Grant Holmes | .195 | .286 | 63.0% |
| Andre Pallante | .172 | .276 | 63.1% |
| Luis L. Ortiz | .203 | .500 | 63.3% |
| Patrick Corbin | .226 | .381 | 64.6% |
| Robbie Ray | .159 | .319 | 65.2% |
This slider is what has enabled Greene to survive as a very heavy fastball-slider pitcher, something you see far more often with relievers. In this way, he is comparable to Kevin Gausman — though swapping splitter and slider — who also relies heavily on two pitches, happily using his splitter against righties, locating it in the same way another pitcher would use a slider. But Greene appears to have mastered this even more quickly than Gausman did.
Of course, Greene has done more than just survive. He has knocked another walk per nine off his numbers this year, something consistent with his elite 74.3% first-strike percentage. His FIPs over the last two seasons (3.47 in 2024, 3.42 this year) back up his development into a frontline starter, and the Reds would surely be happy enough if that’s where his actual outcomes ended up, too. However, you’ll notice that his ERAs (2.75 last year, 2.72 in 2025) are even better than that. Some of that, of course, has been fueled by low BABIP numbers, but in his case, we shouldn’t be all that skeptical of the legitimacy of his performance. The Reds have ranked 25th in FRV since the start of 2024, so he’s running those low BABIPs despite having a shoddy defense behind him.
Immediately after the trade deadline, the ZiPS projection system saw the Reds as having a 12.5% chance of making the postseason. The division appeared out of reach — and it definitely is now with the Brewers surging — and ZiPS saw Cincinnati’s competition for the three Wild Card spots, the Padres, Mets, and Cubs, as clearly stronger clubs overall. Despite the Mets’ struggles, ZiPS has only pumped the Reds’ playoff probability up to 14.2%. The thing is, even though these projections reflect Greene’s pending return, there is still room for their odds to rise if he comes back smoothly; the full ZiPS model is particularly skeptical of the workloads that pitchers will carry coming off an injury, so this projection assumes Greene will throw only 31 innings over the rest of the season. However, if we also include the 11 additional innings that our Depth Charts projects for Greene, and use his ZiPS projected performance as of May 1, just before he first hurt his groin, Cincinnati’s playoff probability jumps to 21.3%. That may seem relatively modest in absolute terms, but that difference is a larger playoff boost than any team got for any trade deadline acquisition this year. The Reds are right at the cusp of the playoff picture, where additional wins are most important, and his return could be the most impactful in the league.
Having Greene at full strength would be similarly crucial for the Reds in the postseason if they get there. ZiPS sees Cincinnati as a below-average playoff team regardless of whether Greene is healthy and performing well, but at his best, he boosts the club’s projected postseason winning percentage by seven points. Elly De La Cruz is the only Reds player who makes a greater effect with his presence alone.
The return of Greene also provides the Reds a little more insurance in the event that Nick Lodolo, who landed on the 15-day IL with a blister on his index finger last week, takes a bit longer than expected to recover, as blisters can sometimes be difficult to shake in the short term. Also, ZiPS remains down on the Cincinnati offense. It expects the lineup to be below average (95 wRC+) the rest of the way. In all likelihood, the Reds will go only as far as their pitching can take them.
The Mets probably won’t go winless the rest of the year — I say “probably” because of how often their seasons end similarly to a German fairy tale — so the Reds have an uphill battle to play some bonus baseball this fall. If that’s going to happen, they’ll need Greene to return at the top of his game.