Author Archive

Tigers Roar Back, Send ALDS to Game 5

Credit: Lon Horwedel-Imagn Images

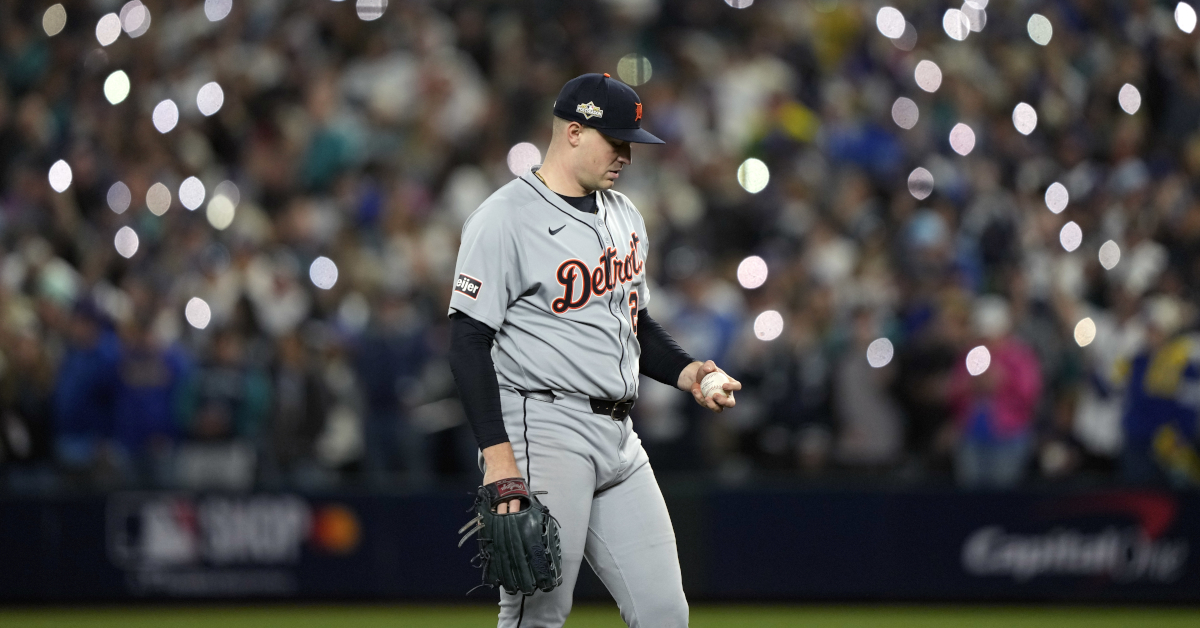
Maybe the three runs the Tigers scored in the ninth inning of their Game 3 blowout loss weren’t so inconsequential after all. Maybe they were a sign of better things to come on Wednesday. Facing elimination, Detroit’s bats woke up in a big way in Game 4 en route to a 9-3 victory. That sends the American League Division Series back to Seattle on Friday for a decisive Game 5, allowing Tarik Skubal one more chance to beat the Mariners for good.

Consider this: Through the first three games of the ALDS, the Mariners had hit more home runs than the Tigers had extra-base hits. Kerry Carpenter hit a home run in Game 1, the team’s lone long ball to that point, and Spencer Torkelson and Gleyber Torres each had a pair of doubles, but that was it. Granted, three of those extra-base hits drove in runs, and two of them tied the game — the Tigers made the most of their limited opportunities — but Seattle had been absolutely outslugging Detroit:

Tigers Hitters, Through ALDS Game 3
Player H RBI WPA wOBA xwOBA wRC+
Gleyber Torres 4 0 0.03 0.382 0.372 147
Spencer Torkelson 2 4 0.39 0.299 0.337 90
Colt Keith 1 0 -0.05 0.225 0.370 39
Kerry Carpenter 1 3 0.00 0.210 0.405 29
Riley Greene 2 0 -0.15 0.147 0.117 -14
Zach McKinstry 1 1 0.10 0.131 0.145 -25

Indeed, outside of Carpenter’s clutch home run, a pair of two-run doubles from Torkelson, and four hits off the bat of Torres, the Tigers offense had been conspicuously absent during the series. Even after their mini-rally in the ninth on Tuesday, Detroit was batting .165 and slugging .233 as a team entering Game 4. On the other hand, Seattle was slugging .423 even while batting just .212 through three games. That narrative completely flipped on Wednesday. The Tigers collected seven extra-base hits (three home runs and four doubles), while the Mariners could only muster one. Torkelson, Torres, Zach McKinstry, and Javier Báez each had multiple hits, and Jahmai Jones had a huge pinch-hit double in the decisive fifth inning.

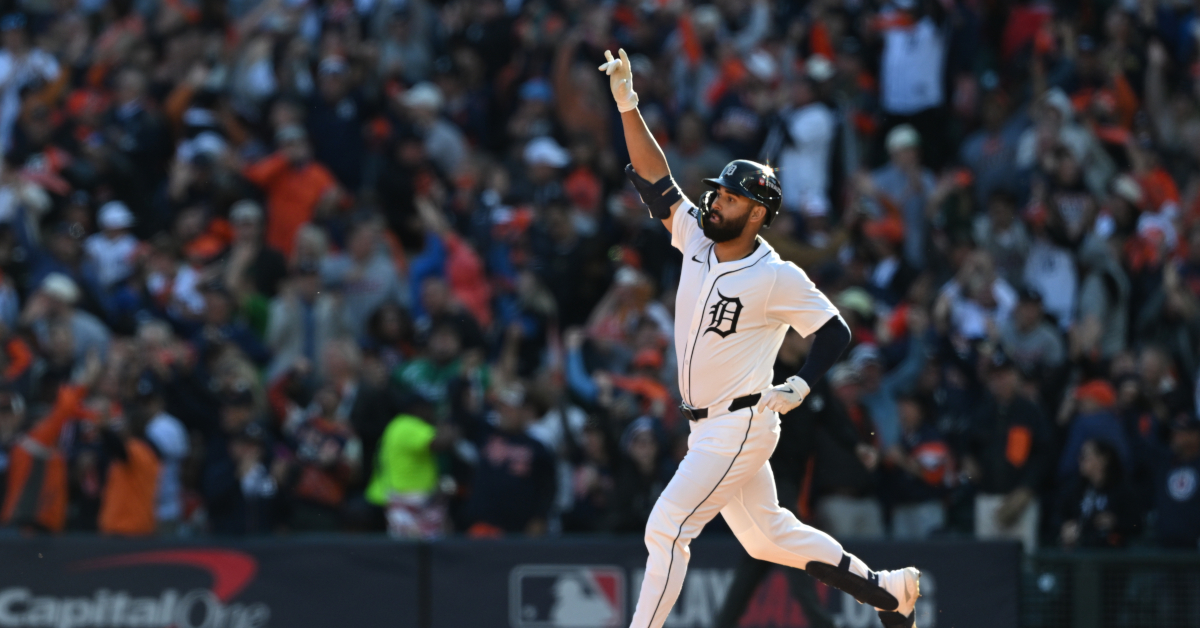
And as they have all series long, home runs defined the shape of Game 4. Riley Greene had been mostly bottled up during the ALDS; he had collected just two hits through the first three games of the series. His first extra-base hit against Seattle was a 454-foot blast to give the Tigers a 4-3 lead in the sixth inning. After hitting 36 homers during the regular season, his go-ahead home run was the first of his postseason career and broke open the floodgates for the Tigers. For his part, Báez hit his first postseason home run since the 2017 NLCS, a two-run shot, later in the inning. Then in the seventh, Torres continued his hot hitting by launching an opposite field solo shot to extend the Tigers’ lead, making it 8-3.

The game hadn’t started off so lopsided. As they have in each game of the series, the Mariners got on the board first, scoring a run in each of the second, fourth, and fifth innings. With a 3-0 lead halfway through the ballgame, things were looking pretty encouraging for the Mariners. They’ll likely look back on Wednesday and be haunted by some pretty big missed opportunities to put the game away early. In the fourth, Seattle loaded the bases with no outs, but wound up pushing just one run across after a double play and a pop out squelched the threat. The next inning, the first two batters reached, earning the team another run, but the Mariners couldn’t keep the rally going.

Things turned in the bottom half of that inning. Torkelson led off with a single, and after a fielder’s choice, Dillon Dingler drove in the Tigers’ first run with a double. That chased Bryce Miller from the game, and Mariners manager Dan Wilson went with trustworthy lefty Gabe Speier to face the bottom of Detroit’s lineup. Jones, pinch-hitting for Parker Meadows, ripped the first pitch he saw down the left field line to drive in Dingler, and Báez tied the game with a single up the middle in the next at-bat. Speier came back out in the sixth inning to face Greene, but the Tigers left fielder turned on a hanging slider and deposited it in the right field stands. From there, the flood gates opened. The Tigers scored three more in the sixth, capped off by Báez’s home run off Eduard Bazardo, and they added insurance runs in the seventh and eighth.

For Seattle, it’s a pretty concerning shift from what had been a fairly dominant bullpen through three games. Even when you include the three runs allowed by Caleb Ferguson in the ninth inning of Game 3, Mariners relievers had put up a 3.38 ERA and a 1.71 FIP in 13.1 innings during the ALDS — their ERA drops to 1.35 if you ignore those garbage time runs. The Tigers have also scored all of their runs in this series in the fifth inning or later, putting even more pressure on the Mariners’ relief corps.

The runs Speier and Bazardo allowed in Game 4 were their first of the series, and you have to wonder if familiarity is starting to work against Seattle’s ‘pen. Bazardo has appeared in all four games, while Speier has now gotten some high-leverage work in three of the four games, including facing Carpenter and Greene three times apiece. Because Detroit’s most dangerous hitters are left-handed, Speier will almost certainly be called on to work in Game 5 on Friday, and thanks to Ferguson’s struggles on Tuesday — he’s the only other lefty in Seattle’s bullpen — Speier seems like the most critical piece of the pitching puzzle for Wilson and the Mariners.

The Tigers turned to Game 1 starter Troy Melton to shut down the Mariners bats once they had tied it up in the fifth. Melton worked around some trouble in the sixth, getting Randy Arozarena to fly out to center after allowing two two-out baserunners. The right-hander carved through the heart of the Mariners order on seven pitches in the seventh, then erased a leadoff baserunner in the eighth with a made-to-order double play, again only needing seven pitches to set the M’s down in order; he has to have Tigers manager A.J. Hinch feeling really good should the team need a fireman to quell a late rally from the Mariners on Friday. Will Vest closed the door with a 1-2-3 ninth.

While Detroit’s starter for the decisive Game 5 isn’t in question, Seattle’s is still unsettled. Both George Kirby and Luis Castillo could start Friday’s game on normal rest, and both looked pretty good in their earlier starts this series. Ultimately, it’ll come down to who Wilson trusts more to work through the Tigers’ lineup twice, with whoever doesn’t make the start likely available out of the bullpen anyway. I should mention that between the two, Kirby is the only one who has made a relief appearance during his big league career, closing out Game 2 of the 2022 Wild Card series against the Blue Jays.

No matter who starts for the Mariners on Friday, this was the exact scenario they were hoping to avoid. Allowing Skubal two opportunities to affect the outcome of the series is a very dangerous proposition, even if Seattle has beaten him three times this year. Tempting fate a fourth time tips the scales toward Detroit; our ZiPS game-by-game odds currently give the Tigers a 54% chance of advancing to the ALCS (assuming a Kirby start for Seattle). That’s a percentage Mariners fans are well acquainted with.


Another AL East Clash: Yankees vs. Blue Jays ALDS Preview

Ron Chenoy and Brad Penner-Imagn Images

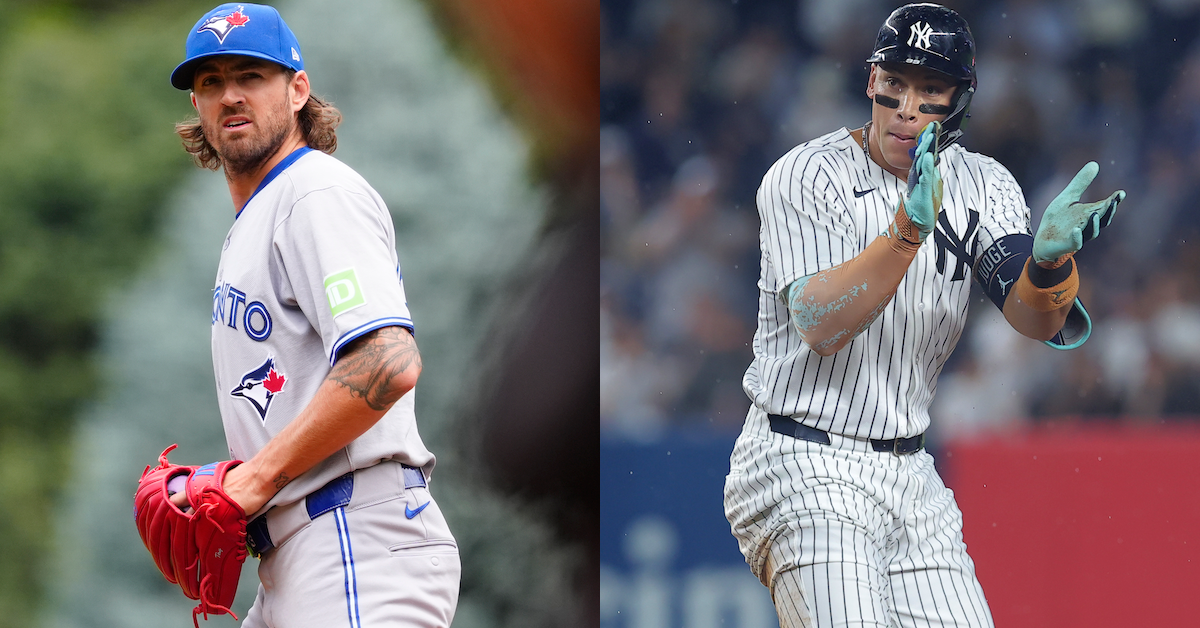
On Thursday, the New York Yankees became the first team to win a Wild Card Series after losing the first game of the best-of-three since the new playoff format was introduced in 2022. After dispatching the Boston Red Sox in the Wild Card, the Yanks have a matchup against another AL East foe lined up for the ALDS. For their part, the Toronto Blue Jays desperately needed their first-round bye to get their roster healthy after a breakneck final month of the season. These two teams finished 2025 with identical 94-68 records. The division race came down to the regular season’s final day, and the Jays only took the AL East crown thanks to a 8-5 head-to-head record against New York.

These division rivals are well acquainted with each other, though this will be the first time the two teams have met in the playoffs. (That’s pretty wild considering the Yankees’ long postseason history. There are now just three teams they haven’t faced in the playoffs: the White Sox, Nationals, and Rockies.) Their identical win totals during the regular season provide the primary storyline in this series: These are two evenly matched clubs battling for a spot in the ALCS.

ALDS Preview: Blue Jays vs. Yankees
Overview Blue Jays Yankees Edge
Batting (wRC+) 112 (3rd in AL) 119 (1st in AL) Yankees
Fielding (FRV) 44 (1st) 8 (7th) Blue Jays
Starting Pitching (FIP-) 105 (11th) 92 (3rd) Yankees
Bullpen (FIP-) 94 (5th) 97 (9th) Blue Jays

Read the rest of this entry »


Padres Strike Back Behind Dominant Bullpen, Force Game 3 in Chicago

Matt Marton-Imagn Images

If there was a blueprint for a Padres victory this postseason, it would look a lot like their 3-0 victory over the Cubs on Wednesday. The Friars got some standout moments from superstars Manny Machado, Fernando Tatis Jr., and Jackson Merrill, and their bullpen completely shut down the opposition behind a solid 3 2/3 inning start from Dylan Cease. The win forces a decisive final game of the Wild Card series on Thursday.

Pitching ruled the day for San Diego. Cease was excellent in his abbreviated start, allowing just four baserunners while striking out five. He generated 15 whiffs on 37 swings — a 41% whiff rate — and his slider was absolutely unhittable. He worked around harmless singles in the first and third innings. Only after a two-out double from Seiya Suzuki in the fourth did Padres manager Mike Shildt turn to his bullpen. After intentionally walking Carson Kelly to get to Pete Crow-Armstrong, Adrian Morejon quickly dismissed the Cubs center fielder with a weak groundout to first.

Morejon pitched two more clean innings, then handed the ball off to Mason Miller. Miller struck out five Cubs hitters in a row, then plunked Michael Busch with two outs in the eighth inning. With a man on first, Shildt again went to the bullpen, calling on Robert Suarez to get the final out. Nico Hoerner lined a pitch to deep right field, but Tatis made an acrobatic catch to end the inning. Suarez allowed a one-out single to Kyle Tucker in the ninth, but got Suzuki to hit into a game-ending double play to secure the victory.

With their season on the line, Shildt was obviously managing to win today. The quick hook with Cease meant that his bullpen needed to cover the remaining 5 1/3 innings. Cease had reached 69 pitches by the time Suzuki doubled in the fourth, but it didn’t look like he was laboring. Morejon had already gotten warm in the previous inning, and walking Kelly to get to Crow-Armstrong seemed like a good strategic move in an early high-leverage spot. PCA had limped to a .231 wOBA over the past two months and had produced just a .250 wOBA against left-handed pitching this year. But that short start from Cease and subsequent heavy bullpen usage obviously has some knock-on effects for Thursday’s game.

Padres Bullpen Usage
Pitcher IP H R BB K Game 1 Pitch Count Game 2 Pitch Count
Adrian Morejon 3.1 2 0 0 1 9 33
Mason Miller 2.2 0 0 0 8 13 27
Jeremiah Estrada 0.2 1 1 1 0 10 0
Robert Suarez 1.1 1 0 0 0 0 18

Robert Suarez and Jeremiah Estrada have only been used once each in this series, but Morejon and Miller have thrown more than 40 pitches apiece. I’m sure both will say they’re available to pitch for a third day in a row, but Shildt has to be wary of burning them out. If Game 3 is close and the Padres are leading, I wouldn’t be surprised to see Miller for an inning on Thursday. Thankfully, Suarez and Estrada won’t have any restrictions for that final game in the series, and Michael King could be available to pitch if necessary.

Back to Wednesday’s game. San Diego got on the board early, scratching across a run in the first inning against opener Andrew Kittredge. Tatis and Luis Arraez started the game off with back-to-back singles and then successfully completed a double steal with one out in the inning. That put a runner on third for Jackson Merrill, who hit a deep sacrifice fly to get the first run on the board.

Cubs manager Craig Counsell’s decision to use Kittredge as an opener ahead of Shota Imanaga was reasonable. Imanaga has really struggled in the first inning this year — he has a 7.20 ERA in the first frame and a 5.08 ERA in his first time through a lineup — and he’d limped to a 6.51 ERA over his final five regular-season starts. Kittredge had been one of Chicago’s better high-leverage relievers since he was acquired from the Orioles in July, and a quick first inning could have set up Imanaga to face a string of left-handed batters in the middle of the Padres lineup in the second inning. Things just didn’t work out the way Counsell drew it up, and the team was on the back foot from the get-go.

The real killer blow came in the fifth inning. With a runner on second and two outs, Imanaga grooved a first-pitch splitter to Machado. The star third baseman launched the pitch 404 feet into the left field bleachers.

Machado finished the regular season in a bit of a weird slump. He blasted six home runs in September, but his overall line that month was just an 85 wRC+. That was an improvement over the 70 wRC+ he had posted in August, but he was still trying to regain his form after a customarily solid first half of the season.

I’d also be remiss if I didn’t mention how absolutely dominant Miller has been in this series. In Game 1, he struck out the side in the seventh inning. Today, he picked up right where he left off, striking out five batters in a row before a back-foot slider to Busch grazed its intended target in the eighth. And then there was this absolute beauty of a pitch to strike out Kelly in the seventh:

At 104.5 mph, that was the fastest pitch ever recorded in the postseason, and the fourth-fastest pitch resulting in a strikeout in the pitch tracking era (regular-season or postseason). And the pitch dotted the lower outside corner for a called strike three! Miller’s four-seamer averaged 103.0 mph in his outing today. Just look at these absolutely insane results from his two outings in the postseason:

Mason Miller Dominance
Pitch Count Whiffs Called Strikes Whiff% CSW%
Four-seam 16 7 1 77.8% 50.0%
Slider 24 4 9 57.1% 54.2%

He’s been completely unhittable. I already discussed his availability for Game 3 above, but if the Padres need him, I’m sure he’ll be ready to pitch another shutdown inning on Thursday.

That decisive game will likely feature more bullpen machinations from both teams. Yu Darvish and Jameson Taillon are listed as the starters, but I imagine both managers will be quick to pull them at the first sign of danger. If there’s one benefit to the Cubs’ loss on Wednesday, it’s that the best arms in their bullpen are rested. Kittredge will probably only be available in an emergency, but Daniel Palencia, Brad Keller, and Drew Pomeranz have all had a day’s rest ahead of Thursday’s contest. That just might give them the edge in what should be a very tightly contested elimination game.


FanGraphs Power Rankings: 2025 Postseason Edition

After the last four playoff spots were decided during a wild final weekend of the regular season, the postseason is finally upon us. The 12-team field features a number of ballclubs that were playing their best baseball down the stretch in September, plus a few teams that backed into the playoffs in the midst of some worrying slumps. But the slate is wiped clean in October, and anything can happen in the postseason. Here’s a look at the 12 playoff teams and how they stack up against each other.

Last year, we revamped our power rankings using a modified Elo rating system. If you’re familiar with chess rankings or FiveThirtyEight’s defunct sports section, you’ll know that Elo is an elegant solution that measures teams’ relative strength and is very reactive to recent performance. Since we’ve reached the postseason, I’ve removed the playoff odds weighting to our raw Elo calculations and presented the teams in the tiers below based on our odds of them winning the World Series. If you’re curious about how your team finished in the standard regular season power rankings, the full table can be found at the bottom of this article. Read the rest of this entry »


FanGraphs Power Rankings: September 15–21

The final week of the regular season is upon us, and the playoff picture in both leagues is far from settled. It should be a fun week of baseball as everything sorts itself out before the postseason begins.

Last year, we revamped our power rankings using a modified Elo rating system. If you’re familiar with chess rankings or FiveThirtyEight’s defunct sports section, you’ll know that Elo is an elegant solution that measures teams’ relative strength and is very reactive to recent performance. To avoid overweighting recent results during the season, we weigh each team’s raw Elo rank using our coin flip playoff odds (specifically, we regress the playoff odds by 50% and weigh those against the raw Elo ranking, increasing in weight as the season progresses to a maximum of 25%). The weighted Elo ranks are then displayed as “Power Score” in the tables below. As the best and worst teams sort themselves out throughout the season, they’ll filter to the top and bottom of the rankings, while the exercise will remain reactive to hot streaks or cold snaps.

First up are the full rankings, presented in a sortable table. Below that, I’ve grouped the teams into tiers with comments on a handful of clubs. You’ll notice that the official ordinal rankings don’t always match the tiers — there are times where I take editorial liberties when grouping teams together — but generally, the ordering is consistent. One thing to note: The playoff odds listed in the tables below are our standard Depth Charts odds, not the coin flip odds that are used in the ranking formula. Read the rest of this entry »


FanGraphs Power Rankings: September 8–14

All of a sudden the NL Wild Card race looks a lot more exciting, while the playoff picture in the AL had a big shakeup over the weekend. It’s bound to be an exciting final two weeks of the regular season.

Last year, we revamped our power rankings using a modified Elo rating system. If you’re familiar with chess rankings or FiveThirtyEight’s defunct sports section, you’ll know that Elo is an elegant solution that measures teams’ relative strength and is very reactive to recent performance. To avoid overweighting recent results during the season, we weigh each team’s raw Elo rank using our coin flip playoff odds (specifically, we regress the playoff odds by 50% and weigh those against the raw Elo ranking, increasing in weight as the season progresses to a maximum of 25%). The weighted Elo ranks are then displayed as “Power Score” in the tables below. As the best and worst teams sort themselves out throughout the season, they’ll filter to the top and bottom of the rankings, while the exercise will remain reactive to hot streaks or cold snaps.

First up are the full rankings, presented in a sortable table. Below that, I’ve grouped the teams into tiers with comments on a handful of clubs. You’ll notice that the official ordinal rankings don’t always match the tiers — there are times where I take editorial liberties when grouping teams together — but generally, the ordering is consistent. One thing to note: The playoff odds listed in the tables below are our standard Depth Charts odds, not the coin flip odds that are used in the ranking formula.

Complete Power Rankings
Rank Team Record Elo Opponent Elo Playoff Odds Power Score Δ
1 Phillies 89-61 1581 1496 100.0% 1620 1
2 Brewers 91-59 1580 1493 100.0% 1619 -1
3 Blue Jays 87-62 1574 1500 100.0% 1614 2
4 Yankees 83-66 1553 1504 99.5% 1595 0
5 Red Sox 82-68 1555 1503 90.6% 1590 -2
6 Mariners 82-68 1550 1499 96.4% 1587 6
7 Cubs 85-64 1534 1506 100.0% 1584 -1
8 Dodgers 84-65 1524 1500 100.0% 1576 0
9 Tigers 85-65 1508 1490 99.5% 1564 -2
10 Padres 82-68 1498 1489 99.8% 1556 -1
11 Astros 81-69 1503 1497 72.8% 1524 -1
12 Rangers 79-71 1556 1502 29.8% 1523 1
13 Guardians 78-71 1535 1497 11.3% 1491 3
14 Mets 77-73 1464 1496 80.6% 1479 -3
15 Diamondbacks 75-75 1512 1496 4.9% 1470 0
16 Athletics 70-80 1518 1504 0.0% 1456 5
17 Giants 75-74 1491 1496 9.2% 1454 3
18 Orioles 69-80 1511 1508 0.0% 1451 -1
19 Reds 74-75 1480 1499 5.0% 1440 -1
20 Royals 75-75 1496 1497 0.2% 1440 -6
21 Marlins 70-80 1478 1505 0.0% 1425 5
22 Pirates 65-85 1472 1506 0.0% 1421 -3
23 Rays 73-76 1471 1500 0.0% 1421 0
24 Braves 66-83 1467 1500 0.0% 1417 0
25 Cardinals 73-77 1464 1500 0.5% 1417 -3
26 Nationals 62-87 1458 1507 0.0% 1410 2
27 Angels 69-81 1451 1501 0.0% 1405 -2
28 White Sox 57-93 1449 1503 0.0% 1403 -1
29 Twins 65-84 1410 1494 0.0% 1373 0
30 Rockies 41-109 1356 1513 0.0% 1331 0

Read the rest of this entry »


FanGraphs Power Rankings: August 25–September 7

The playoff race in the National League looks pretty settled, but the door to capturing a Wild Card spot in the American League looks like it has cracked open a little bit. There are a handful of teams still looking to make a last minute run, though with less than a month left in the season, time is running out for those long shots.

Last year, we revamped our power rankings using a modified Elo rating system. If you’re familiar with chess rankings or FiveThirtyEight’s defunct sports section, you’ll know that Elo is an elegant solution that measures teams’ relative strength and is very reactive to recent performance. To avoid overweighting recent results during the season, we weigh each team’s raw Elo rank using our coin flip playoff odds (specifically, we regress the playoff odds by 50% and weigh those against the raw Elo ranking, increasing in weight as the season progresses to a maximum of 25%). The weighted Elo ranks are then displayed as “Power Score” in the tables below. As the best and worst teams sort themselves out throughout the season, they’ll filter to the top and bottom of the rankings, while the exercise will remain reactive to hot streaks or cold snaps.

First up are the full rankings, presented in a sortable table. Below that, I’ve grouped the teams into tiers with comments on a handful of clubs. You’ll notice that the official ordinal rankings don’t always match the tiers — there are times where I take editorial liberties when grouping teams together — but generally, the ordering is consistent. One thing to note: The playoff odds listed in the tables below are our standard Depth Charts odds, not the coin flip odds that are used in the ranking formula. Read the rest of this entry »


Starting Pitching Is Suddenly the Mariners’ Weak Link

Credit: Joe Nicholson-Imagn Images

The Mariners entered the season with a starting rotation that was the envy of nearly every other team in baseball, with four young homegrown pitchers in Logan Gilbert, George Kirby, Bryce Miller, and Bryan Woo, and Luis Castillo as the veteran ace to lead the group. Our preseason projections had Seattle’s rotation as the seventh best in baseball, only held back by its lack of depth behind the top five starters. Three of those young starters appeared on Ben Clemens’ midseason Trade Value list, ranked 23rd (Kirby), 34th (Woo), and 36th (Gilbert). The M’s rotation has been the key to their success over the last few years, but lately, that same highly regarded group has been the weakest link for the Mariners as they fight to maintain a playoff spot.

Since the All-Star break, Seattle’s rotation has put up a 4.55 ERA and a 4.27 FIP, 19th and 16th in the majors, respectively. It’s been even worse over the last 30 days: a 4.94 ERA (20th) and a 4.66 FIP (21st). Kirby has allowed seven or more runs in two of his last four starts, and was knocked around for 10 hits and eight runs (seven earned) in two innings in his start against the Rays on Wednesday. Castillo has allowed five or more runs in three of his last four starts. Gilbert suffered through an ugly six-run blowup in Philadelphia a few weeks ago. Miller is sporting a 5.63 ERA since being activated off the IL on August 19. Even the metronomic Woo had his streak of 25 starts of at least six innings snapped on August 27.

These problems becomes even more stark when you compare their performance inside the confines of the extremely pitcher friendly T-Mobile Park to their struggles on the road. This season at home, the rotation is putting up a 3.40 ERA and a 3.82 FIP, fourth and ninth best in the majors, respectively. On the road, those marks drop to a 4.69 ERA (26th) and 4.44 (22nd). The Mariners have a 32-40 record on the road this year, and these pitching issues are a big reason why.

All of these struggles are showing up in the standings, too. The M’s are 22-22 during the second half, but since a 9-1 homestand to start the month of August, they’re 7-14, with four of those seven wins coming at home. Seattle has had two long East Coast road trips during this stretch, which have included sweeps by the Phillies and Rays, and a combined 3-12 record with three more games to play in Atlanta this weekend. Despite all this, the M’s currently hold the final AL Wild Card spot, just 1.5 games ahead of the Rangers and 3.5 games behind the Astros in the AL West.

It’s worth noting that three of the Mariners’ starters have spent a significant amount of time on the IL this year: Kirby was sidelined during spring training with a shoulder injury and wound up missing nearly two months of the season; Gilbert missed all of May and half of June with a flexor strain in his elbow; and Miller has had two separate IL stints due to inflammation in his elbow stemming from a bone spur. Seattle’s starters have thrown the most innings in baseball since the beginning of the 2022 season, and it’s possible that heavy workload over these past few years is catching up with them.

Here’s how the performance of the team’s five starters has changed from the first half to the second half:

Mariners Starters, First & Second Half Performance
First Half Second Half
Player IP ERA FIP K-BB% IP ERA FIP K-BB%
Luis Castillo 108.1 3.41 3.89 13.1% 47 5.17 4.61 17.0%
George Kirby 54 4.50 3.82 19.8% 50.2 4.44 3.28 15.6%
Logan Gilbert 61 3.39 3.01 29.3% 42.2 4.22 3.56 26.2%
Bryan Woo 114.2 2.75 3.45 19.6% 55 3.60 4.08 21.1%
Bryce Miller 48.2 5.73 4.47 7.4% 16 5.63 7.39 10.9%

It’s at least a little encouraging to see that the peripherals for Kirby and Gilbert look solid during the second half, even if their top line results have suffered. There are some red flags for Woo and Castillo, however; the former is 20 innings past his previous career high set last year and the latter is showing some worrying signs of fatigue. I think it’s worthwhile to take a closer look at Kirby, Gilbert and Castillo, and try to see what might be causing their issues and if there’s any hope of a turnaround in the final month of the season.

It’s been a really up-and-down season for Kirby. Maybe because of the shoulder injury, he’s never really looked like he’s settled in since being activated off the IL. The biggest clue he hasn’t been feeling like himself is his walk rate. From his debut in 2022 through the end of 2024, Kirby had exactly two starts where he allowed three walks; this year, he’s already had five starts where he’s allowed three walks. His walk rate has nearly doubled, though when it’s going from 3.0% to 5.9%, it’s still an above-average mark compared to the league.

I have a hunch that his command issues stem from a pretty significant change to his arm angle. Kirby had been throwing from a pretty standard three-quarters arm slot for his entire career, but it suddenly dropped eight degrees this year. I’m not sure if that change in mechanics stemmed from his shoulder injury — it’s possible he’s compensating for a still slightly damaged shoulder by dropping his arm slot, or that his body found a new “natural” arm slot during his rehab. Whatever the cause, the new mechanics have had a pretty dramatic effect on the characteristics of his pitches. Here’s what a few of Kirby’s key physical metrics look like for his four-seam fastball:

George Kirby, Fastball Characteristics
Year Velocity Arm Angle Vertical Release Angle Vertical IVB Vertical Approach Angle Vertical Dead Zone Delta Stuff+
2023 96.1 36.0° -1.9° 15.2 -4.5° +0.2 99
2024 96.0 37.1° -1.7° 15.8 -4.3° +0.3 103
2025 96.1 29.4° -1.2° 13.5 -4.2° -1.5 88

His heater lost some raw carry (IVB), but it gained a much flatter approach angle and now sits well outside the fastball “dead zone.” The results the pitch is generating haven’t changed all that much; Kirby is still garnering a whiff more than a quarter of the time, and the expected wOBA allowed off of his fastball is right around his career norms. But he’s throwing the pitch in the strike zone just 51.6% of the time, down from 53.2% last year and 58.0% in 2023.

Along with a flatter fastball, a lower arm angle has given Kirby’s entire arsenal a lot more horizontal movement. His slider is moving three inches more to his glove side and his curveball has an extra inch of break. His sinker and splitter both have a bunch more arm-side movement as well. That break has definitely benefitted his breaking balls, as both are running career-high whiff rates. Kirby has struggled to find a consistent breaking ball he can use to earn those swings-and-misses, and it finally looks like he’s got two of them.

Unfortunately, the new arm slot seems to have caused Kirby to ditch his splitter. He added that pitch in 2023 in an effort to find an offspeed offering to use against left-handed batters, and it’s been an important piece of his arsenal since then. He was throwing his split like normal in May when he first returned from his shoulder injury, but quickly ditched it after his second start in favor of a changeup. The new offspeed pitch is coming in a little harder than the splitter, with less drop and more arm-side break. Batters are having trouble putting the new changeup in play with any authority — it has a .155 expected wOBA — but its 11.1% whiff rate leaves a lot to be desired when compared to the near 30% whiff rate the splitter had.

It’s fair to wonder if all these changes to his mechanics and pitch shapes have caused Kirby’s usually pinpoint command to waver a bit as he gets used to his new norm. It’s also possible that he’s just been the victim of some really poor luck; his peripherals all look pretty solid, with his 3.56 FIP nearly a run lower than his 4.47 ERA. All his other ERA estimators — a 3.52 xFIP, a 3.69 SIERA, and a 4.10 xERA — point to some improvement to come as well.

Kirby isn’t the only starter on the Mariners whose mechanics have undergone a dramatic change this year: Gilbert has dropped his arm angle from a high, over-the-top delivery to a three-quarters arm slot. Mikey Ajeto detailed this change in a piece for Baseball Prospectus back in June, writing:

Gilbert’s fastball has gotten flatter, and his splitter steeper. Now his fastball is flatter than the average fastball, and his splitter is not only steeper than the average splitter, it’s getting forkball depth. Now he’s throwing strikes again with his fastball, and his splitter is one of the deadliest two-strike pitches in MLB.

Among all pitchers with at least 100 innings pitched, Gilbert leads the way in strikeout rate at 34.2%. And like Kirby, his ERA is half a run higher than his FIP, though his issue is a little easier to pinpoint. His 2.64 xFIP tells you almost everything you need to know: Gilbert is allowing far too many home runs despite all those swings and misses.

Interestingly, it’s not his fastball that’s the culprit. The flatter approach angle has helped him tone down the damage allowed off his heater. Instead, it’s Gilbert’s slider that’s causing some of these issues. The breaking ball is still generating plenty of whiffs, but when batters put the pitch in play, they’re crushing it. He’s allowed a .719 slug and a .445 expected wOBA with the breaker, which means that even though batters whiff against it more than a third of the time, it’s returned a negative run value this year.

Like the rest of his repertoire, the slider’s physical shape has changed with Gilbert’s lower arm slot. It’s a near perfect gyro slider, but this year, it has slightly less drop and a bit less horizontal break. We’re talking a half inch difference in both directions, but that could be enough to throw off Gilbert’s location with the pitch. Here’s a heat map of his slider locations this year:

Right down the heart of the plate isn’t the ideal location for a slider. If he’s throwing his breaking ball expecting it to drop an extra half inch, those locations could make a little more sense. He just hasn’t made the adjustment to his target yet and continues to leave those breaking balls in a very dangerous part of the zone.

As for Castillo, the issue is pretty easy to spot:

Castillo’s fastball velocity was right around 95 mph for most of the season, not too dramatically different from where it was last year and in 2023. But in August, his fastball was suddenly averaging 94 mph, and his ERA ballooned to 7.31 with the diminished velocity. Castillo’s heater has been his primary weapon since joining the Mariners, a pretty significant change from his time with the Reds, when his changeup was his best pitch. With Seattle, he has emphasized the hard stuff at the expense of the offspeed pitch, but that’s become a liability in these last seven starts with the lost velocity:

Luis Castillo, Fastball Batted Ball Metrics
Time Period Velocity wOBA xwOBA Hard Hit% Barrel%
Prior to July 28 95.2 0.323 0.375 51.7% 14.6%
After July 28 94.2 0.620 0.361 61.1% 16.7%

Batters were already hitting Castillo’s fastball pretty well earlier in the season, but he was mostly mitigating the damage. Since his July 28 start, however, his fastball has been getting crushed. He’s responded by throwing his sinker and slider a bit more often, but his sinker gets hit almost as hard as his four-seamer without the potential for swings and misses.

Castillo has been a durable and very effective starter for most of his career, but he’s suddenly facing a future with a diminished version of one of his best weapons. I’m not sure simply changing up his pitch mix to feature more sinkers is the answer either. I think he’s going to need to lean on his secondary pitches a lot more heavily to succeed; his slider is an excellent breaking ball and his changeup is largely unchanged from its peak with Cincinnati. I’m not sure if Castillo can make a switch to his approach in time to salvage the rest of this season, but I’m sure it will be one of the top priorities for the Mariners’ pitching lab this offseason.

For all their recent issues, the Mariners rotation still possesses a tremendous amount of talent. Both Kirby and Gilbert seem like they’ve been victims of some bad luck even as they try to navigate new pitching mechanics. Woo has continued to look fantastic despite running up against some workload concerns. Castillo and Miller have some big question marks going forward, and you’d think that one or both of them would be relegated to the bullpen in a potential playoff series. And for what it’s worth, our Depth Charts projections think the Mariners will have the third-best rotation in baseball for the remainder of the regular season. They’ll need all that talent to show up over these next few weeks as they fight for their spot in a tight AL playoff race.


FanGraphs Power Rankings: August 18–24

If you’re looking for a team to make a surprise run to the playoffs, the final month of the season likely won’t be that exciting; there are just three teams on the fringe of the postseason picture, and none of them have playoff odds higher than 20%. But with 12 teams jockeying for their playoff position and a handful of division races left to be decided, there’s still potential for a good bit of intrigue between now and October.

Last year, we revamped our power rankings using a modified Elo rating system. If you’re familiar with chess rankings or FiveThirtyEight’s defunct sports section, you’ll know that Elo is an elegant solution that measures teams’ relative strength and is very reactive to recent performance. To avoid overweighting recent results during the season, we weigh each team’s raw Elo rank using our coin flip playoff odds (specifically, we regress the playoff odds by 50% and weigh those against the raw Elo ranking, increasing in weight as the season progresses to a maximum of 25%). The weighted Elo ranks are then displayed as “Power Score” in the tables below. As the best and worst teams sort themselves out throughout the season, they’ll filter to the top and bottom of the rankings, while the exercise will remain reactive to hot streaks or cold snaps.

First up are the full rankings, presented in a sortable table. Below that, I’ve grouped the teams into tiers with comments on a handful of clubs. You’ll notice that the official ordinal rankings don’t always match the tiers — there are times where I take editorial liberties when grouping teams together — but generally, the ordering is consistent. One thing to note: The playoff odds listed in the tables below are our standard Depth Charts odds, not the coin flip odds that are used in the ranking formula. Read the rest of this entry »


FanGraphs Power Rankings: August 4–17

After a week hiatus, these power rankings are back… and nothing much has changed in the playoff picture. The National League is particularly stratified, even if the NL West is a bit closer than it was two weeks ago, and although there are a few more longshots in the American League, the 12-team field looks pretty settled right now.

Last year, we revamped our power rankings using a modified Elo rating system. If you’re familiar with chess rankings or FiveThirtyEight’s defunct sports section, you’ll know that Elo is an elegant solution that measures teams’ relative strength and is very reactive to recent performance. To avoid overweighting recent results during the season, we weigh each team’s raw Elo rank using our coin flip playoff odds (specifically, we regress the playoff odds by 50% and weigh those against the raw Elo ranking, increasing in weight as the season progresses to a maximum of 25%). The weighted Elo ranks are then displayed as “Power Score” in the tables below. As the best and worst teams sort themselves out throughout the season, they’ll filter to the top and bottom of the rankings, while the exercise will remain reactive to hot streaks or cold snaps.

First up are the full rankings, presented in a sortable table. Below that, I’ve grouped the teams into tiers with comments on a handful of clubs. You’ll notice that the official ordinal rankings don’t always match the tiers — there are times where I take editorial liberties when grouping teams together — but generally, the ordering is consistent. One thing to note: The playoff odds listed in the tables below are our standard Depth Charts odds, not the coin flip odds that are used in the ranking formula.

Complete Power Rankings
Rank Team Record Elo Opponent Elo Playoff Odds Power Score Δ
1 Brewers 78-45 1644 1489 100.0% 1664 0
2 Blue Jays 73-52 1570 1499 99.5% 1604 0
3 Red Sox 68-57 1562 1501 78.8% 1579 0
4 Dodgers 71-53 1539 1504 99.8% 1576 1
5 Phillies 71-53 1539 1496 99.0% 1576 1
6 Cubs 70-53 1532 1509 97.9% 1569 -2
7 Padres 69-55 1537 1497 97.4% 1568 0
8 Tigers 73-53 1518 1487 99.3% 1561 0
9 Mariners 68-57 1539 1499 92.8% 1560 2
10 Astros 69-55 1527 1497 92.0% 1558 0
11 Yankees 67-57 1518 1504 93.5% 1538 1
12 Reds 65-60 1525 1499 14.3% 1511 3
13 Mets 66-58 1479 1493 85.9% 1496 -4
14 Royals 63-61 1523 1498 12.1% 1493 2
15 Guardians 63-60 1502 1497 14.7% 1484 2
16 Orioles 57-67 1509 1504 0.1% 1460 2
17 Rangers 62-63 1492 1501 11.6% 1457 -3
18 Marlins 59-65 1501 1507 0.3% 1456 -5
19 Angels 60-64 1490 1499 1.1% 1449 0
20 Braves 56-68 1495 1500 0.3% 1448 8
21 Athletics 56-70 1489 1504 0.0% 1442 -1
22 Rays 61-64 1469 1503 3.8% 1432 1
23 Twins 58-66 1464 1496 0.6% 1424 2
24 Diamondbacks 60-65 1456 1490 0.7% 1420 2
25 Cardinals 61-64 1451 1500 2.6% 1418 -3
26 Pirates 52-73 1454 1505 0.0% 1415 -5
27 Giants 60-64 1433 1493 1.8% 1402 -3
28 Nationals 50-74 1435 1509 0.0% 1399 1
29 White Sox 44-80 1414 1505 0.0% 1383 -2
30 Rockies 35-89 1394 1514 0.0% 1367 0

Tier 1 – The Brewers
Team Record Elo Opponent Elo Playoff Odds Power Score
Brewers 78-45 1644 1489 100.0% 1664

Well, the Brewers finally lost a game in the month of August. Their 14-game winning streak propelled their lead in the NL Central from one game ahead of the Cubs on July 31 to an eight-game gap, and they have the best record in the majors by six games. They’ve barely felt the impact of Jackson Chourio’s hamstring injury, which he suffered a few weeks ago, because nearly everyone else in their lineup is on fire. Seven of the eight Milwaukee players who have collected at least 50 plate appearances in August are running a 125 wRC+ or higher for the month. The Brew Crew will have an opportunity to truly bury the Cubs in the standings, as those two rivals have a five-game series on the schedule this week, beginning with a doubleheader on Monday at Wrigley Field.

Tier 2 – On the Cusp of Greatness
Team Record Elo Opponent Elo Playoff Odds Power Score
Blue Jays 73-52 1570 1499 99.5% 1604
Red Sox 68-57 1562 1501 78.8% 1579
Dodgers 71-53 1539 1504 99.8% 1576
Phillies 71-53 1539 1496 99.0% 1576

The Blue Jays extended their lead in the AL East to five games by going 4-2 last week against the Cubs and Rangers. They might not be the most complete team in the AL, but as long as their superstars are producing, they look very hard to beat. To wit: Vladimir Guerrero Jr. blasted his sixth home run of the month on Sunday, Bo Bichette has returned to form after his terrible 2024 season, and George Springer was just activated off the IL on Saturday.

It took him a few weeks to acclimate to the big leagues, but beginning with a 3-for-6 showing on June 28, Roman Anthony has slashed .322/.433/.409 (a 158 wRC+) in 40 games. And he’ll be anchoring this lineup for a long time to come, as Boston signed him to a huge extension a few weeks ago. After treading water in the Wild Card race with a 3-3 record last week, the Red Sox have a huge four-game series against the Yankees looming this weekend in the Bronx.

The Dodgers and Padres entered last weekend’s series in Los Angeles on very different trajectories. After suffering a sweep at the hands of the Angels, the Dodgers dropped from first place in the NL West for the first time since late April. Meanwhile, San Diego had been surging, winners of five straight series with a 14-3 record over its previous 17 games. Then, naturally, Los Angeles won all three games to flip the momentum of both teams. The Dodgers once again lead the division, by two games entering this week, but this race is far from over, despite our playoff odds giving the Padres just a 16.1% shot at winning the West. We’ll see how those odds move after the two teams match up for three games in San Diego this weekend in their final meeting of the regular season.

The Phillies extended their lead in the NL East from half a game on August 4 to five games entering Monday, but they are now facing the prolonged absence of Zack Wheeler, who was placed on the IL on Sunday with a blood clot in his shoulder. The returns of both Aaron Nola and Alec Bohm from their respective injuries should soften the blow a bit, and Philadelphia should have the rotation depth to get by without Wheeler in the regular season. However, it’s quite possible the Phillies won’t have their best pitcher back for October. That’s a major concern in what should be a very competitive NL postseason field.

Tier 3 – Solid Contenders
Team Record Elo Opponent Elo Playoff Odds Power Score
Cubs 70-53 1532 1509 97.9% 1569
Padres 69-55 1537 1497 97.4% 1568
Tigers 73-53 1518 1487 99.3% 1561
Mariners 68-57 1539 1499 92.8% 1560
Astros 69-55 1527 1497 92.0% 1558

Even if the Cubs do well in their huge five-game set against the Brewers this week, it probably won’t be enough to disturb Milwaukee’s chances of winning the division. Instead, a good performance should allow Chicago to regain some of the momentum it has lost. When the Cubs took two out of three games from the Pirates over the weekend, it marked just the third time the North Siders have won a series in the four weeks since July 21, a span of eight series.

It looks like the Tigers have put their July swoon behind them. They couldn’t complete the four-game sweep of the Twins on Sunday, but they’ve now won three straight series and have gone 13-7 over their last 20 games. The Astros will visit Detroit this week in a showdown between two of the best teams in the AL.

The Mariners had an eight-game winning streak snapped on Wednesday, but their surge earned them a share of the AL West lead for a very brief moment. From there, though, Seattle faltered again, losing both of its series last week, against the Orioles and the Mets, and slipping to 1 1/2 games behind the Astros in the West. Even so, things are looking up for the Mariners: With Bryce Miller set to be activated off the IL on Tuesday, the M’s will have all five of their top starters active and healthy for the first time this season. Meanwhile, after a frigid three weeks coming out of the All-Star break, Cal Raleigh is on fire once again. Over his last nine games, Big Dumper is slashing .303/.395/.818 with five home runs and a 231 wRC+.

As for the Astros, you can chalk up another injury on their long ledger this season. This time it’s a shoulder injury to Josh Hader, which is expected to sideline him for the rest of the regular season, though the door is still slightly open for an October return if everything heals well. In better news, Yordan Alvarez is set to begin a minor league rehab assignment this week.

Tier 4 – The Melee
Team Record Elo Opponent Elo Playoff Odds Power Score
Yankees 67-57 1518 1504 93.5% 1538
Reds 65-60 1525 1499 14.3% 1511
Mets 66-58 1479 1493 85.9% 1496

Since being activated from the IL on August 5, Aaron Judge has posted a very-mortal-though-still-solid .229/.426/.429 slash line (140 wRC+). No matter, the Yankees have gone 7-4 with Judge back in the lineup and have crawled back within a half game of the Red Sox and Mariners for the top Wild Card spot in the AL.

Things got pretty dicy for New York’s National League team, as the Mets slogged through a brutal 2-14 stretch and let the Reds close the gap considerably in the Wild Card standings. New York never let go of that final spot, and its back-to-back wins against the Mariners over the weekend provided a little bit of breathing room, but this is still a much tighter race than anyone in Queens would like. The good news for the Mets is that their two Franciscos in are heating up; Lindor tallied 14 hits and three home runs last week, and Alvarez has posted a .323/.408/.645 slash line (193 wRC+) since being recalled from Triple-A on July 21.

With the Mets stumbling, the Reds looked like they were poised to pull into a playoff position, especially after they won their series against the Phillies heading into last weekend. But Cincinnati ran into the Brewers at exactly the wrong time, losing the first two games before snapping Milwaukee’s 14-game winning streak in extra innings on Sunday. Unfortunately, as soon as the Reds activated Hunter Greene off the IL, Chase Burns switched places with him after suffering a flexor strain in his throwing elbow. For now, manager Terry Francona is hoping for the best-case scenario, that Burns can resume throwing soon and return before the end of August. However, Reds fans shouldn’t get too excited just yet, as the organization will surely be cautious with the 22-year-old’s rehab and almost certainly limit his workload the rest of the way.

Tier 5 – AL Longshots
Team Record Elo Opponent Elo Playoff Odds Power Score
Royals 63-61 1523 1498 12.1% 1493
Guardians 63-60 1502 1497 14.7% 1484
Rangers 62-63 1492 1501 11.6% 1457

The three teams in this tier are desperately trying to hang on in the AL Wild Card race. The Guardians fell to 3 1/2 games behind the Yankees for the final playoff spot after getting swept by the Braves at home over the weekend. It was Cleveland’s first series loss since late July. Even with those three losses, the Guards still have the AL’s best record since July 7 (23-12). Meanwhile, the Royals have been nearly as good over that same span (20-13). Following a three-game sweep of White Sox, Kansas City enters this week just a half-game behind Cleveland in the standings.

On the other side of the coin, the Rangers are in the middle of what could be season-crushing skid. On July 27, Texas reached a season-best six games over .500; since then, the team has gone 6-13 and slipped below .500 again. This week probably represents the last gasp of hope for the Rangers to return to the Wild Card race. They travel to Kansas City for four games before hosting the Guardians for a three-game set this weekend.

Tier 6 – No Man’s Land
Team Record Elo Opponent Elo Playoff Odds Power Score
Orioles 57-67 1509 1504 0.1% 1460
Marlins 59-65 1501 1507 0.3% 1456
Angels 60-64 1490 1499 1.1% 1449
Braves 56-68 1495 1500 0.3% 1448
Athletics 56-70 1489 1504 0.0% 1442
Rays 61-64 1469 1503 3.8% 1432

It was fun while it lasted, but you can probably stick a fork in any hope of a surprise Wild Card run from the Marlins. After sweeping the Yankees three weekends ago to reach .500, they’ve won just four of their last 14 and are now seven games behind the Mets for the final playoff spot. To make matters worse, Kyle Stowers, Miami’s best hitter this season, was just placed on the IL with an oblique strain. At least the Marlins can point to their competitive stretch in July and dream about returning to contention sooner rather than later.

It’s far too little, too late, but the Braves are finally on a roll. They swept the Guardians last weekend and are now 9-2 over their last 11 games. The key to this late-season surge has been the resurgence of Michael Harris II. After making some swing adjustments in early July, he’s slashing .386/.402/.719 (210 wRC+) since the All-Star break. If Atlanta doesn’t have to worry about Harris’ bat moving forward, it gives the organization one less thing to address in what has suddenly become a hugely important offseason.

Not to discount what Harris has done lately, but the two best hitters in baseball during the second half of the season both play for the Athletics. You probably know about the heater that Nick Kurtz is on, but Shea Langeliers has been almost as good over the last month. Both of those guys blasted home runs on Sunday — for Langeliers, it was his major league-leading 14th since the All-Star break. The A’s will need to figure out how to pitch in their temporary home in Sacramento, but their offense certainly looks like it’s for real.

Tier 7 – Worst-Case Scenarios
Team Record Elo Opponent Elo Playoff Odds Power Score
Twins 58-66 1464 1496 0.6% 1424
Diamondbacks 60-65 1456 1490 0.7% 1420
Cardinals 61-64 1451 1500 2.6% 1418
Pirates 52-73 1454 1505 0.0% 1415
Giants 60-64 1433 1493 1.8% 1402

The Twins’ expected post-deadline crash hasn’t exactly arrived. Sure, they went 2-5 against the Yankees and Tigers last week, but they are only a game below .500 since they sold nearly every spare part off their roster. The fantastic play of Luke Keaschall is a big reason why they’re still playing like a competitive team; he’s posted a 149 wRC+ since being activated off the IL on August 5. The biggest baseball news in Minnesota last week was the announcement that the Pohlad family will remain principal owners of the team after exploring a sale. The optics of this announcement stink. The Twins just traded away a huge chunk of the roster and dumped Carlos Correa off the payroll. To turn around and say this teardown was “part of the process” looks like an extension of the same penny pinching that led to these past two disappointing seasons. The hope established in 2023, when they won their first playoff series in two decades, feels like a long, long time ago.

Tier 8 – Hope Deferred
Team Record Elo Opponent Elo Playoff Odds Power Score
Nationals 50-74 1435 1509 0.0% 1399
White Sox 44-80 1414 1505 0.0% 1383
Rockies 35-89 1394 1514 0.0% 1367

With a pair of series wins over the Cardinals and Diamondbacks last week, the Rockies are now playing ahead of the historically bad pace of the 2024 White Sox. Colorado has to win just seven games before the end of the season to avoid tying Chicago’s record of futility. That certainly feels doable, even if the Rockies have one of the most difficult remaining schedules in baseball.