Tyler Anderson, Agent of Change


The Dodgers once again have one of the best pitching staffs in the major leagues. That’s nothing surprising; the last time they allowed more than four runs per game was back in 2010, when they finished fourth in the NL West. This season, they’ve been better than ever, allowing just 3.14 runs per game through nearly a third of the season. Their park- and league-adjusted ERA is 30% under the league average, easily the best in the majors. And they’ve accomplished this despite missing Clayton Kershaw, Andrew Heaney, and Blake Treinen for large chunks of the season. The man leading the pitching staff in WAR through the first two months of the season isn’t who you’d expect either: Tyler Anderson.
In an offseason headlined by Freddie Freeman, Anderson was an under-the-radar acquisition. Brought in to provide some depth to their pitching staff, the aforementioned injuries to Kershaw and Heaney thrust him into a key role in the Dodgers’ starting rotation. And outside of a seven-run blowup against the Phillies on May 12, he’s been absolutely dominant, allowing two runs or fewer in all of his other appearances and currently on a 20-inning scoreless streak.
Prior to this year, Anderson had put up a 4.62 ERA and a 4.43 FIP across more than 600 innings in six seasons. Both of those marks were a bit inflated, since he started out his career with the Rockies; his park- and league-adjusted ERA and FIP sat a hair above league average at 101 and 102, respectively. That sort of production was what the Dodgers were probably expecting from him when they brought him in without a clear spot in the rotation. His first two outings came out of the bullpen in a piggyback role paired with Tony Gonsolin, but when Heaney went down with a shoulder injury, he was inserted into the rotation and hasn’t looked back.
Anderson has been pitching better than ever, even including that one bad outing against the Phillies, posting career bests in ERA, FIP, xFIP, and strikeout and walk rates. The biggest difference maker for him has been one single pitch: his changeup. He’s always possessed a good one, but it’s been leaps and bounds better this year, and it starts with his pitch mix.
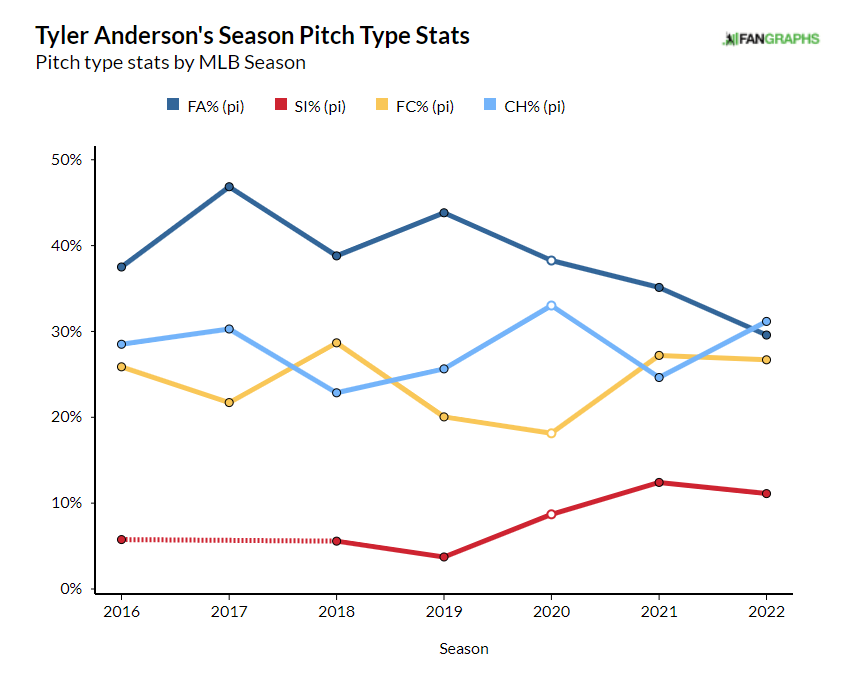
He’s throwing his changeup 31.2% of the time this season, though that’s not the highest rate of his career; that came in 2020 when he threw it 33% of the time while with the Giants. More importantly, he’s reduced the usage of his four-seam fastball to just 30%, making his changeup the featured pitch in his repertoire. Read the rest of this entry »