Author Archive

2010 Disabled List: Position Data

A few days ago, I put out the list of players that spent time on the disabled list in 2010 along with the some team data. Today, I will look at how the DL data breaks down by position.

To begin with, here is how each team is broken down by the numbers of days on the DL between when comparing pitchers and hitters:

PitchVsHitDL

The only piece of information that jumped off to me was comparing the days lost by pitchers of the Boston Red Sox and the Arizona Diamondbacks. The Diamondbacks, which lost the 4th lowest number of days, lost more days to pitchers than the Red Sox, which had the 3rd highest total of days lost.

Next, here is a chart comparing the difference in the number of trips to the DL vice the number of days lost for each position:

Generally, each position, besides pitchers, loses the same number of days and trips when compared to other position players. When combined, the position players have about the same number of trips to the DL as pitchers. Once on the DL though, the pitchers are more likely to remain on the list for a longer time. This difference can further be seen in the following 2 charts:

Pitchers

pitchersDL

Hitters

hittersDL

The main difference I noticed from the numbers is the high percentage of pitchers than spend >165 days on the DL compared to hitters. Barely any of the hitters on the DL, 1.4%, are out for an entire year, but 11.4% of the pitchers make the longer stay.

For the next installment, I will be breaking down the data by injury type (i.e. strain) or body location (i.e. elbow).


Vladimir Guerrero is Safe at Home

I watched Ron Washington’s Game 5 post game press conference and he stated the following:

We have a very aggressive team, and tonight we took advantage of some things, a ground ball double play Vladimir [Guerrero]. What else do we have to do but come around the bag and keep running? If it’s a double play, the inning is over anyway.

I thought Vlad had slowed down when rounding third base, so I went back and looked at the video to see if Vlad was hustling the entire time to get home or was he waiting to see how the play at first base unfolded.

The video of the play does give a few hints confirming if Vlad was heading home once he left second base as Ron Washington stated or was Vlad looking for some other clue to go home.

First of all, there was no visual clues that third base coach, Dave Anderson, was sending Vlad home as soon as he left second base (45 seconds into the video).

vladbases1

No arms windmilling- nothing. Anderson simplywalks slowly closer to third base.

Second, Vlad is not hustling home with 100% effort like Ron Washington mentioned in the press conference. About three steps from third base he begins to slow down to a jog and continues at this pace for few steps after touching third base. During this same time he is watching the play at first base unfold.

vladbases2

Finally, Vlad never actually put his head down and ran home with 100% effort until he saw Kinsler was safe at first base.

I am not sure what event that actually caused him to decide to head home with 100% effort. I first thought he may have been too far off the bag to make it back to third base safely if David Price decided to throw to third base, so Vlad decided to try to score. After watching the video a few times, I think he could have easily made it back to third base.

Maybe it was Texas’s plan to have their runners always round third base on possible double plays with one out and try to score. If this was the case, I think Dave Anderson would have been waving Vlad home once the ball was thrown to first. Instead, both seemed to be watching the the play at first base.

I actually think either Vlad and/or Dave Anderson knew that David Price had a propensity to ignore base runners when covering first base as seen earlier in the game. Once they saw that Ian Kinsler was safe and Price had his back to the play, Vlad headed home to try to score. There is no way from the footage to tell which one made the decision. Anderson was about 6 feet away from Vlad when Vlad decided to head home. He could have easily kept the instructions somewhat quiet in order for David Price not to hear them or Vlad could have made the decision on his own. There is just no way to tell either way for sure.

Ron Washington can claim that Vlad was heading home no matter what due to the Rangers aggressive base running, but I don’t think that is the case on this play. Instead it was a heads up play by some combination of the base runner Vladimir Guerrero and the third base coach Dave Anderson.


ALDS Game Five Preview: Texas

Well it is Game 5 for the Texas Rangers and Tampa Bay Rays. The game is a near mirror match up of Game 1 in the series with lefties Cliff Lee and David Price pitching . I have absolutely nothing to add that hasn’t been said over the last week, except grab your favorite refreshing beverage, sit down and enjoy the game.

This game will be mentioned as the game that let the Rangers win their first post-season series and propelled them into the ALCS versus the Yankees -or- the game that sent them home again disappointed. Games like this is why we follow baseball. Enjoy the game and a complete over-the-hill analysis will be available after the game no matter which team wins.


2010 Disable List Spreadsheet and Team Information

Overview

I have finally gone through the MLB transaction data and have compiled a spreadsheet of the all of the trips to and from the disabled list for the 2010 season. Feel free to download the data and use it as you see fit. If you use the data in your own article/research there is no need to reference my work since the data can be obtained freely. I am just wanting to make it available for people to use. If you do plan on using it, here is an explanation and limitation of the data.

Explanations of the columns:

Team – The team that placed the player on DL.
Trans – The date that the official transaction occurred – This can be different than the official start date as some injuries occurred before the player was on the DL
POS – Position of the player
First – First name of the player
Last – Last name of the player
Started – When a player’s official DL time starts
StartedInSeason – Some players were placed on the DL in January. This date marks the date when the player actually begins to miss regular season games.
End – When the player’s official DL time ends. Many of these records are unknown right now because teams haven’t taken all their players off the DL yet.
EndedInSeason – Many players are still on the DL, even though the season has ended. This marks the date when the player no longer misses any regular season games.
TotalInSeasonDays – Total days missed during the 2010 season
Transferred to 60 day DL – Date the player was transferred to the 60 day DL (if applicable)
Disabled list – If the player was initially placed on the 15 or 60 DL.
Side – Side of the body (if given)
Location – Part of the body that the injury occurred. It will be filled out for each player.
Body Type – Body type (i.e. bone, ligament) injured. This was only filled out if listed in the transactions
Injury – Type of injury that occurred. If there was none listed, the vague term “injury” was used. I plan on looking these up on a later date. It will be filled out for each player.
Extent – Extent of injury, if given.
Surgery – Used if surgery was known. There are definitely more surgeries that happened, but these were the only ones listed in the transactions.
Surgery date – Date of the surgery.

Limitations

The data is probably only 90%-95% correct at this point. Going through the data, there was quite a bit of missing information, especially when it came to players going on the 60 DL or when a player was taken off the DL and then sent to the minors. If anyone sees an error, I will gladly fix the data and mark it in the versions at the bottom of the spreadsheet. You can email errors to me at wydiyd ~ hotmail ~ com

Well enough of background information, how about some graphs.

Team Data

Here is how each team fared in the total number of trips to the DL:

2010Trips

Here are the total days lost to the DL for each team:

2010days

No data really stick out to me, except for the huge discrepancies from the teams on extremes of days lost. The Oakland Athletics lost five time as many games to the DL than the Chicago White Sox . In the next day or so, I will be breaking down the data according to position.


ALDS Game Three Review: Texas

The Rangers seemed like they were on their way to their first ever postseason series win, when Ian Kinsler homered in the 7th inning giving the Rangers a 2-1 lead. Once the Rangers got the lead, it looked like the game was in their hands because of the pitching staff’s performance so far in the series. The Rangers pitchers pitched amazingly for the first 25 innings of the first 3 games of the series allowing only 2 runs.

Then Tampa Bay’s offense then came around and put up 5 runs against the Ranger’s pen in the 8th and the 9th inning. In the first two previous games, Tampa had just 8 total hits. In the 8th and 9th alone, they got 6 hits including 2 home runs.

The main problem was that of the 6 relievers brought in by Texas in the game, 5 allowed a hit and 4 of them allowed a run to score. Besides Darren O’Day being brought in to just face (and strikeout) B.J. Upton in the 8th inning, not one reliever was able to shutdown the Rays while pitching. Here is how each of the other Texas relievers fared:

Derek Holland faced 3 batters allowing a hit and a walk.
Alexi Ogando faced 2 batters allowing a double.
Darren Oliver faced 7 batters allowing 2 doubles and a single.
Neftali Feliz faced 4 batters allowing a home run and a single and a walk
Dustin Nippert faced 5 batters a home run and a single.

Over the four innings of work, the relievers allowed a AVG/OBP/SLG slash line of: 0.474/0.525/0.843. Ouch.

The Rangers have two more chances to close out the series starting tomorrow. In order to get another win, they can not have anything close to the group effort blowup that the bullpen exhibited today.


ALDS Game Two Preview: Texas

It was a nice win for the Rangers today and they look to go up 2-0 with another win tomorrow. The only major change from game one to game two is that James Shields and C.J. Wilson get the call as the starters.

One knock against Shields is that he has been inconsistent this season. To see how consistent Shield’s and Wilson’s starts were across the season, I decided to graph both starter’s Game Scores from best to worst.

shieldWilsonGraph

Wilson has put up better Game Scores across the entire season when compared to Shield’s starts. Wilson had fifteen Game Scores over sixty, while Shields only put up six over sixty. Besides have more good games, Wilson’s bottom 5 performances don’t drop off like Shield’s bottom 5.

Each game that a starter does better, he gives he team a better chance of winning, no matter if he offically gets the win or the loss. Here are the team’s Win/Loss records when each pitcher pitched to a certain level of Game Score:

shieldWilsonGSchart

The pitcher’s team usually won when the pitcher was able to achieve a game score of 56 or higher. If Shields can post Game Scores like his regular season numbers, he has about a 25% chance of throwing a great game, 50% of the time the game will be a toss up and 25% of the time it will be clunker. Wilson on the other hand had 50% of his game great, 30% in the toss up range and 20% in the bottom range. Shields season was consistently inconsistent over the season, while Wilson was generally consistently good.

The chances for the Rangers to win tomorrow’s game look good considering the scheduled pitchers. The Rays need to hope the “Good” Shields shows up to have a chance to even up the series.


ALDS Game One Preview: Texas

Series Information

Stadium – Tropicana Field plays completely opposite compared to the hitters paradise of Rangers Ballpark in Arlington. Tropicana is a pitcher’s dream with a spacious center field.

Home Plate Umpires – I do not know which umpire is going to work behind home plate for game one, but the six umpires working this series are Tim Welke, Jim Wolf, Jerry Meals, Bill Miller, Jeff Kellogg, and Mike DiMuro. The crew is not half bad with Bill Miller and Tim Welke being pitcher friendly with a wide strike zone and Jeff Kellogg known to be a hitter’s friend with a smaller than average zone.

Game 1 Information

What to look for when the Rangers take the field?

Cliff Lee is getting the call for game one of the series, which is huge for the Rangers to start the series with a legitimate ace. My fellow writers, Matt Klaasen (here) and Albert Lyu (here) have each done a nice write up on what to expect from Lee. There is not much else for me to add to what they have already said.

Against the Rays this season Cliff looks like he has not had his best stuff, going 0-3 with a 4.56 ERA. Looking a little deeper, he has pitched decently by striking out 25, walking two, and not allowing any home runs in 23.2 innings.

The Rangers bullpen is adequate with Darren Oliver and Darren O’Day setting up Neftali Feliz. If the Rangers have a lead after the sixth inning, they should feel confident that the pen should hold onto it.

Defensively, the Rangers are fairly solid. The Ranger’s outfield has the 5th best UZR total for the season at +20.8 UZR. All the outfielders play above average defense with the exception being David Murphy, who is probably only league average. The infield’s UZR over the season is -5.8 UZR. The infield would have been exactly average, except for Michael Young and his -5.8 UZR. While not a great defense, the teams defense ended up as 11th overall in the league according to UZR.

What to look for when the Rangers are batting against David Price?

The Rangers have a couple of key injuries in the outfield that will effect the team. David Murphy looks like he won’t be able to go in game one, but Josh Hamilton will be back to patrol center field. It is tough to know the exact the lineup the Rangers are going to use, but here is my best SWAG using previous game information.

Andrus-SS
Young-3B
Hamilton – CF
Guerrero-DH
Cruz-LF
Kinsler-2B
Francoeur-RF
Cantu-1B
Molina-C

The order toward the bottom may be changed around, and I think Ron Washington will go with Cantu because he wants to use a right handed bat versus the left handed starter, David Price. The offense has been a strong point of the team this year. Hopefully, Hamilton can remain healthy and re-anchor the lineup after missing the past month.

Final thoughts

The Rangers are not receiving as much media love as the other teams in the playoffs and Vegas has them as the least likely American League team to win the World Series (10 to 1 odds). But the team is well rounded and, when they acquired Cliff Lee during the season, the Rangers got a much needed ace to match up against the opponent’s ace. This game is not in anyway a must win for the Rangers, but a game one victory would go a long way in helping Texas to their first ever post season series win.


Shutdowns, Meltdowns and Making the Playoffs

Earlier this season, I brought up my dislike for the Saves statistic. Then, Tom Tango got the ball rolling (here and here) on creating a better way of measuring relief appearance success and, within a couple of days, the statistics Meltdowns and Shutdowns were available here at Fangraphs.

Shutdowns were supposed to mirror the total number of holds and saves in a season. As of yesterday, a total of 3403 number of shutdowns have occurred so far this season compared to a total of 3142 saves and holds. With only about 8% more shutdowns being recorded compared to saves and holds, the logic behind the values seem to be holding up fairly decent.

To see how teams stack up comparably, here is a look at the leaders and laggards in shutdowns across the league:

shutdowns

It seems the cream rises to the top as the top five teams have made the playoffs or are still in contention, while the bottom five teams are not going to make the postseason.

Along with shutdowns, meltdowns were created to measure the relief appearances that significantly hurt a team’s chances of winning. In comparision, here are leaders and laggards in the number of meltdowns:

meltdown

All the teams with the most meltdowns won’t make the playoffs, except maybe Colorado. Three of the five teams with the least number of meltdowns will make the playoffs with the Mets and While Sox being the exceptions.

Finally, the best way to see how the pen has done as a whole is to get the ratio of the number of shutdowns compared to the number of meltdowns. So far this season the league average is 1.73 shutdowns for every meltdown. Again here is a list of the top and bottom teams in the league:

ratio_leaders

No real surprise here with five playoff or likely playoff teams making the top list and five non-playoff teams at the bottom. Besides the top-five teams, here are how the rest of the possible playoff teams rank:

ratio_rest

Having a capable bullpen that keeps its team in games (compiling shutdowns) and doesn’t blowup (meltdowns) isn’t all that a team needs in order to make the playoffs, but all the teams making the playoffs have addressed it nicely during this season.


Catching Prospects and Implications of a New Position

A couple of highly touted catching prospects in the minors, William Myers (Royals) and Jesus Montero (Yankees), had a great 2010 season hitting. There have been some concerns with both players regarding their ability to handle the various aspects of catching (e.g. handling pitchers, throwing out runners, blocking pitches, etc). With talk of the Royals and Yankees possibly moving them off of catcher to another position, I decided to look at few items that teams must consider when moving a catcher to another position.

Positional Value

A good-hitting catcher is rare to find. After Joe Mauer, Brian McCann, Victor Martinez and Mike Napoli, the ability for current catchers to hit this season drops off considerably.

A catcher’s value is best seen when looking at the differences in WAR adjustments given for various positions. Generally, a catcher is moved to one of three positions in the field if he can’t catch: first base or one of the two corner outfield positions. So a team usually only has one of the following six options to a get a good-hitting catcher in the lineup (I ignored third base, as over 75% of the games were from one player, Brandon Inge):

Catching only (does’t play in field on days off – assume 1/6th of days will be off)
Catch and DH on days off (Joe Mauer clone)
Catch and 1B on days off (Victor Martinez clone)
First Base
Corner Outfield

Using positional adjustments, here is how much difference there is in value (WAR) for each of the preceding positions considering the ability of the catcher to hit (assuming league-average fielder):

catchValue

Being a catcher, compared to the other position choices, adds anywhere from 1 to 2 WAR contributed by the player. This difference could be nice advantage for a team that has the catcher under team control for several seasons.

Defensive Value

In the previous example, I considered catchers to be league average in their defense. I decided to see how well catchers did when moved to a new defensive position.

One problem with moving catchers to another defensive position is seeing how the player’s defense translates to the new position. Defensive numbers for catchers would be tough to compare to other positions, so I decided to lump all catchers together and see how they did as fielders. I took all catchers that caught a minimum of 10 games in any season from 2002 to 2009 and started any other position in the field. Then, I combined the UZR for all these players. Finally, I calculated the UZR/150 for these players and regressed the values a bit depending on the total games played. Here are the results:

catchD

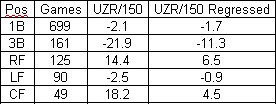
As a whole, catchers end up generally being fairly decent fielders, but seemed to take a little better to the outfield than to the infield. Looking at the numbers a little further, it can be seen that a catcher’s ability to throw translates well to the outfield. Here are the ARM components of UZR for the two corner outfield positions:

catchARM

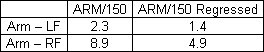
Most of the defensive value a catcher has in the outfield is in his arm.

Conclusions

Several outstanding hitting catcher prospects in the past had questionable defense and pitch calling skills while in the minors, but their bats were too good to keep them out of the majors. Carlos Delgado caught in 406 of the 524 games he played in the minors over five years, with games played at 1B coming only in the last two years. Once in the majors, he caught a total of two games, but went on to become a great-hitting first baseman. Victor Martinez on the other hand struggled a year or two behind the plate in the majors, but ended up becoming a passable catcher.

Teams understand the value of keeping a great hitter behind the plate. The usual positions that the catcher will eventually transition are considered to be positions known for good hitters (1B, DH, corner OF). In my opinion, a prospect will have to be pretty atrocious in his catching duties to move him away from catching considering the extra value a good-hitting catcher can bring to a team.


Wrist Injuries and Rickie Weeks and Troy Tulowitzki

A few days ago, I looked into Jay Bruce’s decline in power since his wrist injury last season. I asked our readers if there were any other players they wanted examined. Troy Tulowitzki, Derrek Lee, Jordan Schafer and Rickie Weeks were brought up. I don’t have the batted ball data around when Derrek Lee’s injury happened and Jordan Schafer was sent to AAA after coming off the DL, so neither of those two will be examined. That leaves Rickie Weeks and Troy Tulowitzki to be looked at closer.

I will be looking at the average distance in feet for the fly balls and line drives and the average angle they were hit towards (positive angle is to left field and negative number is to right field). The angle is important to look at because it shows that the batter is able to get the bat through the ball and drive it.

Rickie Weeks

Rickie is a nice test case since he has broken his wrist twice since making to the big leagues: once in May 2007 and the other time in May 2009. Here is a look at line drive and fly ball distances and angles for Rickie from 2007 to current:

weeks

I am not for sure what to make of the data exactly. Before either injury, he was driving the ball to left field and averaging 277 ft per hit. After the first injury, he never hit for the same power in distance and started hitting the ball more towards center field. This season, it looks like he has had a boost of power and is starting to turn on the ball a little more. I am wondering if his 2007 injury never actually healed until this past off season.

Also, I divided this year’s data into two time frames. It can even be seen that he is increasing his distance over this season. Again, the one year recovery on wrist injuries looks to hold true.

Note: As asked in my last article, someone pointed out that the weather may be a concern (flyballs travel further in warm weather vice cold weather). The difference is that the ball travels at most ~3 less feet in April compared to a peak distance in June.

Troy Tulowitzki

There is not much data since Troy’s return, but here is his data from the last 4 years:

tulo

Two pieces of information stick out to me right away, though.

First in 2008, he had much less power than in 2007 and 2009. Looking back to 2008, he had both a quadricep and hand injury during that season that may have slowed him down. I may also have to look if hand injuries have the same loss of power that wrist injuries do.

For 2010, he has hit for distance just fine, but before and after the injury, he was taking it more to center than he did previously. Since Troy has returned, he is hitting it even more towards center.

Further Research

I am really needing to get some good baseline data to work off of for future analysis. I will probably wait to start it this off season so I can use all of the 2010 data on injuries and batted ball data.