Beating FIP
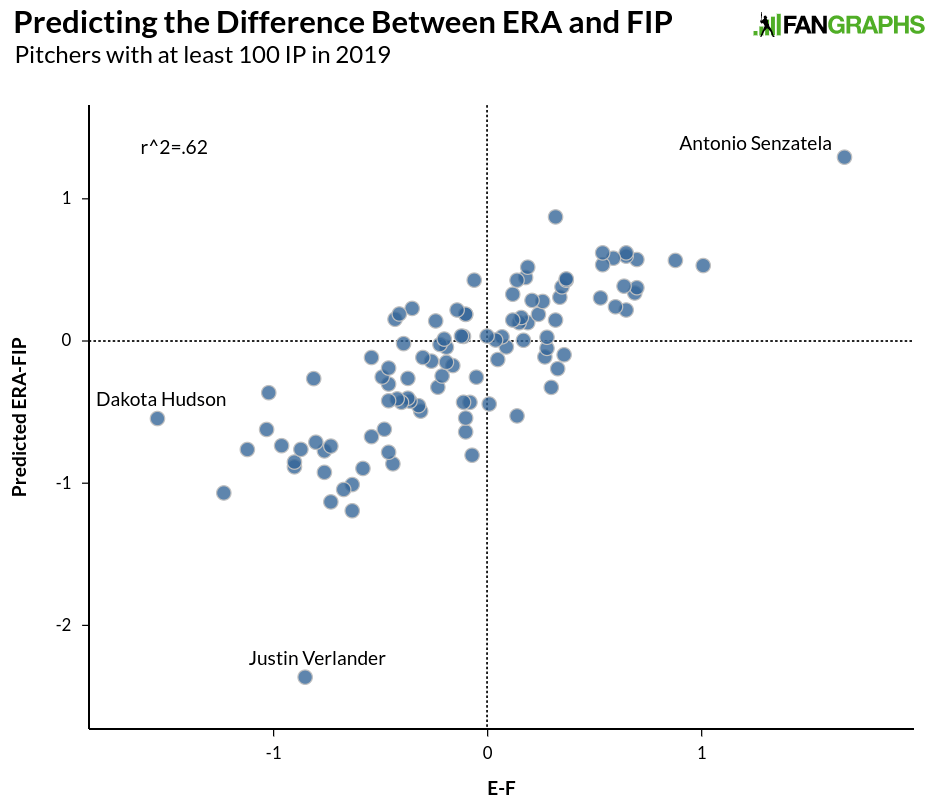
For the most part, a pitcher’s FIP is going to line up pretty well with his ERA over the course of a season or a career. There are 240 starting pitchers with at least 1,000 innings over the last 25 years and all but seven of them have a FIP within half a run of their ERA. Even over the course of an individual season, we typically see most pitchers with an ERA and a FIP around the same mark. Over the last 25 seasons covering more than 3,500 individual pitching seasons of at least 100 innings, the r-squared is .61. This season, there are over 100 pitchers with at least 100 innings; the graph below shows their FIPs and ERAs (all stats are through September 5):
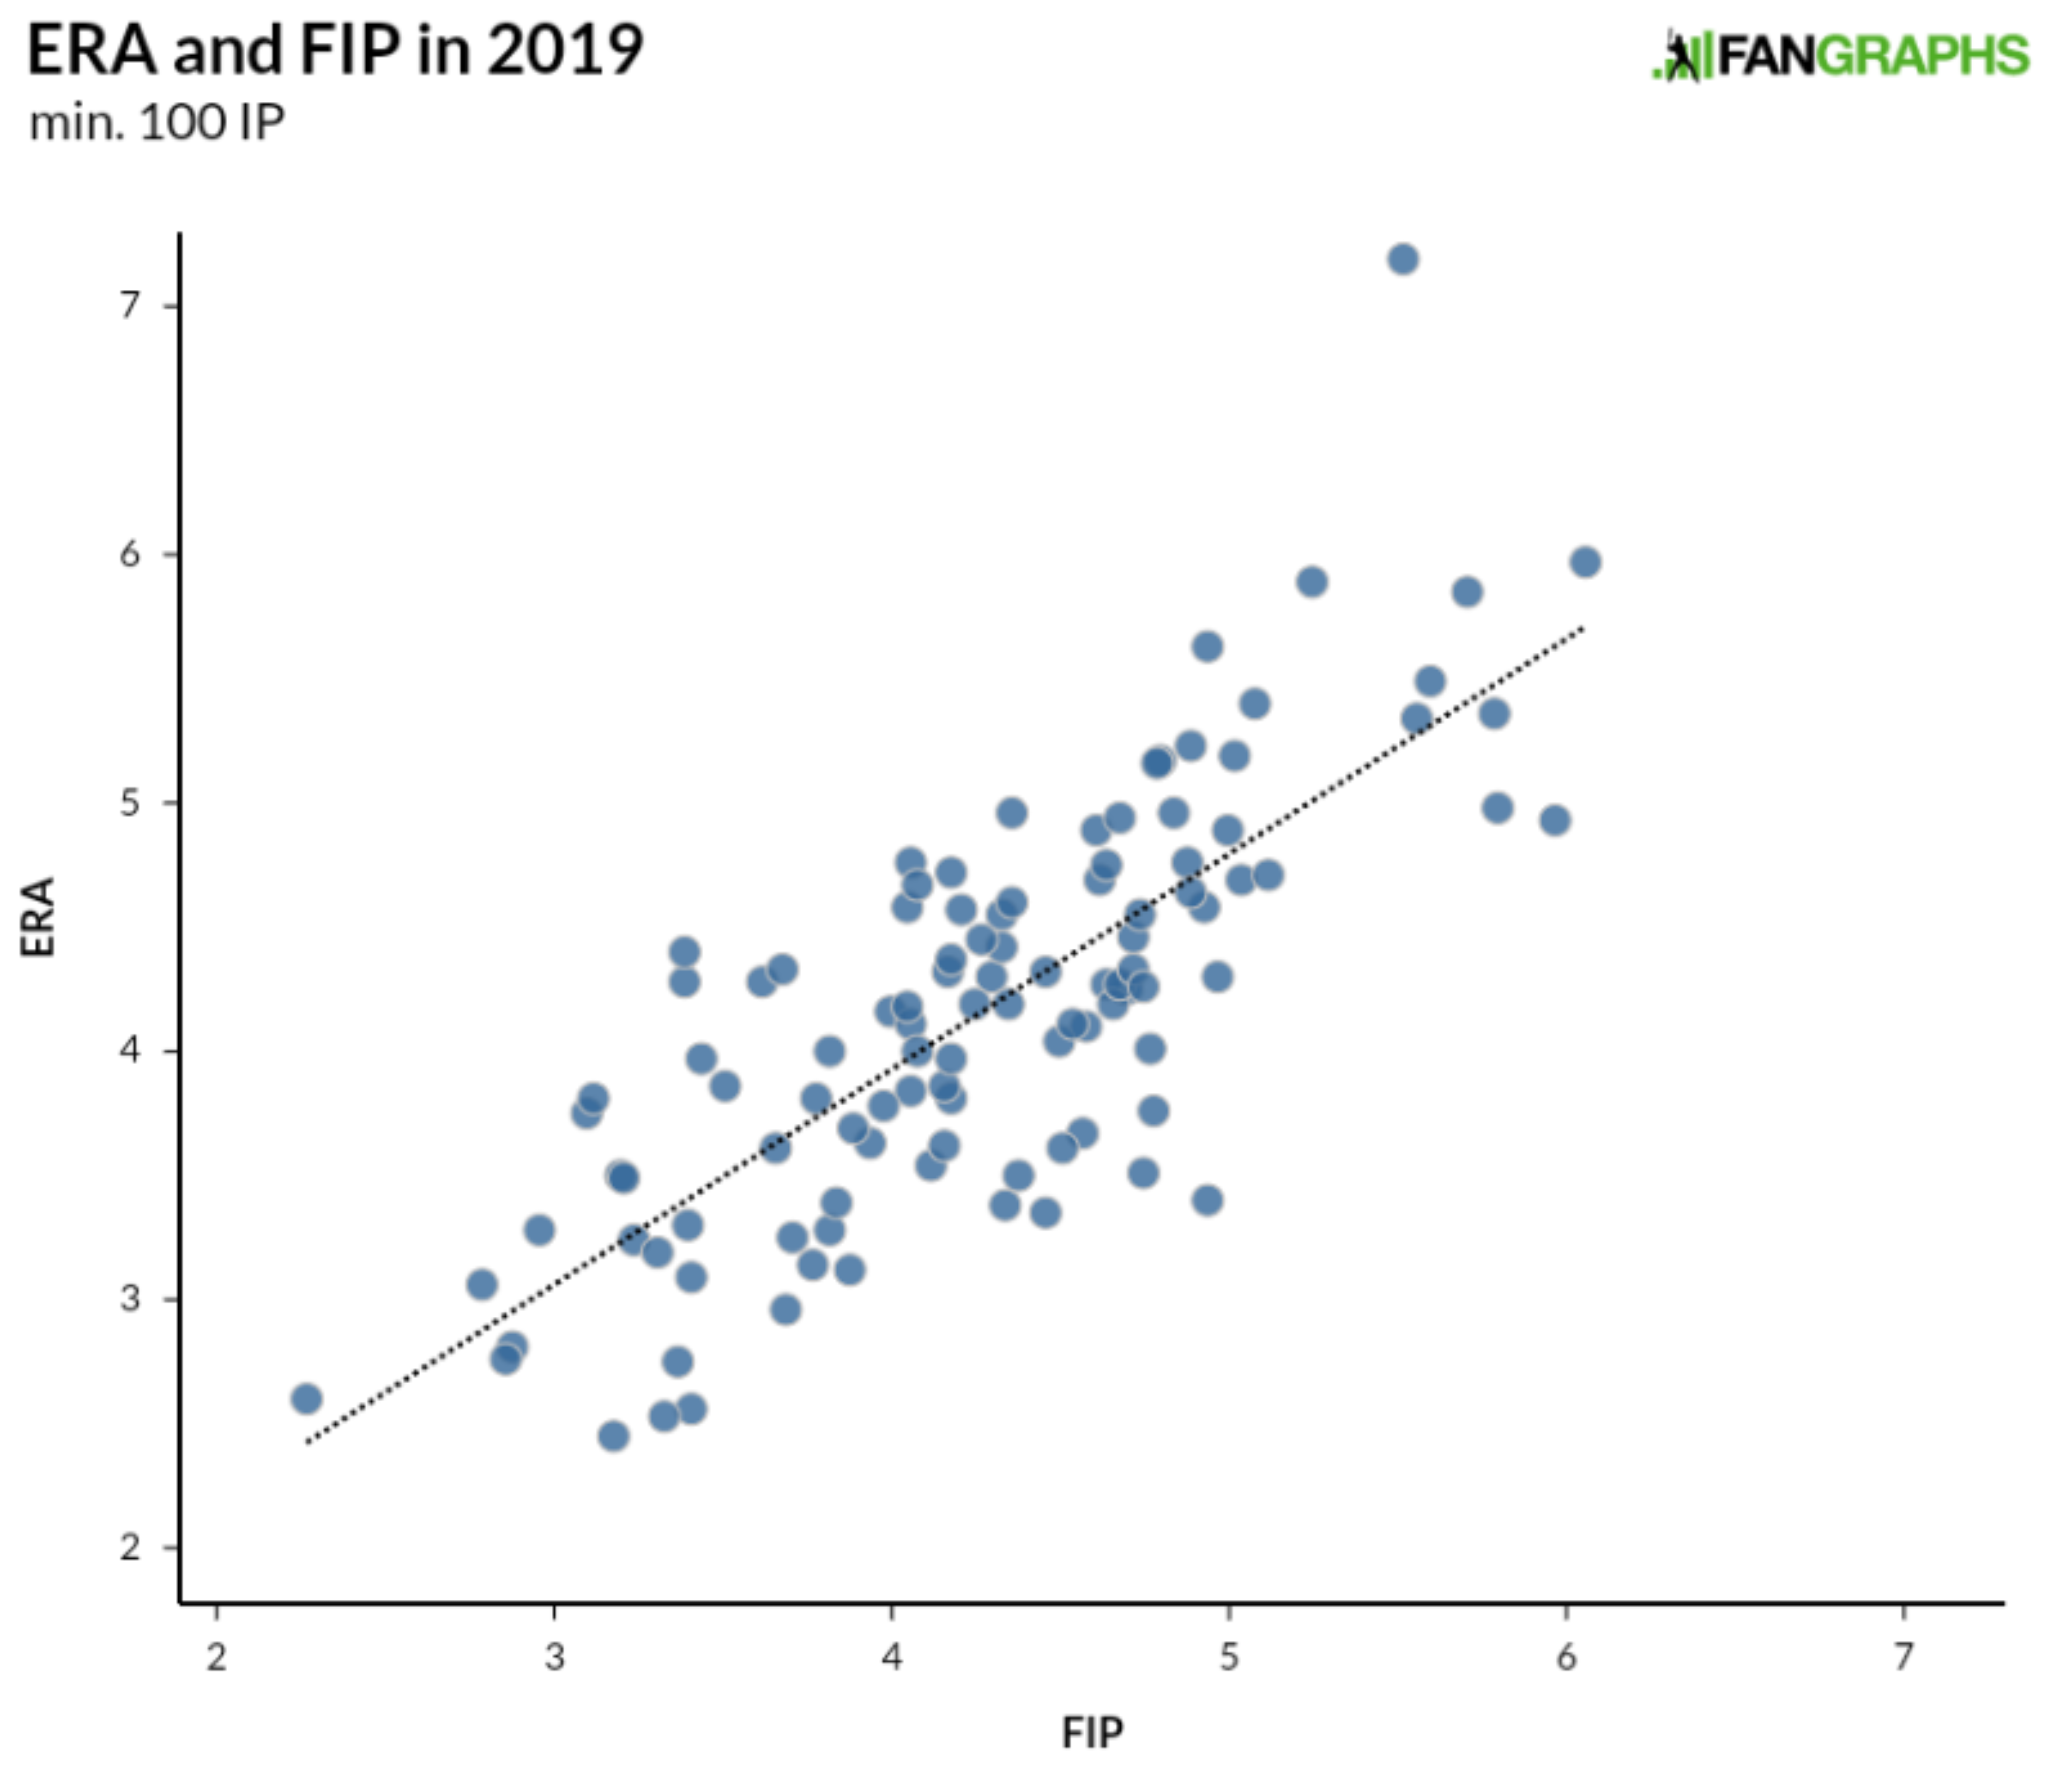 With the exception of Antonio Senzatela way up top, we see a pretty distinct pattern moving up and to the right. Within this cluster of players, there isn’t a perfect relationship. A perfect relationship would make one of the stats duplicative and useless. ERA and FIP both measure results on the field, with ERA accounting for the players who cross home plate after getting on base when the pitcher was on the mound (and the trip home wasn’t made possible by an error), while FIP measures strikeouts, walks, and homers. Every year, a good number of pitchers have an ERA higher than their FIP and vice versa. As far as explaining the difference between the two numbers using readily available statistics goes, BABIP and left-on-base percentage explain much of the gap between the two numbers.
That LOB% would explain some of the gap makes a lot of sense given that stranding more runners than expected is going to keep a pitcher’s runs allowed (ERA) lower than his general performance (FIP). We can see the relationship between ERA-FIP and LOB% for pitchers this season below:
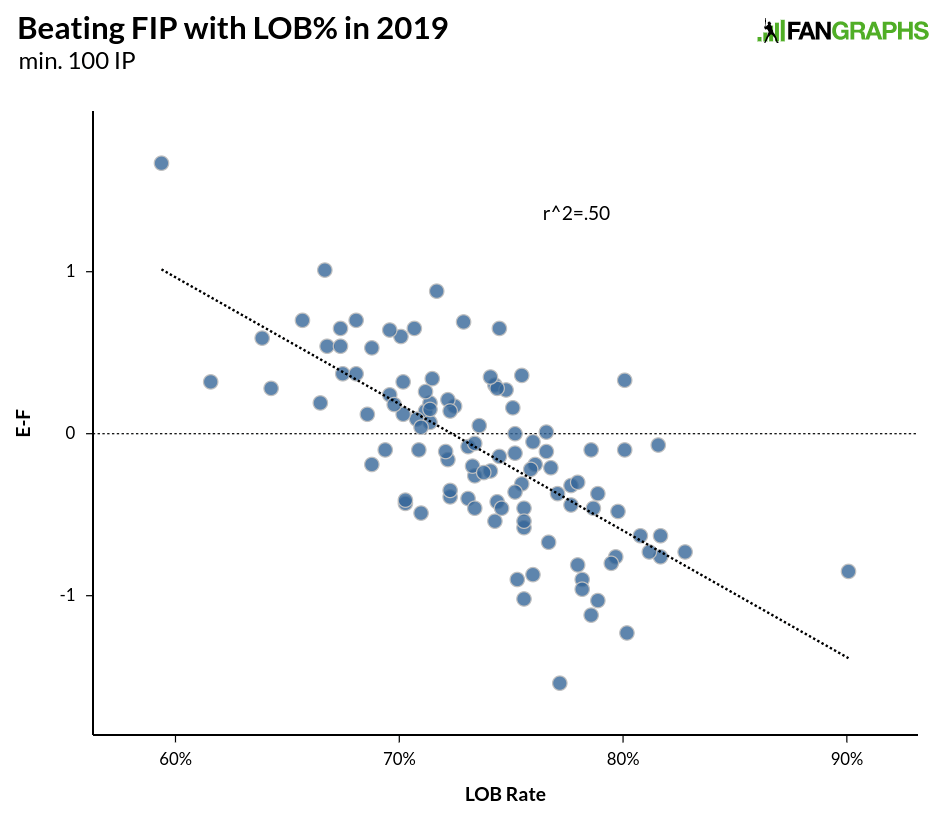
Without delving into whether there’s a skill involved in stranding runners (though better pitchers tend to have higher LOB% due to just being better at getting outs generally), we can see that the more runners stranded and the higher the LOB%, the more likely it is that a pitcher’s ERA is going to be lower than his FIP. The relationship over the past 25 years for individual seasons is stronger than the one above, with an r-squared of .56, but even over just one season, the pattern is apparent. What we are dealing with above is sequencing and what happens when runners are on base compared to overall performance. Generally speaking, pitcher’s perform similarly with runners on base and with the bases empty, with a slight increase in FIP for everyone with runners on base:
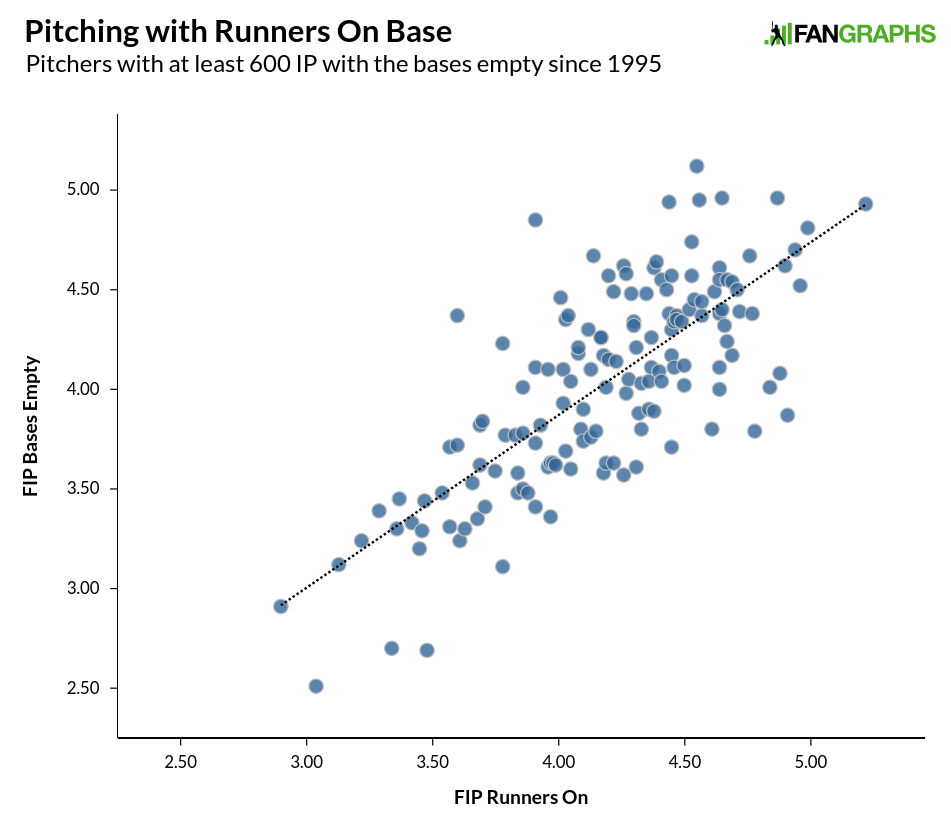
This isn’t to say that some pitchers aren’t worse pitching from the stretch, or that some pitchers don’t change their strategy to more effectively get batters out with runners on base. But generally speaking, pitchers perform a little bit worse with runners on base, though in a fairly uniform pattern as seen in the graph above. Unless you are Doug Davis, Scott Kazmir, Jeff Suppan, or Iván Nova, then with runners on base, you were within half a run with runners on base or worse.
We’ll get back to LOB% in a minute, but first, we should address BABIP. Here’s the relationship between BABIP and the difference between ERA and FIP:
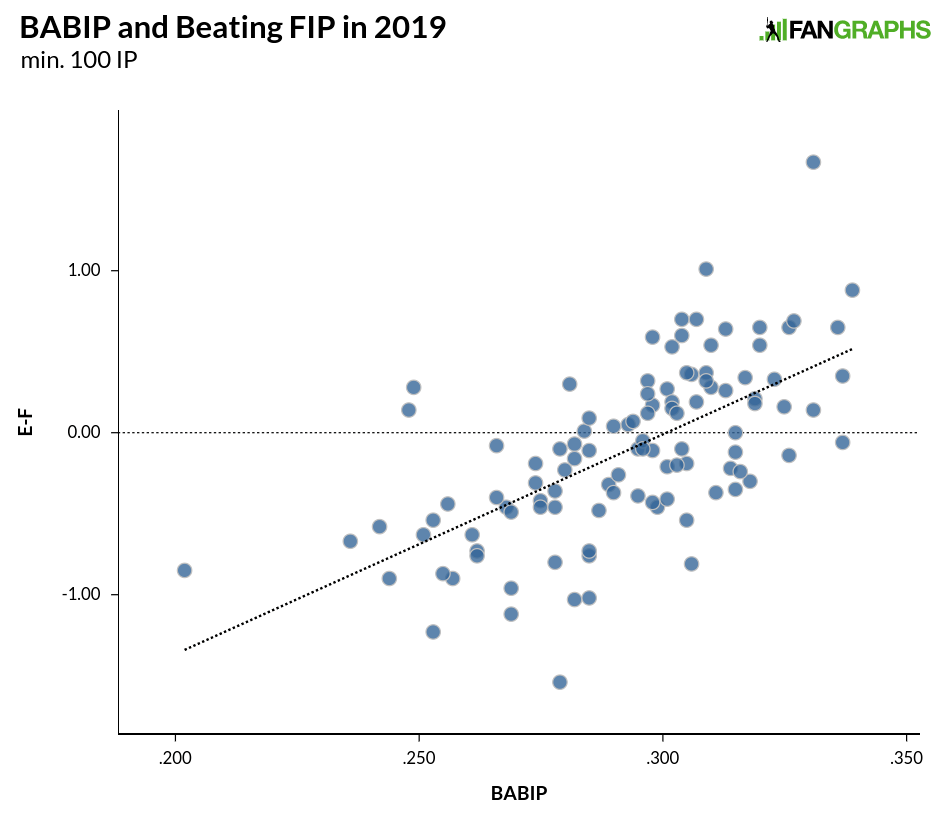
The relationship isn’t as strong as LOB%, but with an r-squared of .41 this season, we can still see a pattern. Over 25 years of individual seasons, the r-squared is .52, nearly the same as LOB% over the same time. While we know that pitchers exert some control over the quality of their contact, over 90% of pitchers with at least 1,000 innings since 1995 are between .270 and .310, and 65% of pitchers are between .285 and .305 (around 10 hits per year at the edges), so even at the extremes we are talking about maybe three or four extra hits per month. That’s not nothing, but over long stretches of time, we generally see the seasonal outliers get closer to their peers.
As for just how much BABIP and LOB% capture the difference between ERA and FIP, the answer is they account for the great majority of it. I took all individual seasons from 1995 through last season and ran them through a multiple regression calculator to come up with a formula for predicting the difference between ERA and FIP. The r-squared for the formula for the 3,400 seasons was .75, so BABIP and LOB% are doing a huge amount of the heavy lifting when it comes to explaining the difference between ERA and FIP. I put the same formula into this year’s numbers and this is how they came out:
We still see some outliers, but overall, the formula did a very good job predicting the difference between ERA and FIP using LOB% and BABIP. There are a few outliers. Dakota Hudson jumps out, but his larger ERA-FIP discrepancy is pretty easily explained by 15 unearned runs. If he had a more normal five earned runs, the difference would be under a run and he’d be in the big group with everybody else. Justin Verlander, on the other hand, appears to be breaking the formula entirely. To see how, here are 3,500-plus individual pitcher seasons with over 100 innings since 1995, and their LOB% and BABIP:
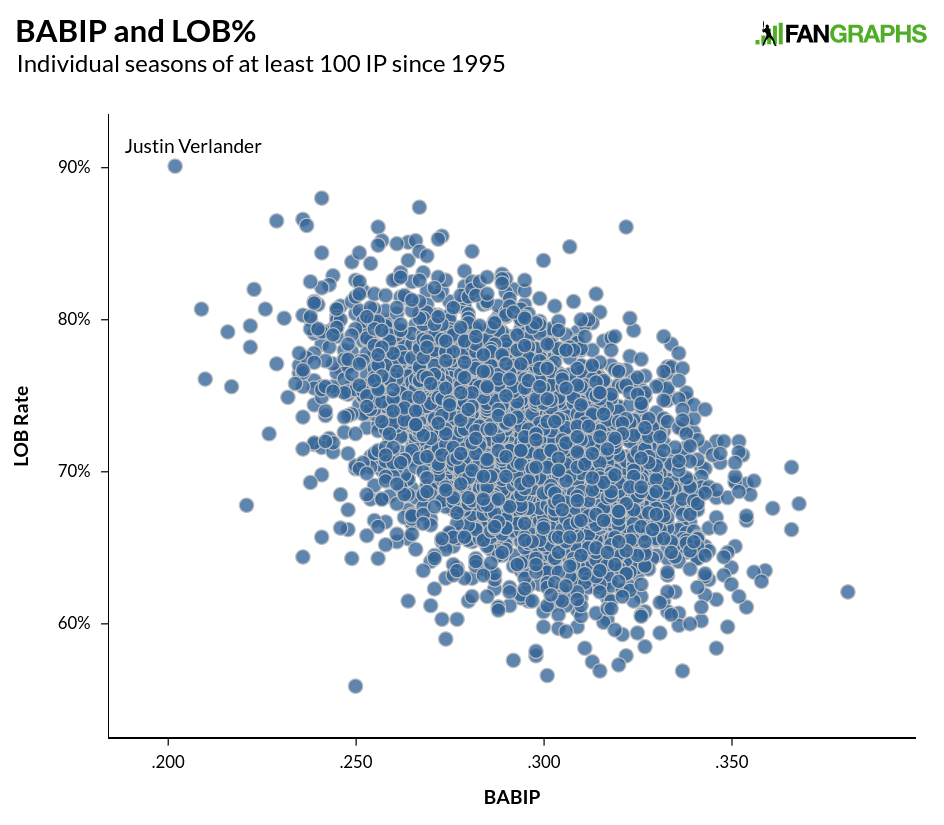
Quite simply, Verlander is having one of the most unusual seasons we’ve ever seen, with the highest LOB% and lowest BABIP in the last 100 years in the same season. As we can see above, there is some correlation between LOB% and BABIP, with an r-squared of .2, but that’s not as strong as either statistic’s relationship with FIP-ERA, and a pitcher’s BABIP’s relationship with his team’s BABIP is around the same strength, with team BABIP and team UZR having a slightly stronger relationship.
While there is certainly a case to be made that pitchers have control over the quality of contact they yield to some extent — no one would deny the existence of groundball pitchers or fly ball pitchers — BABIP doesn’t even necessarily measure contact quality. It counts every batted ball in the park as either a hit or an out, doesn’t include homers at all, and it varies greatly from year to year. Even xwOBA, which includes homers and dials in on the quality of contact, has difficulty finding a relationship year over year on contact. Looking just at in-season results, wOBA on contact has a difficult time becoming reliable.
It’s only natural to want to find a reason why a pitcher’s ERA and FIP are so different, and for that reason to be related to something the pitcher is or isn’t doing. Unfortunately, that isn’t always likely to be the case. In any single season, there are going to be outliers due to the relatively small sample of plate appearances we are dealing with, and almost all of the difference between ERA and FIP can be explained by BABIP and LOB%. While not all of a pitcher’s BABIP and LOB% are due to a pitcher’s defense, sequencing luck, and just general good fortune, a decent amount is just that. Baseball is a team sport and defenses play a large role in run prevention. While it isn’t always easy to admit, luck plays a role as well.
Craig Edwards can be found on twitter @craigjedwards.
Nice work.
Senzatela has an ERA of 7.19 and a FIP of 5.52 which means that either his point on the first graph is in the wrong spot, or the axis labels are mismatched.
Right. Labels were wrong. Should be fixed.
Good article. I disagree with the sentence, “Even xwOBA, which includes homers and dials in on the quality of contact, has difficulty finding a relationship year over year. ” It links to an article on xwOBA on contact by the author that shows the correlation on contact management is weak. However, overall xwOBA still has basically the same year-to-year correlation with wOBA as FIP per BP. In other words, xwOBA inaccuracies partly caused by xwoBA on contact, are equal with the inaccuracies of FIP partly caused by not including balls in play as part of the stat.
FIP isn’t perfect. xwoBA isn’t perfect.
Thanks. I meant on contact for the discussion in the paragraph. Just added it in the sentence for clarification.
Any discussion of beating FIP always leads me to think of Mariano Rivera. With some pitchers, it’s absolutely obvious why they consistently beat their FIP — just watching the guy, he repeatedly prevented hard contact, helped in no small part by the excessive number of broken bats on his cutter. Pretty difficult to make hard contact while breaking your bat. Sometimes there’s a pretty simple explanation for the difference.
I imagine the simplest explanation for Verlander is that it is mostly luck, with perhaps a sprinkling of him somehow “buckling down” with men on base.
I wonder if a more complicated answer might have something to do with his high home run rate. So he has excellent control, and is mostly throwing his fastball up in the zone. Hitters almost always either miss those pitches entirely or barely make contact, resulting in either a strike, a foul ball, a popup, or some other easy out. He rarely misses his spot, but when he does, batters make great contact and it’s often a home run.
That would explain the low BABIP and the high HR rate, and matches the strikeout to walk ratio.
He has the 5th lowest line drive rate and the 12th highest infield flyball rate, which seems to match my rough explanation above. He also has the highest flyball rate in baseball right now.
Like I said, it’s probably easier to explain this with luck and pitching differently with men on base.
After all, why wouldn’t he just aim for this low-BABIP style every year if he could really control it? Is there any way to check this?
I think it’s definitely because he has gone the 2 true outcome route. Looking at Verlanders splits this year, he has made opposing batters hit like “bad” Joey Gallo before the All Star break, and like Madison Bumgarner since the break.
Verlander appears to be about a 0.265 BABIP pitcher from 2015 through 2018. I’d guess this year he’s been so much lower because the Astros defense has been positioned incredibly well, he’s had some good luck on generating weak balls in play, and he’s some bad luck in that when batters crush a ball it ends up over the fence instead of for doubles.
I don’t think Verlander is a true FIP-beater. I think he’s just getting unlucky that hitters are hitting his mistakes better than normal.
I seriously doubt a well positioned defense is much of an influence on anything. You got any reasonable evidence of this?
Yeah, that’s a lot (also, it would have to be true of the entire staff, no?).
Reminds me of the great Yeats poem that ends:
O chestnut tree, great rooted blossomer,
Are you the leaf, the blossom or the bole?
O body swayed to music, O brightening glance,
How can we know the dancer from the dance?
How can we tell the shift from the defender who fields the ball from the coach who positioned him from the pitcher who located the ball from the catcher who called for it from the batter who actually swung at it…
That said, one of the big research/analysis areas right now has to be how to evaluate shifting’s effects on individual/team defensive efficacy, projection/development, etc, and I’m super excited about the future of the field!
I don’t think it is anything like that. You don’t need an over-shift to field a pulled groundball – you never did. The idea that players are making plays because of enhanced positioning is very questionable. I do not think data supports the results. Its not like defenders all stand in a line behind home plate at some point and only go to their positions after the analytics crew crunches a few numbers. A commonsense approach works pretty well.
I highly doubt that there is much research going into shift effects. If it were effective we would be beat over the head with it repeatedly. Just look at the FanGraphs shift split data – its embarrassing. Clearly nobody looks at it or uses it for anything. There are so many conversations that would need to be had to actually assess shifting and pretty much none of it happens. I watch baseball daily and I think shifts certainly give away more than they take. I am sure the data bears this out otherwise there would be a ton of very flawed arguments for shifting – and not even those exist. It is just blind faith and enthusiasm as far as I can tell. The closest thing to a justification I ever see is a spray chart suggesting that it is productive to stand three guys in one slice.
Your comment feels a lot like one from a person that doesn’t watch a lot of baseball, which is an increasing segment of fans. Ever follow a live cast of a game? The pitches are not in cold zones often nor do they avoid hot zones as much as you would think. I am not sure it is nearly as complex as you might think. There is the also a reality that pitches generally miss locations – often by a lot. Then there is the part where the locations the catcher sets up are rarely aligned with the defense. It all seems very disjointed to me as opposed to a dance with coordinated partners.
If some compelling but flawed data existed, then we could begin to talk about the problems but I don’t think that exists. Best I ever see is how slow dead pull hitters hit for low average on GB – which they would with or without a shift. Take a look at shift data – sometimes it is effective over a period, sometimes it is not. Then there is something called non-traditional shift which is like an automatic XBH – I very much question that classification and wonder if it isn’t used just to siphon off some additional negative outcomes from a traditional shift. The idea that there is a standard shift is flawed in itself.
From 2016-2019, wOBA is 0.021 points lower for shifts/strategic alignments on grounders than no shifts using baseball savant. Same time period, xwOBA is 0.003 points higher for shifts/strategic for grounders than no shifts. So despite have similar EV and LA on average, wOBA is significantly reduced on grounders when a team plays in an alignment other than traditional alignment. Astros are shifted the most.
I appreciate some kind of reply. I don’t usually get one, but I get plenty of down-votes which tells you a lot. What is a shift? What is a strategic alignment? I am skeptical of what gets classified as what. You need to accurately pull apart shifts to have anything meaningful to draw from IMO. Why limit it to GB? I imagine that shifts probably concede bases on other types of batted balls – they wouldn’t help much for sure. If shifts are effective, then some of them are certainly more effective than others. I am not aware that BABIP has decreased which should be what they do… it should naturally decrease as there are more FB and dead-pull hitters these days – both are easy outs. As of a few years back BABIP had remained pretty steady for many years. You just quoted wOBA, so maybe there is some BABIP evidence but there wasn’t as of some point a few years back.
My skepticism is related to how shifts are deployed. They certainly can be useful and have been around since Ted Williams but I see them used in completely inappropriate situations every game. I also argue that over shifts lead to more errors and fewer DP turned, so the problems are not all as simple as bases allowed to hitters. Some of those gain get given back for sure. I will go poke around baseball savant. Here is to hoping I can find something meaningful… send me a click path if there is something I should look at.
So the first I could find was a definition of shifts and strategic alignments. I’ll be honest, at the point where it is buckets that large I don’t really care. That strategic alignment example isn’t a shift – it just has a 2B playing deep, which isn’t an overshift by any stretch. I would guess that you get solid results from that as it isn’t a shift. They admit that they are not classifying anything with any accuracy in their definitions. The dumbest shifts involve players switching positions on the field – we all know what that one looks like and it isn’t even clear what bucket that goes in.
That said, I am going to have to figure out how to get the data because I am interested. I am not sure that the strategic alignment is a shift… its not in my book. At some point you are just calling things shifts that aren’t. Taking one more step back doesn’t constitute a shift in my book. I think taking one step in a direction is a good idea… just as it has always been. I hope it isn’t too clunky to dig into that data.
It appears that strategic is worse than no shift and a shift is effective at least this year. I still have lots of questions and doubts, but that strategic bucket is probably worthless. Queries take forever so that makes it tough to look at.
Alright last reply…. the more I look the weirder it is. Some alignments are worse for BABIP but better for wOBA and they are all over the place in general. To me it all hints at a lack of predictability. I can’t draw any conclusions that make any sense. I am sure the historic data is better as I am just looking at 2019. If we cold get some decent generalizations in place, then we could move on to criticisms with the methodology but I can’t find a solid starting point or anything to run with. I’ll try lol
Astros are second in shift runs according to DRS with 37 runs. Astros pitchers as a team have the lowest BABIP. Yet, the Astros defense based on individual skills is ranked as 20th in defense by URZ.
Now I want a post on the Astros defense!
Damn, within the first sentence, you are already wrong.
“Yeah, but that 2.86 FIP doesn’t take into account some following facts about Ryu at all (and that’s why he has always outperformed his FIP, except for ’14; there are many variables at play here, so outperforming FIP literally every year is nearly impossible).”
Even Jered Weaver, arguably one of the most extreme fly-ball/pop-up pitchers in baseball history, with a .273 career BABIP in 2067.1 IP, could not accomplish the feat.
ERA-FIP
’06: -1.34
’07: -0.15
’08: +0.43
’09: -0.29
’10: -0.05
’11: -0.79
’12: -0.93
’13: -0.55
’14: -0.61
’15: -0.17
’16: -0.56
’17: -0.68
Career: -0.44
Half a run? You’ve got to be kidding!
Let me ask you a question: did your boss ask you to write an article defending FIP?
Wut?
The reality is, no really smart FO in MLB gives a shit about a metric like FIP or even wRC+
“Ken Rosenthal of The Athletic (subscription required) did report yesterday that the team saw him as the second-best free-agent infielder this winter, and that their internal metrics indicate LeMahieu has been systematically undervalued offensively.”
Below is a bit from Tony Blengino’s article on Brian Dozier and DJ LeMahieu.
“Now let’s talk about another second baseman who has yet to sign. DJ LeMahieu is projected to record 2.4 WAR in 2019 by Fangraphs. I’ll take the over. He’s a mirror image of Dozier in a lot of ways, possessing traits that promise to age better than tendencies to pop up and pull the ball softly on the ground.
LeMahieu’s career 92 OPS+ (according to Baseball Reference) pales in comparison to Dozier’s 108. I’m going to come right out and say that this is laughably wrong. Sure, LeMahieu has played virtually his entire career with comfy Coors Field as his home park. Park factors are applied uniformly to all players in most publicly available metrics. I’m here to tell you that LeMahieu doesn’t deserve to be dinged for playing in Coors (in both OPS+ and WAR), as he has received very little benefit from doing so.
You see, LeMahieu has always been a fairly extreme ground ball hitter, never closely approaching a league average fly ball rate. He hasn’t caught launch angle fever; his average of 5.8 degrees was over a full STD lower than league average last season, and even that was way up fro his 2.8 degree mark in 2017. I’ll put a full piece up on my Ball-In-Play Based Park Factors soon; Coors blows up offense on flies and liners, but not grounders.
Besides the high grounder rate, there is one other notable BIP frequency trait to be noted here. LeMahieu has always, prior to 2018, ranked near the top of the league in liner rate. His 2018 .276-.321-.418 line is basically his floor. He’s a true-talent .300 hitter who is very likely to see a liner rate spike moving forward.
While all those grounders he hits puts a pretty hard cap on his power upside, the significant authority with which he hits them – and his ability to avoid shifts by spraying them around the field – is responsible for that high floor. His Adjusted Grounder Contact Scores of 148, 152 and 135 in 2016-18, coupled with his consistently high liner and low strikeout rates, mark him as a guy who can sneak in and win a batting title, as he did in 2016, with or without Coors Field.
His OPS+ figures were 128, 93 and 88 in 2016-18; his “Tru” Production marks were 142, 114 and 112. And remember, “Tru” Production transcends park effects. LeMahieu has clearly been unfairly penalized by publicly available metrics for playing his home games at Coors Field.”
Below is a bit from Fangraphs’ sabermetric library.
What Park Factors Get “Wrong”
As I said before, park factors aren’t perfect for a variety of reasons. They do a nice job on average, but in specific cases they fail to properly capture the nuances of the game. For example, Target Field is actually a slightly above average park for hitters. It’s on par with Yankee Stadium in fact, despite the much different dimensions. However, if you’re talking specifically about left-handed home run power, Target Field is a desert and Yankee Stadium is an oasis.
The problem with park factors as they stand right now is that while we’re trying to adjust for the run environment, the run environment is difficult to capture is a single number. Lefties and righties experience the world differently, but so do ground ball/fly ball guys and guys with speed and guys without.
It’s safe to say that AT&T Park is a bad place to hit and Coors Field is a good place to hit, but parks don’t affect every player evenly and our park factors sort of assume that they do.
In the future, you could imagine a world in which we could know what the average outcome of a batted ball might be (i.e. the average outcome across all 30 parks of that swing is .25 singles, .15 doubles and so on) so that we can compare the observed outcome to the expected outcome, but we aren’t there yet.
This is like being asked to explain what you mean by a word and copying/pasting the dictionary as a response
Wrt to the last sentence, we could also imagine a future with DRC+, which takes into account the park, the handedness of the hitter, the offensive event, as well as many other factors.
/r/murderedbywords
It seems to me that LOB% and BABIP should be correlated and doesn’t really make sense to look at them separately.
If a pitcher like Verlander has such a low babip against, hence fewer base runners, then wouldn’t it stand to reason that the few runners that do get on base are more likely to not score? A pitcher that gives up 1 hit every inning probably doesn’t give up half the runs as another pitcher who gives up 2 hits every inning. Because stringing together hits are what drives in runs, except of course solo HRs that seem to make up majority of Verlander’s runs given up.
I think a lot of these things are interconnected. Verlander throws a lot of high fastballs. Those fastballs are more likely to leave the yard when hit well. But when they don’t, they tend to be Ks and fly balls, which have lower babip than groundballs. And furthermore higher Ks lead to better LOB% since Ks don’t move runners, etc. That there’s a lot of cause and effects here where perhaps his particular talent and the way today’s hitters approach the plate come together to this ridiculous season.
Nice article, thanks, Craig! I’d have to think the timing of this is related to the great/weird season Verlander is having, because I’ve definitely noticed more discussion in the last couple of months in general from baseball fans about the role of FIP in calculating WAR during Lance Lynn vs Verlander Cy Young debates. Verlander’s extreme BABIP/LOB % season and the fact that he’s right in the thick of the Cy discussion has kind of brought it to the forefront.
Verlander has given up 33 HR this year, but thanks to his excellence in preventing baserunners in the 1st place, 27 of them are solo shots. Solo HR don’t show up in either BABIP or LOB%.
Funny this article should come up now. I was just looking at the qualified leaderboard recently and sorted by E-F and it seems to me a lot like the one big thing a lot of the overachievers have in common is high GB rates. Dakota Hudson, Wade Miley, Mike Soroka, Sonny Gray, Ryu, Kershaw, Castillo, Nova. He just fell off the qualified boards, bu Arrieta is another guy who kills worms and beats FIP (5 straight years of beating FIP by varying margins).
The king of GB%, Zack Britton, has beaten his FIP by over a run since becoming a reliever in 2014 and Brad Ziegler beat his FIP by 3/4 of a run over his 717.1 IP career. Mo Rivera also beat his FIP by over half a run while being a pretty strong GB pitcher as well. Of course, all 3 also crushed hard contact and generated tons of soft contact so that obviously is a factor as well.
Has there been any sort of research on whether GB rate would predict any variance from FIP?
Here’s Jeff Zimmerman from 2015 https://tht.fangraphs.com/kwera-the-starting-point-for-pitcher-evaluations/
and Eno recently: https://theathletic.com/1171344/2019/08/30/is-a-pitchers-ground-ball-rate-more-important-in-todays-game/
Another commonality is lower than average K rates (8 of the top 10 E-F overachievers, with Verlander and Kershaw being the exceptions). The top two E-F overachievers, Hudson with 6.79 K/9 and Fiers with 6.12 K/9, have extremely low K rates.
The two most overvalued inputs in most “advanced” analysis are HR allowed and Ks. HR are just massively over-weighted while outs not stemming from Ks go mostly unappreciated.
I believe the only hits calculated in the FIP formula are HRs and the only outs calculated in FIP are Ks. This is a significant flaw in the formula despite the reasons for exclusion. Also, if pitchers have little impact on BABIP (which seems illogical when you look at pitchers’ career stats) and catchers have significant impact on Ks with pitch-framing (which is frequently stated on this site), the rationale for the components of the formula seems inconsistent.
Outs not stemming from Ks are not nearly as well correlated year to year. Marcus Stroman is an example, with ERAs all over the place:
2014: 3.65
2015: 1.67 (only 27 IP)
2016: 4.37
2017: 3.09
2018: 5.54
2019: 3.42
That’s what happens when you put everything in the hands of your defense. The vagaries of BABIP can screw you or help you.
Compare to Verlander or Scherzer, who both have great K rates and very low GB rates (37%). Their ERAs are very consistent.
I don’t think it’s fair to compare two future Hall of Fame pitchers to Marcus Stroman. How about Greg Maddux? He has a much lower career K rate than Stroman (6.06/9 for Maddux; 7.33/9 for Stroman) and was very consistent.
Julio Teheran
I want to know how he does it on a yearly basis because it means that there seems to be some sustainability to beating your FIP, in some circumstances.
I really enjoyed this and would love to see more article like it. Great work.
Verlander with a (almost) career low line drive rate as well, which tends to be less predictable right? Maybe the BABIP already factors that point. Interesting article, thanks.
I think this article is failing to address the main criticism about your last article on Verlander.
In a single season, I don’t think anyone would argue that for the most part, a pitchers BABIP is more a reflection of luck and bad defense than the pitchers skill. This is because BABIP has been shown to take a long time to stabilize for pitchers – much longer than it takes to stabilize for hitters, as you correctly point out.
1) But with Verlander, BABIP suppression has not been a single season phenomenon. Over his career he has shown the ability to limit BABIP significantly. His career .280 BABIP over nearly 3000 innings is significantly lower than the league average in that time, and he has played with plenty of awful defenses in that span. Indeed, in Derek Karty’s research at Baseball Prospectus on pitching, he found that a pitcher’s actual BABIP becomes predictive of more than 50% of the variation in future BABIP after 3700 balls in play (roughly 8 seasons), a mark that Verlander reached many years ago. So we do know that Verlander’s BABIP suppression is an actual skill.
2) Verlander’s BABIP suppression has not been insignificant; it has made him much more valuable than fWAR would indicate. Indeed, if you look at the “value” section of his FanGraphs page, he has accumulated an extra 11.9 “BIP Wins” over the course of his career. And again, after this long of a sample size BABIP has in fact been shown to be at least somewhat of a pitcher skill.
3) Similar to BABIP, home run to fly ball rate is also a statistic that varies significantly from season to season. In fact, HR/FB takes more than 9 seasons to stabilize, even longer than BABIP. In this sense, it is perhaps just as much a product of luck and randomness as BABIP is. FIP (and fWAR), however, decide to treat home runs as something the pitcher controls, and penalizes pitchers for allowing home runs.
4) It also just so happens that Verlander this season has a career high home run to fly ball rate, well out of line with his career averages, even after taking into account the juiced ball. We can see this when we compare Verlander’s FIP and xFIP over his career: his career FIP is 32 points lower than his career xFIP, but this season his FIP is 5 points higher than his xFIP. Not only has Verlander shown an ability to limit BABIP over his career, he has also shown an ability to allow fewer home runs per FB than league average as well. In this sense I would argue that he has been unlucky in terms of his home run to fly ball rate, perhaps a product of his home ballpark (the Astros as a whole have the 5th highest HR/FB rate in baseball).
In conclusion, if we want to estimate how good Verlander has been this season, I don’t think we should be looking at FIP. FIP assumes that his high home run rate this season is a product of skill, which seems highly unlikely when considering that a) HR/FB rate is essentially meaningless in a single season and b) Verlander has actually over his career allowed fewer home runs per FB than the average pitcher, not more. FIP also assumes that a pitcher has no control over balls in play, which may be a good assumption when looking at one season, but simply is not accurate when looking at much larger sample sizes, which we have with Verlander, who has a significantly lower BABIP than league average for his career.
Does that mean we should just look at his ERA or RA9? Of course not. But Verlander’s SIERA this season is 2.99. That’s probably a good start. If we subtracted 40 points from Verlander’s xFIP (his career ERA is 40 points lower), we would arrive at a very similar 2.90. There are simply better ways of estimating a pitcher’s talent than looking at FIP, especially in the case of someone like Verlander.
While players generally perform better at home than the road, I think it is instructive to note that while playing for Detroit, Verlander’s away BABIP was .299 and his 3.51 FIP was lower than his 3.78 ERA. It’s possible the park in Detroit was doing a lot of the work.
Also, to add to my previous comment, we know that flu balls have a lower BABIP than ground balls, so it’s not as if it’s a total mystery that a fly ball pitcher like Verlander has a lower than average BABIP over his career. Fly ball pitchers like Tyler Clippard, Marco Estrada’s, Jered Weaver, Chris Young, and many others have been able to do the same thing as well. It’s ok to admit that there are certain pitchers who have been able to beat their FIP.
If you inspect just the residuals, it seems the E-F, BABIP relationship probably isn’t a linear one. So why explore an argument that depends on it being one. Just fit the data and see what function does describe it. Then build a likely more interesting argument from that.
Well done – excellent article, good use of statistics and logic, good supporting graphics. This kind of article is exactly why I read FanGraphs. Thank you.
The opposite premise is much easier to find good reasons for (underperforming fip). Watching every Mets game for years gives an easy example.
Degrom year in year out performs at, or better than his fip, despite constantly having what is considered a sub par defense, one thing that can contribute to over or underperforming fip. He’s also always been good to elite at controlling the running game, something that fip doesn’t account for but ERA quite obviously does.
Syndergaard on the other hand is underperforming his fip by around .6 points this season and is -.35 for his career. He’s notorious for being one of the worst in the sport at controlling the running game.
If every single you give up magically morphs into a double or triple, it’s pretty easy to see why you would always get ‘unlucky’ on your fip vs ERA.
On a whim I looked up Andy Pettite’s whip vs ERA, since he was the first name that popped into my head for impossible to run on. Turns out he slightly underperformed his whip for his career, so I guess holding runners well isn’t necessarily a big factor for beating whip, but not being able to stop them at all is definitely a negative factor.
That’s an excellent point. While it may not have a significant impact across the board, with Syndergaard (and a few others) it surely must. BTW, does Syndergaard have a legitimate beef regarding Ramos, or is he pissing in the wind? Also, in your last paragraph, you said WHIP vs ERA. Did you mean FIP, or am I missing something? Thanks.
This info is a couple of weeks dated from when I did a short write up where I theorize that lower velocity pitchers out- performed their ERA at a higher rate than high velocity.
Top 8 pitchers that threw the most 2 and 4 seam fastballs 91 MPH and lower out performed their FIP by +0.61
Top 8 pitchers that threw the most 2 and 4 seam fastballs 97 MPH and higher underperformed their FIP by -0.05.