Ten Years Later, Jameson Taillon Has Changed (Yet Is Much the Same)
Jameson Taillon was 20 years old when he was first featured here at FanGraphs in September 2012. Drafted second overall by the Pittsburgh Pirates out of Woodland (Texas) High School just two years earlier, he’d only recently been promoted to Double-A when he sat down for an interview. The subjects at hand were his repertoire and his early-career development as a professional pitcher.
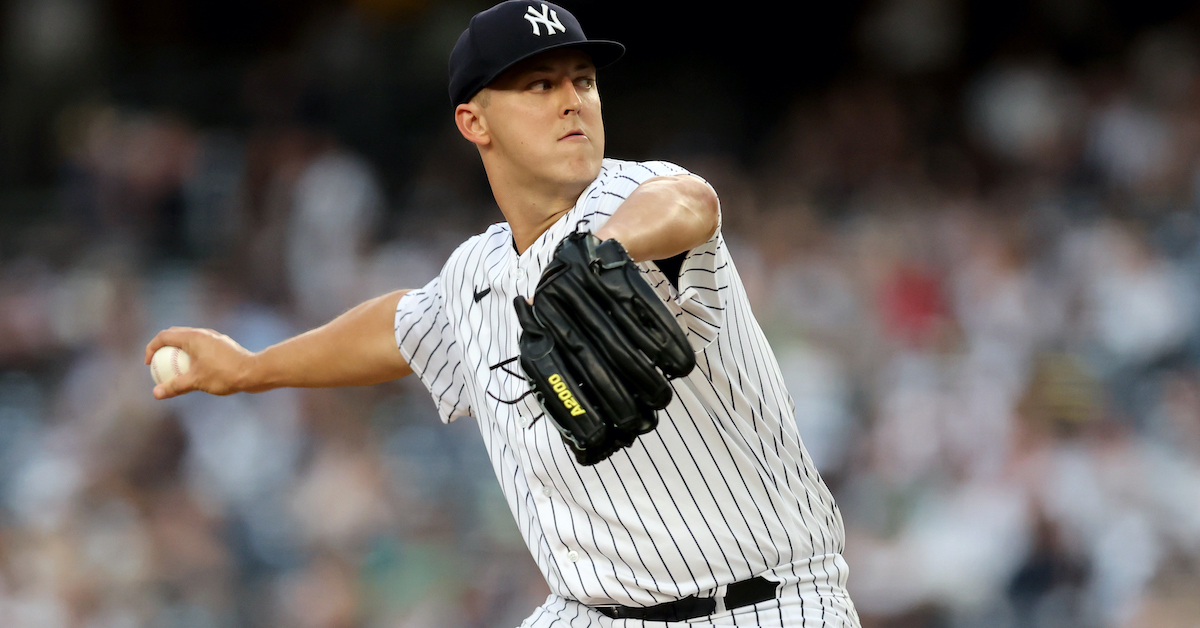
A decade later, Taillon is now pitching for the New York Yankees. Acquired from Pittsburgh prior to last season — this after missing most of 2019 and all of the shortened 2020 season while recovering from Tommy John surgery — the 30-year-old right-hander is having a solid campaign. In 23 starts comprising 127.2 innings, he is 11–3 with a 3.95 ERA and a 4.02 FIP.
Taillon discussed his decade-long evolution on the mound when the Yankees visited Fenway Park this past weekend.
———
David Laurila: You were in the minors when we first spoke 10 years ago. How would you describe your progression as a pitcher since that time?
Jameson Taillon: “One of the interesting things about pitching is that you’re in constant pursuit of trying to get better. The trends change, the hitters change, the scouting reports change. But I feel like I’ve kept a lot of my strengths the same. My curveball is still a pretty decent pitch for me, I throw a four- and a two-seam, just like I did 10 years ago.
“I’ve added a slider. I’ve probably used the changeup a little bit more in the big leagues than I did at the beginning of my career. But yeah, for a while there I was heavy sinkers and ground balls. Last year I went heavy four-seam. Now I’m kind of finding that sweet mix, that balance.”
Laurila: Is that mostly based on feel? Read the rest of this entry »