Benny Sieu, Mark J. Rebilas, and Michael McLoone – Imagn Images
This early in the season, no game is must-win. There are months and months of baseball left to play. Almost nothing has been decided. But still, the Brewers needed yesterday, at least to keep things feeling hopeful in the Cream City. The team’s first win of the season was a 5-0 shutout of the Kansas City Royals. Three of their four NL Central rivals lost. Christian Yelich hit his first home run of the year. Their season wasn’t doomed if yesterday didn’t happen; it’s not magically fixed now. So let’s look into what’s gone wrong so far and decide whether it’s legitimately worrisome or just one week of baseball.
Jackson Chourio Has Started Slow Jackson Chourio has been really bad this year. Entering today’s action, he was running a 47.8% strikeout rate and hadn’t walked or homered. To that I say: So what? It’s been five games. You can’t even make a reasonable argument about what happens after he puts the ball in play; before today, he’d hit four fly balls all year, and only had 12 batted balls period, and half of them had been hit hard.
If you want to point to anything as being worrisome, it’d be his approach at the plate. But I don’t think that’s a big cause for concern. Chourio has swung and missed quite a bit this year, but you want to know a secret? Chourio has some swing and miss in his game. In his superlative 2024, he chased more frequently than the league average, swung at pitches in the zone less frequently than average, and made contact at a below-average rate when he did swing. All that, and he still didn’t strike out particularly frequently, because he was very aggressive early in counts and then shortened up, with fewer very hard swings and more contact, in two-strike counts. Read the rest of this entry »
Like you, I have read roughly a thousand articles about torpedo bats in the last four days. The bats, which look funny to us right now and will look normal to us in a couple months, taper at the end and bulge slightly at the sweet spot. Like so many good ideas, transferring that mass from the end of the bat, where the batter doesn’t want to make contact, to the sweet spot, where they do, is so simple that it teeters back and forth between elegance and silliness. Reasonable people can smack themselves in the forehead and think, “How is it possible that nobody ever thought to do this before?” Reasonable people can also giggle at pictures of big chonky bowling pin bats.
This innovation was possible because the rules around bats are fairly permissive. The rulebook spends one page on bats and nearly three pages on balks. Given that those three pages do almost nothing to clarify what does or does not constitute a balk, one page for bats seems pretty slight. In fact, we can boil the rules down to one quick sentence. As Patrick Dubuque wrote on Monday for Baseball Prospectus, bats must be solid wood, round, shorter than 42 inches, and no wider than 2.61 inches. That’s pretty much it. Not only does that sentence not contain many rules, but those rules also give batters some serious latitude. No one on earth is using a 42-inch bat. That’s 64% as tall as Jose Altuve. Marucci and Louisville Slugger don’t even offer bats that are longer than 34 inches. Babe Ruth’s famously enormous bats topped out at 36 inches. Fungo bats top out at 37, which means they’d be perfectly legal to use in a game, and they’re not barely even half an Altuve. The rulebook might as well say that bats may only be as long as the Mississippi River.
Apparently, no one was approaching the diameter limits either. There’s a good reason for that. If you were to increase the width of the barrel to the maximum 2.61 inches, until recently, you’d also be increasing the entire head of the bat too. You’d end up with a bat that was too heavy, and more specifically, too top-heavy. You’d feel like you were swinging a sledgehammer. That’s way too much mass to add to the bat. Eventually, someone was going to realize that you don’t have to increase the entire head of the bat.
Brad Penner-Imagn Images
Researcher Erica Block found this idea (under the name the “bottle bat”) lurking in the American Journal of Physics all the way back in 1963, but the someone who finally made it happen was physicist Aaron Leanhardt, who taught at the University of Michigan for seven years. He is now the Marlins’ field coordinator and was working in the Yankees’ minor league hitting department when he had the idea. “It wasn’t until now that maybe anyone really thought about this, myself included,” Leanhardt told reporters. “You show up every day, you put the glove on you’re given, swing the bat that you’re given, you put the spikes on that you’re given and you go about your day as best as you can, and every now and then, it takes time to question what you’re doing. Couple of years ago, some of the hitters started questioning what they were doing and I just kind of responded to their questions.”
The answer to those questions is simple enough that the physicist can boil it down to a sentence. “It’s just about making the bat as heavy and as fat as possible in the area where you’re trying to do damage on the baseball,” Leanhardt told The Athletic’s Brendan Kuty. A ballplayer without a physics degree can sum it up too. Wrote Jazz Chisholm Jr. on social media, “you just move the wood from the parts you don’t use to the parts you do!” The parts you don’t use are the reason the torpedo bat works in the first place. As it turns out, you can break a bat down into three distinct parts. The example below uses Cody Bellinger’s traditional CB35 model, made by Louisville Slugger.
No wonder Bellinger ditched this hunk of mostly garbage for a torpedo bat.
The truth is that nothing matters but the barrel. When Statcast first started releasing exit velocity data, we naturally gravitated toward a player’s average exit velocity. However, smart people quickly started focusing on other metrics like maximum EV, 90th or 95th percentile EV, and best speed (which Baseball Savant has since renamed EV50). Those other metrics are useful specifically because they completely ignore weakly hit balls, which were skewing the sample. Here’s Tom Tango’s now classic graph that explains why they set the cutoff for hard-hit balls at 95 mph.
As he put it, that’s where exit velocity starts to matter. If you hit a ball off the end of the bat, you’re going to hit it weakly. If you remove some mass from the end of the bat, you’ll hit it even more weakly, but who cares? There’s hardly any difference between balls hit 80 mph and 60 mph. However, once you get past 90 mph, hitting the ball flush, that graph gets mighty steep. Every extra mile per hour really, really matters.
Leanhardt explained to ESPN’s Jeff Passan that he used the concept of a “wood budget” to think through the idea, getting more wood on the sweet spot without increasing the overall weight of the bat. “Every penny counts. The fact of the matter is you want your barrels to count the most. You want the most bang for your buck there.” Expanding and strengthening the sweet spot by packing it with as much mass and density as possible helps toward that goal. Adjusting the location of the sweet spot so that it’s right where you tend to make the most contact helps toward that goal. Traditional bats have junk in the trunk. Torpedo bats bring the trunk to the junk.
In order to get a better understanding of the forces at play, I reached out to Vivienne Pelletier, a PhD candidate in materials science at Arizona State University and one of the brightest baseball minds in the public sphere. She explained the finer points of collision efficiency and pointed out something really fascinating. Even after super-sizing the sweet spot, its exact center is still not the optimal place to hit the ball. As it rotates, the bat moves faster toward the head, meaning there will always be a spot just past the sweet spot where the fractional increase in velocity will be worth the fractional decrease in mass. “In a real swing the bat is rotating,” Pelletier told me on Bluesky. “Near your hands it moves slowly and at the head it moves fast, there’s this bat speed gradient. The actual max EVs hitters get come above the point of maximum collision efficiency (which we could call the sweet spot) because the bat moves faster up there.” Every bat has a sweet spot, and every batter’s goal should be to just barely miss it.
As it turns out, every batter has their own sweet spot too. I spoke to Andrew Aydt, Driveline Baseball’s assistant director of hitting, to talk about how torpedo bats could be customized. “When I first saw the torpedo bat come out or gain popularity,” he said, “that’s where my mind went with it too, because of Hawk-Eye being in all MLB stadiums now. Teams have very detailed measurements now from bat tracking and tracking the ball. They know exactly where guys are contacting the ball consistently. So I think this is actually a pretty big advantage for teams that have a good R&D department. They can suggest [based on the] overall average [location of contact] where they should beef up the barrel, or adjust the barrel down some or up some.”
Anthony Volpe, who tends to make contact closer to the bat’s label, had his sweet spot moved in that direction, said YES Network broadcaster Michael Kay during the second inning of Saturday’s game. While this should allow Volpe to increase his exit velocity by ensuring that his contact comes closer to the sweet spot, that location also means that his sweet spot will be moving slightly slower because it’s closer to the knob. Then again, the adjustment to the balance of the bat – lowering the moment of inertia, in physics terms – should allow him to swing the bat harder and to have better bat control, offsetting that loss. Pelletier, who has already run some numbers on the potential gains in exit velocity, explained, “The torpedo bat moves the sweet spot down, meaning that it moves somewhere that’s necessarily moving slower. So, even if you make slight gains on max collision efficiency your max EVs decrease as well.” Physics: Sometimes it’s complicated.
For players whose contact tends to come closer to the head of the bat anyway, the news is even more exciting. Adjusting the sweet spot in that direction would allow them both to make more contact at an optimal spot and to increase the bat speed at that spot (though it would also make the bat effectively heavier and worsen bat control some).
On Sunday, Tango posted the scatter plot below. It shows the contact tendencies of every player in baseball, limiting the sample to swings on which the hitter was on time and on target. He split them up into two categories: Those who get tied up (that is, make contact closer to the label) and those who flail (make contact closer to the head). As you might notice, Volpe is not where we’d expect him to be. He’s actually slightly on the flailing side of things. If anything, based on these particular data, his sweet spot should be pushed further toward the head of the bat. However, that doesn’t necessarily mean he’s swinging the wrong torpedo bat. Additional data could’ve been used during Volpe’s bat fitting that supported sliding his barrel toward the label. “I don’t know that necessarily everyone knows about it,” said Yankees manager Aaron Boone in response to a question about whether league-wide offense would increase as more teams adopted torpedo bats. When asked to elaborate, Boone said: “I think there’s just a lot more that goes into it… a lot went into doing that for our individual guys.” Tango highlighted Jhonkensy Noel as a proud member of Team Tied Up who would benefit from moving his sweet spot closer to the handle.
The odd shape is the grabby part of the torpedo bat, but the fanfare of the last week could have a bigger effect, turbocharging the trend toward hyper-customized bats. “The bat is such a unique tool,” Ryan Jeffers told Passan. “You look at the history of the game, and they used to swing telephone poles. Now you try to optimize it, and it feels like some branches are starting to fall for us on the hitting side of things.” Batters have always tinkered, and plenty of trends have swept through the league before. In the early 2000s it was maple bats, and in recent years we’ve seen trends like axe handle bats and hockey puck knobs. Customization has increased steadily. Orioles hitting coach Cody Asche told The Baltimore Banner’s Andy Kostka, “I think if you’re around clubhouses, all 30 teams, you would see a guy or two who’s adopting a bat that is fashioned maybe more specifically for their swing.”
Aydt told me that Driveline started doing bat fittings around four or five years ago. “How much is there to change the bat, or individualize bats to help a player’s performance?” he explained, focusing on the moment of inertia again. “How fast they’re swinging the bat, how hard they’re hitting the ball, consistency. Basically, their collision efficiency (or what we call smash factor), how we can improve that for guys more often, any improvements ball-flight-wise… Since we don’t manufacture bats, it was more finding a good MOI for the guy that we think would help them perform the best. And then recommending bats if they wanted or taking that to their bat manufacturer.” In the last year or two, Driveline has focused less on bat fitting, because bat manufacturers have started doing their own fittings. Aydt mentioned that Marucci has a baseball performance lab for that very purpose. When he saw the torpedo bats take the league by storm, his mind leapt to even more advanced frontiers.
In the coming year or two, we’ll be seeing more torpedo bats specifically, and more bats that are customized to an individual player generally. But they could also be tailored for a specific situation. “I think they could even get more granular than that, having a range of bats made for guys,” Aydt said. “And then depending on that night’s starter or the matchup they’re going to see, they could decide which bat to go with… based off the pitch types they’re seeing, if the hitter misses more at a certain part of the bat based off different pitches or what they’re most likely to see that night. Or if guy has attacked more inside, attacked more outside consistently against that hitter… If they’re going to be facing a ton of velo that night and they’re a guy who doesn’t consistently hit velo well, it could be a good thing to lower that MOI. So that would be moving more of the mass closer to the hands, which is essentially lowering the swing weight. So it’s easier for them to get up to speed quicker, improving the acceleration of the bat to help them catch up to velo.”
Maybe you’re like Rafael Devers and starting the season with a disastrous run of strikeouts because you’re behind on absolutely everything. You’d be a good candidate for a Volpe bat with a lower MOI, helping you get around quicker. Maybe you’re facing a pitcher who loves to attack the outside corner. It might make sense to try a bat with a higher MOI and more mass toward the head. Aydt even raised the possibility of having a two-strike bat. When you fall behind, the bat boy runs out to hand you a bat with a lower MOI so that you can prioritize quickness and barrel control over power.
Eric Hartline-Imagn Images
It’s also possible the torpedo bats will be banned, as one front office source predicted to R.J. Anderson of CBS Sports. If we do see ball boys running out to trade bats every time a hitter falls behind in the count, the league might feel it has to act. It certainly wouldn’t take a particularly dramatic rule change. The rules would just need to specify that no part of the bat may have a diameter bigger than the diameter at a point, say, one inch from the end. It might not even push the bat section of the rulebook past a page.
As with any innovation, buy-in will be a big limiting factor. There will always be old-school baseball men eager to object on principle to any innovation. “When I got jammed, I figured out what I had to do to stop that,” said Angels manager Ron Washington, who ran a lifetime 77 wRC+. “So I didn’t worry about putting more weight in a certain area of the bat.” Current players are much more open to new ideas and technology. Some will be comfortable trying something new, or even following Aydt’s idea and tailoring their bat to the situation at hand. Others will value comfort and consistency. “It is the talk of the game right now,” said Aydt, “but it’s not going to be good for every single hitter.” Said Leanhardt, “Credit to any of the players who were willing to listen to me, because it’s crazy. Listening to me describe it is sometimes even crazier.”
According to The Athletic’s Sam Blum, the Yankees developed torpedo bats in 2022, while the Cubs started working with them last season. Brandon Lockridge was a minor leaguer in the Yankees system at the time and now serves as the small spoon in San Diego’s left field platoon. Lockridge told Blum that when Leanhardt was originally pushing players to try the bats, his pitch wasn’t about exit velocity, but rather about using the bigger barrel to turn some whiffs into foul tips. It’s possible that over the course of 600 plate appearances and 1,000 swings, an extra fraction of an inch could save a player from a third strike or two. However, it’s hard to imagine that this selling point was sexy enough to convince players to try something that looks so different from what they’re used to. Hitters depend on feel. If they’re not comfortable with a bat, no amount of evidence will persuade them to use it.
That’s where the name comes in. You have to imagine it’s more about marketing than anything else. As anyone who’s watched The Hunt For Red October a couple dozen times can tell you, torpedo bats actually look less like torpedoes than traditional bats do, because most torpedoes taper only ever so slightly at the end. What torpedo bats actually resemble is old-timey bombs or pregnant whales.
(Editor’s note: We consulted FanGraphs writer Michael Baumann, who’s seen The Hunt for Red October a couple hundred times, about the torpedo shape issue. His response was very involved and to be honest we started zoning out when he used the word “supercavitating.”)
But as anyone who’s worked for a major league team will tell you, all the evidence in the world won’t help an idea if you can’t sell it to the players and coaches. So while the torpedo bats may have exploded into the public’s consciousness this past weekend, their place in the game owes itself in some degree to Leanhardt’s salesmanship and the open-mindedness of the Yankees, not to mention the bat manufacturers who had to learn how to make them. None of us was there, but I will leave you with a dramatization of Leanhardt’s efforts to get these bats into the hands of the Yankees. I present to you a play in three acts.
ACT ONE
PHYSICIST: Pardon me, young baseball man. Would you be interested in experimenting with our new bowling pin bats? My calculations say that they might help you get more foul tips. [Receives wedgie.]
ACT TWO
PHYSICIST: Hello there, fellow Yankee. Might I be able to persuade you to take a couple whacks with our new juggling club bats? They ever so slightly alter the moment of intertia, and preliminary results indicate that this alteration just might result in an increase in — you know what, I’ll just shove myself into this locker.
ACT THREE
PHYSICIST: Sup, bro. Wanna try this sick-ass torpedo bat? Scientifically proven to make the ball [lowers sunglasses] explode.
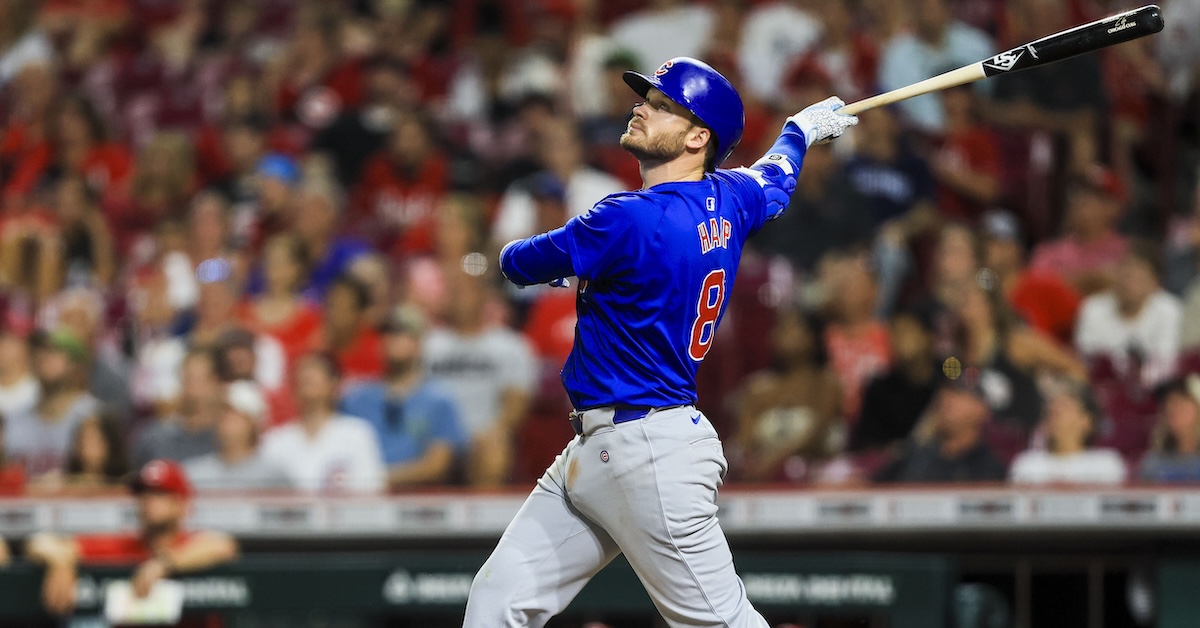
Kyle Tucker’s final year before hitting free agency is shaping up to be a big one. Traded from the Astros to the Cubs in a blockbuster deal last December, the 28-year-old right fielder has yet to play a regular season game with his new team at Wrigley Field, yet he’s settling into his new surroundings in impressive fashion. At this writing, he’s riding a streak of homering in four consecutive games, one that has helped him to a prominent spot on the leaderboards.
Tucker went hitless in his debut for the Cubs during the Tokyo Series against the Dodgers on March 18, though in his second game, he drove in a run with a bases-loaded walk against Roki Sasaki, then added a ninth-inning double. Still, he was just 2-for-16 through the season’s first four games before going to town on the Diamondbacks’ Brandon Pfaadt on Saturday, collecting a single, a double, and a two-run homer against the freshly-extended righty in a 4-3 win. He followed that up with a three-run homer off Arizona’s Joe Mantiply in a losing cause on Sunday, then on Monday went 4-for-7 in an 18-3 rout of the A’s in their Sacramento debut, with doubles off Joey Estes and Noah Murdock, a homer off Jhonny Pereda (the team’s backup catcher), and three RBI. Read the rest of this entry »
First of all, Lance Lynn’s wife has a podcast. It’s called Dymin in the Rough. Good for Lance, falling in love with someone who appreciates a pun in the headline. (I, personally, would’ve gone with Shine On You Crazy Dymin, but they didn’t ask me.)
Second, I’m going to have to come up with a new answer to the question: “Who’s your favorite active ballplayer?” Because as of Tuesday morning, our guy is retired.
“Baseball season is upon us and I’m right here on the couch,” Lynn said. “And that is where I’m going to stay. So there’s the update: I’m officially retiring from baseball, right here, right now.” Read the rest of this entry »
Ian Happ’s defensive future was unclear when the Chicago Cubs made him a first-round pick in the 2015 draft. The sweet-swinging switch-hitter was selected as an outfielder, but he’d also played multiple infield positions during his three years at the University of Cincinnati. That uncertainty — fueled more by versatility than any serious shortcomings with the glove — remained when he was rated the Cubs’ no. 2 prospect in January 2017. While Eric Longenhagen opined that Happ’s most expedient path to the big leagues was as a left fielder, he nonetheless had him on our list as a second baseman. Either way, Happ’s calling card was going to be his bat. As our lead prospect analyst stated, “It profiles wherever he ends up playing.”
What did Happ’s 2017 scouting report look like? Moreover, what does he think of it all these years later? Wanting to find out, I shared some of what Eric wrote and asked Happ to respond to it.
———
“The Cubs drafted him ninth overall in a draft chock full of good college hitters up top despite questions about his ultimate defensive home.”
“There definitely were questions about my defensive home,” Happ said. “I’ve played seven positions in the big leagues, so while I ended up finding a home [in left field], I think it was an asset for me to be able to play a bunch of different spots — especially on those early teams with how many good players we had.
“We needed versatility in that group. We had Addison [Russell] playing shortstop. We had Javy [Báez], [Ben] Zobrist, Tommy La Stella, and myself at second. Kris Bryant was at third and [Anthony] Rizzo at first. In the outfield, we had [Kyle] Schwarber, [Albert] Almora, Jason Heyward, Jon Jay, Zobrist, and myself. We didn’t have a bunch of set positions, so to get in the lineup you had to hit, and you had to be versatile. That’s the way Joe Maddon ran teams over there. Had I been a one-position guy, I don’t know how much I would have played in the big leagues.”
“He’s an above-average straight-line runner with decent range and an above-average arm, but his actions and athleticism are not optimal for the infield.”Read the rest of this entry »
Back in December, the Red Sox acquired pitcher Garrett Crochet with the intention of signing him to a long-term contract, and that’s just what they did on Monday, extending the big lefty on a six-year, $170 million deal that kicks off starting in 2026. There’s no deferred money in this deal, nor is there a no-trade clause, though there is a $2 million bonus in the event that he is traded. There is also the typical incentive clause (up to $10 million) for Cy Young Award finishes and an opt-out after 2030. In an extra bit of injury protection, the Red Sox get a $15 million team option and the opt-out disappears if Crochet misses 120 consecutive days to a significant arm injury. Crochet was the main reason to watch about 20% of White Sox games in 2024, as he threw 146 innings over 32 starts, put up a 3.58 ERA, a 2.85 FIP, and 4.7 WAR, and earned his first All-Star selection. He then changed his Sox over the winter in that trade from Chicago to Boston.
I talked a little about this a few weeks ago, when I discussed what I’d do as a brutal despot of MLB. What I demanded — without, as I remind you, any legal authority to do so — was that the Red Sox close the deal with Crochet. The extension was, in my view, one of the most obvious things that should happen in baseball right now. The Red Sox appear to be on the verge of a return to contention, supported by a very good farm system, and they really needed a high-end pitcher for the top of the rotation. Before the extension, Crochet was set to hit free agency after next season, and keeping him around long term was essential for both baseball and public relations reasons; an ace pitcher was unlikely to come cheaper for the 2027 season, and his departure might have opened up old Mookie Betts-related fan wounds that have healed to an extent.
Suffice it to say, ZiPS likes him quite a bit. I discussed the projections for Crochet in the aforementioned article.
After also taking into account his $4.5 million salary for 2025 and the fact that he’s still arbitration eligible for 2026, ZiPS suggests offering Crochet a seven-year, $175 million contract starting this season. That doesn’t need to be Boston’s final offer, but it is a solid framework for what an extension could and should look like. Yes, there are risks, but the Red Sox shouldn’t sit at the high rollers table if they’re not willing to push in their chips.
That projected deal was a bit lighter than his actual six-year, $170 million contract, with the main difference being that I had it going into effect this year, when he’s scheduled to get paid $4.5 million. Projections aren’t static things, however, and Crochet is coming off a dynamite spring in which he struck out 30 batters in 15 2/3 innings and allowed just a single run. He also had a decent, though not amazing, Opening Day start against the Texas Rangers. Spring training and one regular-season start aren’t enough to drastically change most projections, especially for established players, but they do nudge them in one direction or the other. Let’s stuff some stats onto the ZiPS griddle and flip off some projection flapjacks.
ZiPS Projection – Garrett Crochet
Year
W
L
ERA
FIP
G
GS
IP
H
ER
HR
BB
SO
ERA+
WAR
$
STATUS
2026
12
5
2.88
2.68
29
29
137.3
117
44
11
43
172
145
3.6
$18.1M
ARB3
2027
12
5
3.01
2.78
29
29
140.7
123
47
11
43
172
139
3.5
$32.8M
FA
2028
12
6
3.14
2.88
30
30
140.7
127
49
12
42
167
134
3.4
$32.4M
FA
2029
11
7
3.21
2.98
30
30
140.0
129
50
12
41
161
130
3.2
$31.8M
FA
2030
11
6
3.36
3.08
29
29
136.7
128
51
12
40
153
125
3.0
$30.3M
FA
2031
11
7
3.42
3.14
30
30
139.7
133
53
13
42
154
123
3.0
$31.3M
FA
With a projected $18.1 million salary in 2026, which would’ve been Crochet’s final season before free agency, ZiPS would offer him a six-year, $176.6 million extension (though in both the previous and current projections, I think ZiPS is being too optimistic on his final arbitration year salary given how large a jump it is). The opt-out clause in Crochet’s new contract isn’t a major one in that it only allows him to exit a year early, so it doesn’t have the same dramatic effect as one after 2026 or 2027 would have.
You could say that this is a lot of money for a pitcher with 224 career innings in the majors, an injury history, and a résumé that was more speculation than results at this time last year. You’d be right that it’s a lot of money, but the projections already factor in these risks. Crochet, with a lengthy track record and a spotless injury history almost certainly would’ve received a larger sum of cash. I actually accounted for this by telling ZiPS to assume that Crochet throws 200 innings in 2025, and to insert pre-injury projections of him as a starter in 2022 and 2023. With that lengthier and more durable track record, ZiPS would project him to get a six-year, $270 million contract! You can look at this actual extension as the Red Sox saving about $100 million for the risks they’re assuming, on top of the injury protection clause in the contract.
Anyway, back to non-imagination Crochet. You should ignore the games started total in the projections, as ZiPS is a little befuddled on his exact usage because of his very unusual workload pattern. More than half his 2024 starts lasted fewer than five innings, as the White Sox were (rightly) extremely careful with him as he was coming off Tommy John surgery and being converted to a starter. The innings totals, though, are far more solid, and this projection is generated based on Crochet never having better than coin-flip odds to qualify for the ERA title. ZiPS projects Crochet to be the fifth-most valuable pitcher in baseball through the 2031 season, behind Tarik Skubal, Logan Webb, Paul Skenes, and Corbin Burnes, and just ahead of Yoshinobu Yamamoto, Logan Gilbert, George Kirby, and Hunter Greene. Who among those names would you likely get for merely $170 million if they were free agents soon?
Crochet clearly wanted this deal, making public statements last year to the effect that he was seeking a long-term contract no matter where he ended up. The Red Sox clearly wanted this deal; while they have better prospects, I doubt they would have traded Kyle Teel, Braden Montgomery, and Chase Meidroth if they had zero expectation of extending Crochet. And Red Sox fans ought to have wanted this deal. Crochet is a true no. 1 starter who, in just six years, is projected to become the fifth-most valuable lefty in Red Sox history. The last day of March 2025 was a good day for the Boston Red Sox.
As you might expect from a team that set a record for futility with 121 losses last year, then traded its ace over the winter, the White Sox did not enter this season with a powerhouse rotation. In fact, according to our Positional Power Rankings, Chicago is projected to have the second-worst starting pitching in the majors, ahead of only the A’s. Yet that rotation has already earned a spot in the history books, as the South Side starters have yet to allow an earned run through the season’s first four games.
Admittedly, the word earned is a load-bearing one in that last sentence. But in becoming just the fifth team to pull off this feat in the 113 years since earned runs became an official statistic, Chicago’s unlikely accomplishment is worth noting, a fluky and probably fleeting performance that has at least earned its run in Small Sample Theater, particularly given the circumstances surrounding it. I’ll get to those, but first let’s meet the company the Sox are keeping:
Rotations That Didn’t Allow an Earned Run Through the Team’s First Four Games
Team
Season
IP
H
UER
BB
SO
Red Sox
1914
35.0
21
5
7
20
Brewers
1976
29.2
14
0
7
11
Giants
2013
26.0
12
2
11
22
Blue Jays
2019
24.0
9
0
9
28
White Sox
2025
23.0
11
2
8
19
SOURCE: Baseball-Reference
That’s not a particularly heralded bunch of teams, at least outside of the 1914 Red Sox, who went 91-62 and finished in second the American League. Their season-opening rotation included Dutch Leonard, who still holds the AL record with a 0.96 ERA; in July, they added a 19-year-old lefty named Babe Ruth. The other three predecessors finished below .500, and not by a little; the Giants went 76-86 between championship seasons, the Brewers 66-95, and the Blue Jays 67-95. Even so, they all caught lightning in a bottle during the season’s first week, as have the White Sox, who are 2-2. Last year, they didn’t notch their second win until their 11th game. Read the rest of this entry »
One weekend into the 2025 regular season, baseball is already throwing up some pretty big surprises. Here’s one: The Atlanta Braves have the worst record in baseball. The Braves! The perennial best non-Dodger team in the National League, with their Toyota pickup-level dependable lineup and fountain of talented young arms, went 0-4 against the Padres.
Then, on Monday afternoon, more bad news dropped: Jurickson Profar has been suspended 80 games for violating MLB’s policy on performance enhancing drugs. Minutes after Profar’s suspension came out, Reynaldo López was placed on the IL with right shoulder inflammation. All this comes amidst Brian Snitker, the club’s beloved and highly successful manager, hinting that he might hang up his lineup card at the end of the year. And to top off this day of crap, Grant Holmes got knocked around in the series opener against the Dodgers and Atlanta dropped to 0-5.
Fortunately, MLB Shop is already selling jerseys to commemorate the occasion:
As a general principle, I scoff at the idea that a bad weekend can be characterized as a crisis at any point before Labor Day. In case you disagree, consider that the team that ended the weekend atop the NL East was not the Phillies or Mets but the Marlins. Here’s a good rule of thumb: If the Marlins are in first place, it’s too early to panic. Even after the beatings continued against Dodgers, morale should not be bottoming out this early. Read the rest of this entry »
I have a hot baseball take. The most dominant performer I’ve seen in real life isn’t Shohei Ohtani, or Aaron Judge, or Barry Bonds. It’s Jacob deGrom, and specifically the form that deGrom showed starting in 2019. He mostly threw fastballs and sliders. He only attacked one side of the plate. It sounds like a bad approach, one that a thoughtful hitter could easily exploit. Yet it was absolutely, completely unhittable.
Why? First, deGrom’s fastball is a unicorn. His combination of release point, shape, velocity, and command means that batters are trying to hit flat and even seemingly rising pitches on the edges of the plate. By releasing so low and yet generating so much backspin, he’s defying expectations. By throwing it so hard, he’s giving batters less time to react. By spotting it on the edge of the plate, he’s giving them no good options even if they swing; it’s hard to do damage on pitches that avoid the center of the plate.
From 2020 to 2022, the velocity part of this equation kicked into overdrive. In each of those years, deGrom averaged 98.7 mph or faster with his fastball. But it turns out it still looks pretty good at 97:
Bowden Francis was one of baseball’s best pitchers over the final two months of the 2024 season. From August onward, the 28-year-old Toronto Blue Jays righty made nine starts and posted a 1.53 ERA with 56 strikeouts while allowing just 24 hits and seven walks across 59 innings.
All told, Francis recorded a 3.30 ERA, a 22.5% strikeout rate, and a 5.4% walk rate last season across his 27 appearances (13 starts) spanning 103 2/3 innings. It stands to reason that the minuscule .211 BABIP he allowed isn’t repeatable, though it may not be due for as much of a regression as you might expect. Inducing weak contact is Francis’ modus operandi on the mound, and a low BABIP is a feature of his game, not a fluke.
Considering the priority for pitchers to generate as many swings and misses as possible, when I spoke with Francis during spring training, I wanted to understand his approach to pitching. Specifically, I asked him, “How do you get guys out?”
“Pounding the strike zone,” said Francis, who was selected out of Chipola Junior College in the sixth round of the 2017 draft. “Strike percentage, getting guys on their heels more. Mixing it up and moving it around, trying to keep them off balance. Pitchability is my thing. I’ve never been super-overpowering. I’ve always been more on the crafty side.” Read the rest of this entry »