A lot of my job involves spinning a story I don’t completely believe in. I know, I know, you’re shocked! You mean I don’t actually think that the four to five players I highlight every week are each breaking out by doing something they’ve never done before? And I don’t think that each of them is doing it sustainably? What are the odds?
Some of that comes with the territory. If you’re looking across the universe of major league players for something interesting, some portion of what you find interesting will have happened by random chance. That pitcher who’s striking everyone and their mother out? He might just be on a hot streak. The hitter who’s currently smashing high fastballs? There’s some chance he just felt really good for a week and then will stub his toe when walking out of the clubhouse tomorrow.
I know all that. One thing I wasn’t sure about, though, was how often false signals pop up. Even without searching them out, you might end up seeing a breakout around every corner. There’s a famous quote from Nobel Prize winning economist Paul Samuelson: “The stock market has predicted nine out of the last five recessions.” Is the same general idea true of batted ball data? I came up with a simple experiment to investigate. What follows is a breakdown of the exact method I used, but if you’re just interested in the conclusion, it won’t surprise you: When hitters put up hot streaks of a reasonable length, it’s a good but not infallible sign that they will finish the year as above-average hitters.
I took every batted ball from the 2022 season and broke it out by player. From there, I put them all in chronological order and calculated each player’s best stretch of 50 batted balls. I calculated it for a variety of “advanced” metrics: average exit velocity, xwOBA, and barrels per batted ball. Those are some of the most commonly used underlying statistics – if I’m citing someone who’s really hitting, I’d likely use batted ball outputs like this to assess the validity of their performance, so I excluded things like batting average on contact or wOBA on contact, which might be quite noisy in 50-ball samples. Read the rest of this entry »
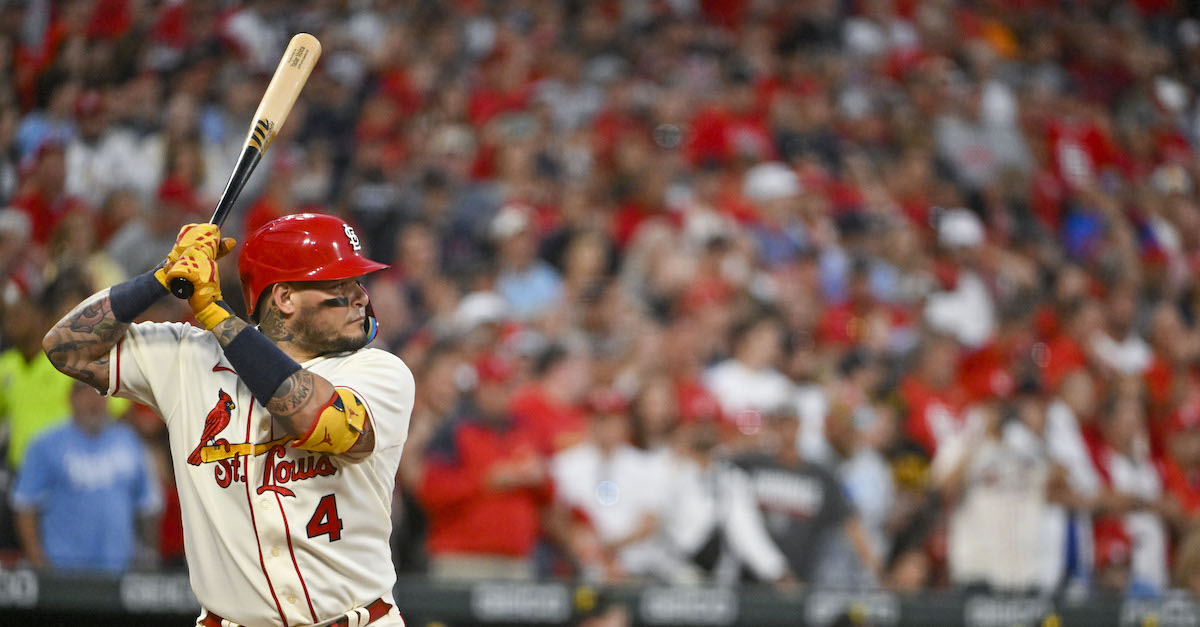
Paul Goldschmidt’s 2022 was a year for the ages, literally: the Cardinals’ first baseman defied senescence to post a 7.1 WAR and 177 wRC+, numbers which respectively tied for the 25th-best season among hitters 34 and older and the 15th-highest among those same elders with at least 500 plate appearances since 1920. This year, the slugger has largely picked up where he left off, with a 164 wRC+ through his first 186 trips to the plate. And according to xwOBA, he’s been significantly better than last year.
In case you’re not familiar, Weighted On-Base Average (wOBA) evaluates overall offensive performance in one stat, using linear weights to measure the relative value of each offensive outcome and then putting that number on the same scale as OBP. xwOBA, a product of Baseball Savant, combines a hitter’s walk and strikeout numbers with a prediction for how they should have faired on balls in play based on launch angle and exit velocity.
Last year, Goldschmidt put up a career-best wRC+, but xwOBA was telling us that some of that was smoke and mirrors: his .367 mark was well shy of his actual wOBA of .419. That 52-point divergence was the fifth-highest overperformance among hitters with at least 500 plate appearances in a single season since the introduction of xwOBA in 2015. Entering his age-35 season and due for some regression, I dismissed the idea of another big year from the first baseman. Read the rest of this entry »
We all know about the shift ban. This year, nary a shortstop can be found on the right side of the infield, nor a second baseman on the left. (Except, of course, for Mookie Betts.) Why, then, are we still denoting so many balls in play as occurring during “traditional shifts” on our splits leaderboards?
For those of you who don’t know, we have a great glossary section on this site. It’s what I used as a budding baseball nerd to understand what the heck Jeff Sullivan was saying about James Paxton back in 2016. In this case, I’ll point you to the section on our shift data. A traditional shift, brought to us by the folks over at Sports Info Solutions, does include the typical Ted Williams variety; that is, three infielders playing on the hitter’s pull side, a tactic used in the hopes of thwarting the great Red Sox outfielder’s offensive prowess (to little avail). Traditional shifts also include those where one infielder — usually the second baseman — is playing at least 10 feet into the outfield. These two flavors of shift are both obsolete now.
But the “partial” Ted Williams shift is having its heyday. When a shortstop (for a lefty) or a second baseman (for a righty) is “shaded” up the middle, with the corner infielder moving over towards the vacated spot halfway between the bases, that’s a partial Ted. Now, without the option to use a full Ted, teams are largely employing its partial cousin in its stead. Excluding non-traditional shifts (situational shifts — such as corners in, double-play depth, etc.), the ratio of shifts to no shifts on balls in play last year was just over 1.5 to 1. This year, it’s only dropped to just under 1.4 to 1. Hardly what you’d expect from a shift “ban.” Read the rest of this entry »
What makes you happy? Among the things that bring a smile to my face, talking about catching is up there. I will look for any excuse to write, talk, or think about catcher defense. I’m one of those people that has missed catching bullpens since I’ve stopped playing regularly. For those of you who do not know, that is not normal! So whenever Statcast drops new information about catcher defense, I have to write about it.
A few weeks back, I covered some catchers who were throwing at a rate that suggested additional defensive value relative to their peers in the new, more aggressive stolen base environment. Soon thereafter, MLB.com’s Mike Petriello revealed a new stat, Caught Stealing Above Average, to the public, and that Baseball Savant would roll out a leaderboard that would offer a more objective look at throwing out runners relative to the traditional caught stealing stat. You can check out the full leaderboard here.
There are multiple components taken into consideration for Statcast’s model that try to even the playing field when it comes to throwing out runners — variables like pitcher delivery speed, a runner’s lead and jump, and more. Evening all of those out provides more insight on how some catchers are more deserving of outs than others. Typically, I would highlight the catchers who have excelled at throwing out runners, but to emphasize the value of this statistic, I instead want to look at those who have been unlucky this year and last despite consistent strong throws, as well as other catchers where the trends are concerning. The first of this group is expected but notable nonetheless:
J.T. Realmuto (1 Catcher Caught Stealing Above Average in 2023, no. 7)
Base stealers have been running like wild against the Phillies this season, and it’s made for some confusing statistics for J.T. Realmuto. Out of his first 17 stolen base attempts of second base, he’s only caught five runners. If you remember this piece back in November, you know Realmuto has one of the strongest arms and fastest pop times in the game; if anybody should be throwing out most runners, it’d be him. But this year, he is only running a 29% caught-stealing rate, partially due to plays like the one above, where his pitcher was just slightly too slow to home. He has still been better than his expected rate of 22%, but his bar is much higher than any catcher in the league.
Realmuto’s 2022 track record is even more impressive than this year’s. If you combine all of last season’s attempts with this year, his CS% sits at 48%, with an estimated CS% of 23%. His laser-quick pop time makes up for his slower-to-the-plate pitchers. Realmuto is elite at throwing, framing, and blocking; nobody else can make that claim to this extent. We are watching one of the best defensive catchers of his generation.
Shea Langeliers (2 Catcher Caught Stealing Above Average in 2023, no. 5)
Not many things are going right for the A’s, but Shea Langeliers has impressed on both sides of the ball. With a 109 wRC+ fueled by a .244 ISO, he is off to a solid start with the bat, and both his swing and power are promising. On the defensive side of the ball, he has averaged a 1.95 pop time but has been a little unlucky with throwing out runners, with a CS% in his first 19 attempts to second base of 32% but an estimated mark of 24% — a similar discrepancy as Realmuto. On this throw, he was as perfect as you can be, but his pitcher was dragging his feet to get the ball home, and Tony Kemp lost his glove on the tag anyways.
While the pop time isn’t elite on average, Langeliers has proven that he is accurate enough to throw runners out if given the opportunity. It’s one of those situations where he isn’t necessarily a top tier thrower and therefore doesn’t have much room for error if his pitchers don’t cut him some slack or if his throw is just slightly off line. To me, Langeliers is the type of catcher who offers a glimpse into the future. With some automated ball-strike system inevitably coming to MLB, his profile is one that would perfectly transition to that new reality, as he is only average at blocking and framing but is slightly above average at throwing. Combine that with above-league-average offense, and you have yourself a perfect prototype for the potential new catching environment.
Martín Maldonado (2 Catcher Caught Stealing Above Average in 2023, no. 4)
If it weren’t for Realmuto, Martín Maldonado would find himself atop the new throwing leaderboard from 2022 through today, with seven CS Above Average. This year is no different, as he holds a 33% CS% despite a mere 14% estimated rate. The pitchers in Houston aren’t helping him, but he is nabbing runners regardless. Case in point: the play above, where Cristian Javier’s big leg kick and loopy arm took up too much time, undermining Maldonado’s pinpoint throw. But even when he isn’t catching runners, he is making it close.
Over the past few years, I’ve gone back and forth on the Astros’ decision to use Maldonado as their primary catcher. He is an incredible fielder but is consistently one of the worst hitters in the game. As his framing skills have undergone a slight regression compared to earlier in his career, it’s statistically unclear if it’s worth keeping him as the mainstay. But the additional data on Maldonado’s elite throwing and blocking in the last few months reminds us why he’s the lead catcher in Houston. Combine that with his glorified intangibles, and you can easily understand why he has cemented himself as the starter despite the lack of offense.
This new information can work in the other direction, too. Sometimes catchers are unlucky because their pitchers put them in a hole, and other times they can be even worse than expected. Unfortunately, there are some promising young catchers who fall into the latter category. Keibert Ruiz is 2-for-17 (12%) to start the year despite a 23% estimated CS%. His plus-2.00 pop time is the main reason for this. If his framing continues to trend in the wrong direction along with his arm, he will need to be an above-average hitter to live up to his prospect pedigree. Francisco Álvarez faces a similar dilemma, going 0-for-12 to start the year. His estimated CS% was only 12%, but his throws have not been competitive regardless.
For a while, catching was a semi-mystery; we knew who had rocket arms and who didn’t. Now, we have information about framing, blocking, and throwing that helps us figure out the true value of a gifted defensive catcher. It’s an exciting time to be a catching fanatic.
Though it feels like Opening Day was just yesterday, we’re officially a month into the 2023 regular season. On the macro level, that means the disappointing and surprising players are already starting to come out of the woodwork. More specifically (and importantly for writers like me), we’re at the point in the season when hitters are routinely cracking the century mark in plate appearances and pitchers are notching 35 innings.
Yet in some ways, this juncture is almost more maddening than Opening Day; we’re still in small-sample-size territory, but enough baseball has been played that we’re tantalizingly close to being able to take a hard look at some of the narratives being spun. For the time being, though, it still makes more sense to look at changes in approach rather than surface-level stats to predict rest-of-season production.
So I returned to a project I started this offseason — analyzing pitcher arm slots — to examine some hurlers who’ve made discernible tweaks to their release in accordance with early shifts in their performance. The equations I used to calculate these numbers can be found here. Read the rest of this entry »
Maybe it’s because of the right-hander’s lack of a pedigree, or his status as a non-roster invitee during spring training. After all, Hamilton is a 27-year-old reliever who struggled through injuries and ineffectiveness over the past four years. At the same time, he looked like a find as recently as 2018, when he pitched to a 1.74 ERA and 2.44 FIP across 51.2 innings between Double- and Triple-A; he even averaged 96.7 mph on his heater in a brief eight-inning callup. The next season, he seemed poised to play an integral part in the White Sox bullpen, but he was struck by a foul ball while rehabbing separate shoulder and head issues stemming from a car accident. His poor luck nearly brought his career to an end, but he finally began to feel back to normal this offseason.
If you didn’t know about Hamilton before, I’ll be the first to tell you that he has been a joy to watch this season, not only because of his unique offering but also his comeback story, parlaying his rediscovered health into a spot in the Yankees’ pen, where he’s found early-season success with a resurgent fastball (averaging 95.4) and the slambio. The latter pitch has been nothing short of excellent thus far: a ludicrous 29.9% swinging-strike rate and worth 3.8 runs, which rank third and tied for fourth, respectively, among the 85 sliders thrown at least 50 times this year (as of Saturday night). The pitch’s unusually high rate of called strikes, 15.6%, given its whiffiness, also places it second among the 85 sliders in CSW%. Read the rest of this entry »
After a decade of hand-wringing and tedious arguments on both sides, MLB restricted defensive shifts this past offseason. Much has already been written about the pros and cons of this decision, and I’m not going to take the time to recapitulate all of those arguments here. One debate in particular really caught my eye, though: Would teams still play an overshift-esque alignment by moving an outfielder to the shallow right field position occupied by shifted second basemen in pre-restriction shifts?
I expected it to be a rare tactic, but still one that came up from time to time. Five-man infields already existed; in fact, I ran the math on when they might make sense in 2019 when the Dodgers tried one. The exact conclusion of that piece isn’t important; the point is that teams sometimes thought a five-man infield was the best defensive alignment when any defense was allowed, so they would surely prefer it with restrictions on other alignments in place. Read the rest of this entry »
You probably don’t think of baseball as a contact sport, though catchers might beg to differ. Whether it’s blocking a baseball or taking a foul ball to the mask, catchers are constantly at war with a five-ounce ball of leather. That’s why catchers have to commit to blocking through and through. You can’t cheat your way to being a good blocker; you have to learn your pitchers to understand what pitches they tend to spike and how those pitches spin off a bounce. The stakes will always depend on the situation, but as a catcher, you try to gain the confidence in your pitcher to throw a pitch in the dirt by committing to the grind in the bullpen, during warmup pitches, and in game.
I’ve been anticipating Statcast adding blocking metrics for a while now. As a former college catcher, it doesn’t take much to make me appreciate the league’s great blockers, but our culture in baseball gives more attention and value to the things we can measure. With the introduction of the new blocking leaderboard, we no longer need to guess at just how impactful or skilled some catchers are relative to their peers.
In a similar fashion to how I reviewed Statcast’s arm strength leaderboards, I am going to highlight some of the best blocking catchers in the game. The criteria for this exercise is straightforward: I took the catchers ranked first through fifth on the default leaderboard and chose what I deemed to be an impressive pair of blocks from each from the 2022 season. The mechanics of blocking can vary from player to player, but what matters most is killing the speed of the bounce with the lower half of your chest protector. These five catchers can do that on a variety of pitches going in any direction.
I’ll start with this: the debate between catching with one knee down versus in a traditional stance has no absolute answer; it’s entirely dependent on the individual catcher. In the case of Adley Rutschman, he is capable of being both a top-tier framer and blocker primarily in the traditional stance. But the combination of his mobility, flexibility, and hip anatomy allows him to shift his knees down from his traditional stance without needing to get into a pronounced traditional squat.
On this 90-mph splitter from Félix Bautista, Rutschman anticipated the pitch in the dirt and blocked up with what looked like an effortless movement. Bautista is without question one of the most difficult pitchers in the game to catch: triple digits from a straight over-the-top arm slot high off the ground, paired with a blistering splitter that hitters swing through over half the time. Because of that, Rutschman must always be ready to get his knees on the ground and stuff the splitter, especially when runners are on. He put on a clinic all year, and this pitch was no exception.
The second block was just as impressive. On a 92-mph changeup, Rutschman read the arm-side spin and opened up his left hip to create space for a side shuffle to get in front of the baseball. Blocking pitches over 90 mph is a doozy, but it’s all in day’s work for one of the best in the game.
Jose Trevino (no. 2 overall, 15 Blocks Above Average)
Every time I watch Jose Trevino catch, it’s clear to me that he is a former infielder. The way he can shift and rotate his hips while in such a deep position is truly impressive. He is one of the catchers who can have one knee down and be even better at blocking. Since he has such a great feel for his pitcher’s tendencies, he can sink into his one knee stance and block a Gerrit Cole knuckle curve in the dirt if he needs to, or get under the pitch and frame it if it’s in the shadow zone.
The sweeper he blocked from Lucas Luetge with the bases loaded was what I like to call a confidence block. Luetge’s strength is using his sweeper for soft contact and chases on his glove side; that he throws it on an 0–1 count with the bases loaded says a lot about his trust in his catcher. And Trevino stuffed the sweeper right in front of him, showing me that he was relaxed as can be. When a pitch is about to hit your chest protector, you’re taught to exhale so you can soften your body and accept the pitch into your stomach rather than stiffening up. Few catchers do that as well as the Yankees’ backstop.
J.T. Realmuto is an iron man behind the plate: He has caught over 130 games in back-to-back years, including a deep playoff run last year where he did not miss a single game. This is a perfect example of an everyday catcher who relies on the one knee down stance to take some wear and tear off his body. Like Trevino, he uses it to his advantage when blocking. Because he is so flexible, he can extend his right leg outwards as far as he can, which lets him get ahead of the movement; in a traditional stance, you have to recognize the pitch, then shoot your leg out for a block.
A spiked changeup is no challenge for Realmuto. His body is already in a perfect position to be a wall for a long or short hop. All he has to do is move his glove to cover his five hole like he did in the first clip. The reason I included the blocked curveball was so that I could highlight how he uses his legs to recover from the block in a one knee down stance. Focus on how his left knee slides inward as the pitch hits his chest protector. That lets him tighten his five hole and put his body in a better position to shoot up quickly. He then pulls in his extended right leg under the center of his body so he can push off both legs to chase the pitch to ensure the runner doesn’t advance. This is not a simple movement; it requires next-level mobility and strength to pop up this quickly. It’s just one of the many strengths of Realmuto’s catching game.
Sean Murphy (no. 4 overall, 12 Blocks Above Average)
As a baseball fan on the east coast, I didn’t always get a chance to watch Sean Murphy display his catching prowess in Oakland. But in doing the research for this piece, I was impressed to see how athletic he is back there. Blocking splitters that hit the plate is a painful job; when any pitch hits the plate, it hardly loses any speed. But Murphy grew up in the bigs catching and blocking this pitch from Frankie Montas, and he is a better defensive catcher for it.
Murphy’s stance — with his behind high up in the air — is reminiscent of an old school catcher preparing to stuff a pitch in the dirt. You’ll notice that in the second GIF, he also uses the one knee down stance to block. Some catchers will vary their stance depending on the pitcher. As I said earlier, blocking splitters is extremely difficult; in fact, I’d bet it’s the toughest pitch for catchers to get in front of when it’s spiked because of how it can bounce off dirt. That’s why Murphy opted for the traditional stance with Montas but went with one knee on a curveball from Jared Koenig. When you know your pitchers, you can be savvy with how you set yourself up for success.
This wouldn’t be an article about great catching without including a Puerto Rican backstop. Tomás Nido is your classic backup defense-first catcher who has made his carer off being an elite framer and blocker. His placement on this list is incredible given that he is only a part-time player. Similar to some of the catchers already highlighted, he is dealing with some electric pitchers with air-bending offerings. I didn’t include traditional chest protector blocks in either clip because I wanted to use Nido as an opportunity to talk about a crucial part of catching/blocking that isn’t always realized: the art of picking.
Picking is a flashy, beautiful move that can only be executed by players with the softest of hands. The retired Yadier Molina always had a knack for picking balls that looked destined for the backstop, and his fellow Puerto Rican Nido is no different. On an overthrown changeup from Max Scherzer, Nido smoothly moves his glove across the zone and effortlessly stops the pitch from getting by him. He did almost the same thing on the spiked changeup from Joely Rodríguez, but in the opposite direction. Picking is something that you do when you know you have no shot at blocking a pitch. It’s a necessary skill that isn’t always rigorously trained, but it should be for that exact reason. Depending on how you were set up, there are times when there is no shot to contort your body in front of the ball. When that time comes, all you have is your glove and your instincts. Nido has proven time and time again he can do this on a pinch.
I hope you’ve come away from this piece learning a thing or two about blocking. There are the obvious things you cannot miss when it comes to blocking, but aspects such as recovery, picking, and exhaling upon impact are all minute details that don’t always get attention. This list of catchers displays those abilities on a routine basis, and that is why they have found themselves atop this new leaderboard.
Opening Day is tomorrow, but not everyone has their legs under them just yet. Take Miguel Vargas, whom I wrote about a couple of weeks ago — he wasn’t even allowed to swing for a quarter of his spring training plate appearances. While he’s swatted three doubles and a homer since taking the bat off his shoulder, he probably wouldn’t have minded at least a handful of extra reps.
And it seems like he isn’t alone. Teams have dealt with the usual rash of injuries this spring, and a sizable portion of Opening Day bats will take the field without the benefit of a full slate of spring training plate appearances. For his part, when Vargas broke his finger, the Dodgers were able to get him some semblance of in-game experience by having him track pitches without swinging. Read the rest of this entry »
This is Kiri’s first piece as a FanGraphs contributor. She lives in the Pacific Northwest while contributing part-time to FanGraphs and working full-time as a data scientist. She spent five years working as an analyst for multiple MLB organizations.
By this point, you’ve undoubtedly consumed considerable content regarding the rule changes arriving in the majors for the upcoming season. You know all about the pitch clock dictating when hitters must ready themselves in the box and when pitchers must start their deliveries, as well as the wrinkle this introduces to pickoff attempts. You’ve also heard about the bigger bases and the limits on defensive shifting. Analysts have projected which players stand to be impacted most by the changes, while players who feel the changes make their jobs more difficult have voiced their concerns, and early spring training action has showcased the growing pains of adoption. With much of the existing commentary zooming in on the micro effects for particular players and game situations, let’s take some time to zoom out and ponder the macro effect on the game as a whole. More specifically, let’s ruminate on what makes a game or sport objectively appealing and how the rules — and subsequent changes to them — influence the appeal of a game.
At the most basic level, games are defined by rules dictating play. For those of us who struggle with authority, rules often feel restrictive. It’s no wonder, since rules come across as real haters, with all their “Don’t do this,” and “Don’t do that,” and “You can do this, but no, no, not like that.” That said, we needn’t have such an adversarial relationship with rules. In his book exploring the game of basketball, Nick Greene notes, “Games are peculiar. They are the only pursuit in which rules are used to facilitate fun.” To better understand the dynamic between rules and fun, Greene interviews a game design professor, Eric Zimmerman, who explains, “One of the paradoxes of game design is that the creativity of play is made possible by play’s opposite, which are rules. Rules are in essence constraints, but games don’t feel that way. […] When the rules are activated, what follows is fluid, unpredictable magic.” The rules of any game are finite, but the universe is infinite, implying that infinitely many possibilities exist in the space not covered by the defined rules. The fun in any game lies in the creativity used to explore the infinite space outside the boundaries set forth by the rules. Read the rest of this entry »