In a Rapid-Fire Pitcher’s Duel, Zack Wheeler and the Phillies Came Out on Top


Well folks, that’s what we call a pitcher’s duel. I don’t think there’s a universal definition for the term, but Wikipedia tells me it’s when both starting pitchers allow very few runners to reach base. That seems about right! Zack Wheeler and Yu Darvish both came up big Tuesday night in San Diego, with each starter limiting the success of the opposing team’s hitters after each offense had put up an incredible performance in their respective Division Series. As the game progressed, both attacked their foes with a variety of pitches spread across the zone. Neither was predictable, and neither gave their manager much reason to remove them, but one made a few more mistakes in a few more at-bats than the other. Those mistakes ended up being the difference in the game.
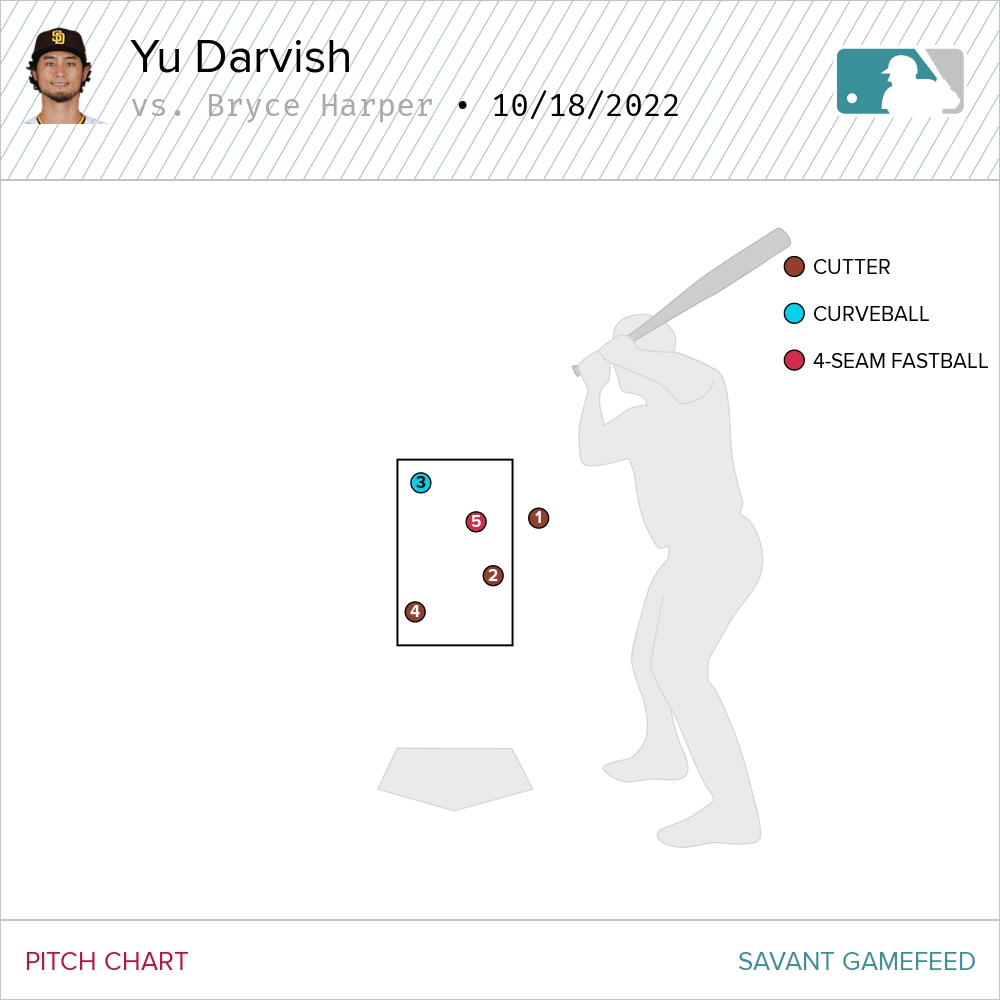
To understand exactly what happened in those at-bats — specifically, why the batter was successful — it helps to know what happened with each pitch and what the pitcher-catcher tandem’s potential thought process was for each of them. John Smoltz always sprinkles in tidbits about pitch sequencing that are worth listening to when he broadcasts a game. It’s easier said than done, but a pitcher holding back some pieces of their repertoire until later in the game — or say, a hitter’s third at-bat — is a good way to maximize deception. If there’s anyone who knows a thing or two about that, it’s Darvish. Darvish’s never-ending pitch mix allows him to change how he attacks hitters as the game progresses. In his first battle against Bryce Harper, he opted for a three-pitch mix and attacked Harper in the zone. No nibbling the first time around: